
BUSINESS ANALYSIS
&VALUATION
USING FINANCIAL STATEMENTS
Copyright 2012 Cengage Learning. All Rights Reserved. May not be copied, scanned, or duplicated, in whole or in part. Due to electronic rights, some third party content may be suppressed from the eBook and/or eChapter(s).
Editorial review has deemed that any suppressed content does not materially affect the overall learning experience. Cengage Learning reserves the right to remove additional content at any time if subsequent rights restrictions require it.

BUSINESS ANALYSIS
&VALUATION
USING FINANCIAL STATEMENTS
5e
KRISHNA G. PALEPU, PhD
Ross Graham Walker Professor of Business Administration
Harvard University
PAUL M. HEALY, PhD, ACA
James R. Williston Professor of Business Administration
Harvard University
Australia • Brazil • Japan • Korea • Mexico • Singapore • Spain • United Kingdom • United States
Copyright 2012 Cengage Learning. All Rights Reserved. May not be copied, scanned, or duplicated, in whole or in part. Due to electronic rights, some third party content may be suppressed from the eBook and/or eChapter(s).
Editorial review has deemed that any suppressed content does not materially affect the overall learning experience. Cengage Learning reserves the right to remove additional content at any time if subsequent rights restrictions require it.
This is an electronic version of the print textbook. Due to electronic rights restrictions,
some third party content may be suppressed. Editorial review has deemed that any suppressed
content does not materially affect the overall learning experience. The publisher reserves the right
to remove content from this title at any time if subsequent rights restrictions require it. For
valuable information on pricing, previous editions, changes to current editions, and alternate
formats, please visit www.cengage.com/highered to search by ISBN#, author, title, or keyword for
materials in your areas of interest.

Business Analysis & Valuation: Using
Financial Statements, 5th edition
Krishna G. Palepu and Paul M. Healy
Senior Vice President, LRS/Acquisitions &
Solutions Planning: Jack W. Calhoun
Editor-in-Chief: Rob Dewey
Senior Acquisitions Editor: Matt Filimonov
Senior Developmental Editor: Craig Avery
Editorial Assistant: A. J. Smiley
Senior Market Development Manager:
Natalie Livingston
Senior Brand Manager: Kristen Hurd
Marketing Manager: Heather Mooney
Marketing Communications Manager:
Sarah Greber
Marketing Coordinator: Eileen Corcoran
Senior Art Director: Stacy Shirley
Production Management, Internal Design,
and Composition: PreMediaGlobal
Media Editor: Bryan England
Rights Acquisition Director: Audrey
Pettengill
Rights Acquisition Specialist, Text and
Image: Audrey Pettengill
Senior Manufacturing Planner: Doug Wilke
Cover Designer: Red Hangar Design
Cover Image(s): ©iStock Photo/
franckreporter
© 2013, 2008 South-Western, Cengage Learning.
ALL RIGHTS RESERVED. No part of this work covered by the copyright
herein may be reproduced, transmitted, stored, or used in any form or by
any means graphic, electronic, or mechanical, including but not limited
to photocopying, recording, scanning, digitizing, taping, web distribution,
information networks, or information storage and retrieval systems,
except as permitted under Section 107 or 108 of the 1976 United States
Copyright Act, without the prior written permission of the publisher.
For product information and technology assistance, contact us at
Cengage Learning Customer & Sales Support, 1-800-354-9706
For permission to use material from this text or product, submit all
requests online at www.cengage.com/permissions.
Further permissions questions can be emailed to
Library of Congress Control Number: 2012948788
Student Edition ISBN 13: 978-1-111-97230-1
Student Edition ISBN 10: 1-111-97230-3
Student Edition with CD ISBN 13: 978-1-285-42618-1
Student Edition with CD ISBN 10: 1-285-42618-5
South-Western
5191 Natorp Boulevard
Mason, OH 45040
USA
Cengage Learning is a leading provider of customized learning solu-
tions with office locations around the globe, including Singapore, the
United Kingdom, Australia, Mexico, Brazil, and Japan. Locate your local
office at: www.cengage.com/global
Cengage Learning products are represented in Canada by
Nelson Education, Ltd.
For your course and learning solutions, visit www.cengage.com
Purchase any of our products at your local college store or at our
preferred online store www.cengagebrain.com.
Printed in the United States of America
12345671615141312
Copyright 2012 Cengage Learning. All Rights Reserved. May not be copied, scanned, or duplicated, in whole or in part. Due to electronic rights, some third party content may be suppressed from the eBook and/or eChapter(s).
Editorial review has deemed that any suppressed content does not materially affect the overall learning experience. Cengage Learning reserves the right to remove additional content at any time if subsequent rights restrictions require it.

PREFACE
F
inancial statements are the basis for a wide range of business analysis. Managers
use them to monitor and judge their firms’ performance relative to competitors,
to communicate with external investors, to help judge what financial policies they
should pursue, and to evaluate potential new businesses to acquire as part of their invest-
ment strategy. Securities analysts use financial statements to rate and value companies
they recommend to clients. Bankers use them in deciding whether to extend a loan to a
client and to determine the terms of the loan. Investment bankers use them as a basis for
valuing and analyzing prospective buyouts, mergers, and acquisitions. And consultants
use them as a basis for competitive analysis for their clients.
Not surprisingly, therefore, we find that there is a strong demand among business stu-
dents for a course that provides a framework for using financial statement data in a vari-
ety of business analysis and valuation contexts. The purpose of this book is to provide
such a framework for business students and practitioners. The first four editions of this
book have succeeded far beyond our expectations in equipping readers with this useful
framework, and the book has gained proponents in accounting and finance departments
in business schools in the United States and around the world.
CHANGES FROM THE FOURTH EDITION
In response to suggestions and comments from colleagues, students, and reviewers, we
have incorporated the following changes in the fifth edition:
• Data, analyses, and issues have been thoroughly updated.
• Where appropriate, lessons have been drawn from current events such as the
global financial crisis of 2008 and the ongoing European debt crisis.
• The financial analysis and valuation chapters (Chapters 6–8) have been updated
with a focus on firms in the U.S. retail department store sector, primarily TJX and
Nordstrom. In addition, we have provided a more cohesive overall discussion of
the four key components of effective financial statement analysis that this book
examines by introducing these companies in our discussion of strategy analysis
in Chapter 2 and staying with them through the accounting, financial, and
prospective analyses that follow.
• We have provided a greatly expanded examination of the impact of accounting
adjustments (introduced in Chapter 4) on company analysis by analyzing both
unadjusted and adjusted financial ratio and cash flow measures for TJX and
Nordstrom in Chapter 5, and by then using adjusted numbers for TJX in the
prospective analysis of Chapters 6–8.
• The topic of U.S. GAAP/IFRS convergence is introduced and examined, with
discussion and examples in comparing companies reporting under U.S. GAAP and
IFRS, and a brief discussion on important remaining differences between U.S.
GAAP and IFRS.
• An expanded discussion of fair value accounting is included, given its increasing
use globally and also its much discussed role in the 2008 financial crisis.
• We have streamlined and greatly enhanced the readability of the discussion on the
theory behind valuation techniques in Chapters 7 and 8.
• In our Text and Cases edition, we have included new and updated Harvard
Business School cases. In all, we include 27 cases in this edition.
v
Copyright 2012 Cengage Learning. All Rights Reserved. May not be copied, scanned, or duplicated, in whole or in part. Due to electronic rights, some third party content may be suppressed from the eBook and/or eChapter(s).
Editorial review has deemed that any suppressed content does not materially affect the overall learning experience. Cengage Learning reserves the right to remove additional content at any time if subsequent rights restrictions require it.
• We are introducing with this edition an online version of the BAV modeling tool,
which represents a significant enhancement of the tool over the previous
spreadsheet-based version. This comprehensive modeling tool implements the
analytical framework and techniques discussed in this book, and allows students to
easily import the financial statements of a company into the model from three
major data providers—Thomson ONE, Capital IQ, and the Compustat database of
the Wharton Research Data Services—as well as to import manually created state-
ments. A user-friendly interface allows the analyst to navigate through the tool
with ease. The tool facilitates the following activities: (1) recasting the reported
financial statements in a standard format for analysis; (2) performing accounting
analysis as discussed in Chapters 3 and 4, making desired accounting adjustments,
and producing restated financials; (3) computing ratios and free cash flows as
presented in Chapter 5; (4) producing forecasted income, balance sheet, and cash
flow statements for as many as 15 years into the future using the approach dis-
cussed in Chapter 6; (5) preparing a terminal value forecast using the abnormal
earnings, the abnormal returns, and discounted cash flow methods as discussed in
Chapters 7 and 8; and (6) valuing a company (either assets or equity) from these
forecasts as also discussed in Chapters 7 and 8. We have seen that the BAV
modeling tool can make it significantly easier for students to apply the framework
and techniques discussed in the book in a real-world context, and we feel that the
new online version, with its enhanced data import flexibility and improved overall
interface, further enhances the usability and usefulness of this tool.
KEY F EATURES
This book differs from other texts in business and financial analysis in a number of
important ways. We introduce and develop a four-part framework for business analysis
and valuation using financial statement data. We then show how this framework can be
applied to a variety of decision contexts.
Framework fo r Analysis
We begin the book with a discussion of the role of accounting information and
intermediaries in the economy, and how financial analysis can create value in well-
functioning markets (Chapter 1). We identify four key components, or steps, of effective
financial statement analysis:
• Business strategy analysis
• Accounting analysis
• Financial analysis
• Prospective analysis
The first step, business strategy analysis (Chapter 2), involves developing an under-
standing of the business and competitive strategy of the firm being analyzed. Incorporat-
ing business strategy into financial statement analysis is one of the distinctive features of
this book. Traditionally, this step has been ignored by other financial statement analysis
books. However, we believe that it is critical to begin financial statement analysis with a
company’s strategy because it provides an important foundation for the subsequent anal-
ysis. The strategy analysis section discusses contemporary tools for analyzing a com-
pany’s industry, its competitive position and sustainability within an industry, and the
company’s corporate strategy.
vi
Preface
Copyright 2012 Cengage Learning. All Rights Reserved. May not be copied, scanned, or duplicated, in whole or in part. Due to electronic rights, some third party content may be suppressed from the eBook and/or eChapter(s).
Editorial review has deemed that any suppressed content does not materially affect the overall learning experience. Cengage Learning reserves the right to remove additional content at any time if subsequent rights restrictions require it.
Accounting analysis (Chapters 3 and 4) involves examining how accounting rules
and conventions represent a firm’s business economics and strategy in its financial state-
ments, and, if necessary, developing adjusted accounting measures of performance. In
the accounting analysis section, we do not emphasize accounting rules. Instead we
develop general approaches to analyzing assets, liabilities, entities, revenues, and
expenses. We believe that such an approach enables students to effectively evaluate a
company’s accounting choices and accrual estimates, even if they have only a basic
knowledge of accounting rules and standards. The material is also designed to allow stu-
dents to make accounting adjustments rather than merely identify questionable account-
ing practices.
Financial analysis (Chapter 5) involves analyzing financial ratio and cash flow mea-
sures of the operating, financing, and investing performance of a company relative to
either key competitors or historical performance. Our distinctive approach focuses on
using financial analysis to evaluate the effectiveness of a company’s strategy and to
make sound financial forecasts.
Finally, in prospective analysis (Chapters 6–8) we show how to develop forecasted
financial statements and how to use these to make estimates of a firm’s value. Our dis-
cussion of valuation includes traditional discounted cash flow models as well as techni-
ques that link value directly to accounting numbers. In discussing accounting-based
valuation models, we integrate the latest academic research with traditional approaches
such as earnings and book value multiples that are widely used in practice.
Although we cover all four steps of business analysis and valuation in the book, we
recognize that the extent of their use depends on the user’s decision context. For exam-
ple, bankers are likely to use business strategy analysis, accounting analysis, financial
analysis, and the forecasting portion of prospective analysis. They are less likely to be
interested in formally valuing a prospective client.
Application of the Framework to Decision Contexts
The next section of the book shows how our business analysis and valuation framework
can be applied to a variety of decision contexts:
• Equity securities analysis (Chapter 9)
• Credit analysis and distress prediction (Chapter 10)
• Merger and acquisition analysis (Chapter 11)
• Communication and governance (Chapter 12)
For each of these topics we present an overview to provide a foundation for the class
discussions. Where possible we bring in relevant real-world scenarios and institutional
details, and also examine the results of academic research that are useful in applying
the analysis concepts developed earlier in the book. For example, the chapter on credit
analysis shows how banks and rating agencies use financial statement data to develop
analyses for lending decisions and to rate public debt issues. This chapter also presents
academic research on how to determine whether a company is financially distressed.
USING THE BOOK
We designed the book so that it is flexible for courses in financial statement analysis for
a variety of student audiences—MBA students, master’s in accounting students, executive
program participants, and undergraduates in accounting or finance. Depending upon the
audience, the instructor can vary the manner in which the conceptual materials in
the chapters and end-of-chapter questions are used. To get the most out of the book,
Preface vii
Copyright 2012 Cengage Learning. All Rights Reserved. May not be copied, scanned, or duplicated, in whole or in part. Due to electronic rights, some third party content may be suppressed from the eBook and/or eChapter(s).
Editorial review has deemed that any suppressed content does not materially affect the overall learning experience. Cengage Learning reserves the right to remove additional content at any time if subsequent rights restrictions require it.
students should have completed basic courses in financial accounting, finance, and either
business strategy or business economics. The text provides a concise overview of some of
these topics. But it would probably be difficult for students with no prior knowledge in
these fields to use the chapters as stand-alone coverage of them.
If the book is used for students with prior working experience or for executives, the
instructor can use almost a pure case approach, adding relevant lecture sections as
needed. When teaching students with little work experience, a lecture class can be pre-
sented first, followed by an appropriate case or other assignment material. Alternatively,
lectures can be used as a follow-up to cases to more clearly lay out the conceptual issues
raised in the case discussions. This may be appropriate when the book is used in under-
graduate capstone courses. In such a context, cases can be used in course projects that
can be assigned to student teams.
ACKNOWLEDGMENTS
The first edition of this book was co-authored with our colleague and friend, Victor
Bernard. Vic was the Price Waterhouse Professor of Accounting and Director of the
Paton Accounting Center at the University of Michigan. He passed away unexpectedly on
November 14, 1995. While we no longer list Vic as a co-author, we wish to acknowledge
his enduring contributions to our own views on financial analysis and valuation, and to the
ideas reflected in this book.
We also wish to thank Scott Renner for his tireless research assistance in the revision
of the text chapters and in refining the online BAV model; Trenholm Ninestein of the
HBS Information Technology Group for his help in the development of the online
BAV model; Chris Allen and Kathleen Ryan of HBS Knowledge and Library Services
for assistance with data on financial ratios for U.S. companies; the Division of Research
at the Harvard Business School for assistance in developing materials for this book; and
our past and present MBA students for stimulating our thinking and challenging us to
continually improve our ideas and presentation.
We especially thank the following colleagues who gave us feedback as we wrote this
edition: Patricia Beckenholdt, University of Maryland University College; Timothy P.
Dimond, Northern Illinois University; Jocelyn Kauffunger, University of Pittsburgh;
Suneel Maheshwari, Marshall University; K. K. Raman, University of North Texas; Lori
Smith, University of Southern California; Vic Stanton, University of California, Berkeley;
Charles Wasley, University of Rochester.
We are also very grateful to Laurie Palepu and Deborah Marlino for their help
and assistance throughout this project. Special gratitude goes to Rob Dewey and Matt
Filimonov for their publishing leadership on this edition, to our colleagues, and to
Craig Avery and Heather Mooney at Cengage and Kalpana Venkatramani, project
manager at PreMediaGlobal, for their developmental, marketing, and production help.
We would like to thank our parents and families for their strong support and encourage-
ment throughout this project.
Krishna G. Palepu
Paul M. Healy
viii
Preface
Copyright 2012 Cengage Learning. All Rights Reserved. May not be copied, scanned, or duplicated, in whole or in part. Due to electronic rights, some third party content may be suppressed from the eBook and/or eChapter(s).
Editorial review has deemed that any suppressed content does not materially affect the overall learning experience. Cengage Learning reserves the right to remove additional content at any time if subsequent rights restrictions require it.

AUTHORS
Krishna G. Palepu is the Ross Graham Walker Professor of Business Administration and
Senior Associate Dean for International Development at the Harvard Business School,
Harvard University. He also serves as Senior Adviser to the President for Global Strategy
at Harvard University. Prior to assuming his current leadership positions, Professor Palepu
held other positions at the School, including Senior Associate Dean, Director of Research,
and Unit Chair.
Professor Palepu’s current research and teaching activities focus on strategy and gover-
nance. In the area of strategy, his recent focus has been on the globalization of emerging
markets. He is a co-author of the book on this topic, Winning in Emerging Markets:
A Road Map for Strategy and Execution. He developed and taught a second year MBA
course, “Globalization of Emerging Markets,” which focuses on these issues. In addition,
Professor Palepu chairs the HBS executive education programs “Global CEOs Program
for China” and “Building Businesses in Emerging Markets.”
In the area of corporate governance, Professor Palepu’s work focuses on board engage-
ment with strategy. Professor Palepu teaches in several HBS executive education programs
aimed at members of corporate boards: “How to Make Corporate Boards More Effective,”
“Audit Committees in the New Era of Governance,”“Compensation Committees: New
Challenges, New Solutions.” Professor Palepu has served on a number of public company
and nonprofit Boards. He has also been on the Editorial Boards of leading academic jour-
nals, and has served as a consultant to a wide variety of businesses. In addition, he is a
researcher at the National Bureau of Economic Research (NBER).
Professor Palepu has a doctorate in management from the Massachusetts Institute of
Technology and an honorary doctorate from the Helsinki School of Economics and Busi-
ness Administration.
Paul M. Healy is the James R. Williston Professor of Business Administration and Senior
Associate Dean, Director of Research at the Harvard Business School, Harvard University.
Professor Healy joined Harvard Business School as a Professor of Business Administration
in 1997. His primary teaching and research interests include corporate governance and
accountability, equity research at financial services firms, strategic financial analysis and
financial reporting. Professor Healy teaches in several executive education programs
and is faculty co-chair of Strategic Financial Analysis for Business Evaluation. Professor
Healy received his B.C.A. Honors (1st Class) in Accounting and Finance from Victoria
University, New Zealand, in 1977, his M.S. in Economics from the University of Rochester
in 1981, his Ph.D. in Business from the University of Rochester in 1983, and is a
New Zealand CPA. In New Zealand, Professor Healy worked for Arthur Young and ICI.
Prior to joining Harvard, Professor Healy spent fourteen years on the faculty at the M.I.T.
Sloan School of Management, where he received awards for teaching excellence in 1991,
1992, and 1997. In 1993–94 he served as Deputy Dean at the Sloan School, and in 1994–95
he was a visiting professor at London Business School and Harvard Business School.
Professor Healy’s research includes studies of the performance of financial analysts, corporate
governance, the performance of mergers, corporate disclosure, and managers’ financial reporting
decisions. His work has been published in leading journals in accounting and finance. In 1990, his
article “The Effect of Bonus Schemes on Accounting Decisions,” published in Journal of Account-
ing and Economics, was awarded the AICPA/AAA Notable Contribution Award. His text Busi-
ness Analysis and Valuation was awarded the AICPA/AAA’s Wildman Medal for contributions
to the practice in 1997, and the AICPA/AAA Notable Contribution Award in 1998.
ix
Copyright 2012 Cengage Learning. All Rights Reserved. May not be copied, scanned, or duplicated, in whole or in part. Due to electronic rights, some third party content may be suppressed from the eBook and/or eChapter(s).
Editorial review has deemed that any suppressed content does not materially affect the overall learning experience. Cengage Learning reserves the right to remove additional content at any time if subsequent rights restrictions require it.

CONTENTS
PART 1 FRAMEWORK
Chapter 1 A Framework for Business Analysis and Valuation
Using Financial Statements
1-3
The Role of Financial Reporting in Capital Markets 1-4
From Business Activities to Financial Statements 1-6
Influences of the Accounting System on Information Quality 1-6
Feature 1: Accrual Accounting 1-6
Feature 2: Accounting Conventions and Standards 1-7
Feature 3: Managers’ Reporting Strategy 1-8
Feature 4: Auditing 1-9
From Financial Statements to Business Analysis 1-10
Analysis Step 1: Business Strategy Analysis 1-11
Analysis Step 2: Accounting Analysis 1-12
Analysis Step 3: Financial Analysis 1-12
Analysis Step 4: Prospective Analysis 1-12
Summary 1-13
Discussion Questions 1-13
Notes 1-14
PART 2 BUSINESS ANALYSIS AND VALUATION TOOLS
Chapter 2 Strategy Analysis
2-3
Industry Analysis 2-3
Degree of Actual and Potential Competition 2-4
Bargaining Power in Input and Output Markets 2-7
Applying Industry Analysis: The U.S. Retail Department Store Industry 2-8
Competition in the U.S. Retail Department Store Industry 2-8
The Power of Buyers and Suppliers 2-10
Limitations of Industry Analysis 2-11
Competitive Strategy Analysis 2-11
Sources of Competitive Advantage 2-12
Achieving Competitive Advantage 2-13
Sustaining Competitive Advantage 2-13
Applying Competitive Strategy Analysis 2-14
x
Copyright 2012 Cengage Learning. All Rights Reserved. May not be copied, scanned, or duplicated, in whole or in part. Due to electronic rights, some third party content may be suppressed from the eBook and/or eChapter(s).
Editorial review has deemed that any suppressed content does not materially affect the overall learning experience. Cengage Learning reserves the right to remove additional content at any time if subsequent rights restrictions require it.
Corporate Strategy Analysis 2-16
Sources of Value Creation at the Corporate Level 2-17
Applying Corporate Strategy Analysis 2-18
Summary 2-21
Discussion Questions 2-22
Notes 2-23
Chapter 3 Overview of Accounting Analysis 3-1
The Institutional Framework for Financial Reporting 3-1
Accrual Accounting 3-1
Delegation of Reporting to Management 3-2
Generally Accepted Accounting Principles 3-3
External Auditing 3-5
Legal Liability 3-6
Factors Influencing Accounting Quality 3-6
Noise from Accounting Rules 3-7
Forecast Errors 3-7
Managers’ Accounting Choices 3-7
Steps in Performing Accounting Analysis 3-9
Step 1: Identify Principal Accounting Policies 3-9
Step 2: Assess Accounting Flexibility 3-9
Step 3: Evaluate Accounting Strategy 3-10
Step 4: Evaluate the Quality of Disclosure 3-10
Step 5: Identify Potential Red Flags 3-12
Step 6: Undo Accounting Distortions 3-13
Accounting Analysis Pitfalls 3-14
1. Conservative Accounting Is Not “Good” Accounting 3-14
2. Not All Unusual Accounting Is Questionable 3-14
Value of Accounting Data and Accounting Analysis 3-15
Summary 3-16
Discussion Questions 3-16
Notes 3-17
Chapter 4 Implementing Accounting Analysis 4-1
Recasting Financial Statements 4-2
Making Accounting Adjustments 4-7
Asset Distortions 4-7
Liability Distortions 4-20
Equity Distortions 4-23
Comparing Companies Using U.S. GAAP and IFRS 4-24
Application to TJX and Nordstrom 4-28
Contents xi
Copyright 2012 Cengage Learning. All Rights Reserved. May not be copied, scanned, or duplicated, in whole or in part. Due to electronic rights, some third party content may be suppressed from the eBook and/or eChapter(s).
Editorial review has deemed that any suppressed content does not materially affect the overall learning experience. Cengage Learning reserves the right to remove additional content at any time if subsequent rights restrictions require it.
Summary 4-30
Discussion Questions 4-31
Notes 4-36
Appendix A: Recasting Financial Statements into Standardized
Templates
4-37
Appendix B: Nordstrom, Inc. Operating Lease Adjustment 4-45
Chapter 5 Financial Analysis 5-1
Ratio Analysis 5-1
Measuring Overall Profitability 5-3
Decomposing Profitability: Traditional Approach 5-4
Decomposing Profitability: Alternative Approach 5-6
Assessing Operating Management: Decomposing Net Profit Margins 5-8
Gross Profit Margins 5-9
Selling, General, and Administrative Expenses 5-10
Tax Expense 5-11
Evaluating Investment Management: Decomposing Asset Turnover 5-12
Working Capital Management 5-12
Long-Term Assets Management 5-13
Evaluating Financial Management: Analyzing Financial Leverage 5-15
Current Liabilities and Short-Term Liquidity 5-16
Debt and Long-Term Solvency 5-17
Ratios of Disaggregated Data 5-19
Putting It All Together: Assessing Sustainable Growth Rate 5-20
Historical Patterns of Ratios for U.S. Firms 5-21
Cash Flow Analysis 5-22
Cash Flow and Funds Flow Statements 5-22
Analyzing Cash Flow Information 5-24
Analysis of TJX’s and Nordstrom’s Cash Flow 5-27
Summary 5-27
Discussion Questions 5-28
Notes 5-29
Appendix A: The TJX Companies, Inc. Financial Statements 5-31
Appendix B: Nordstrom, Inc. Financial Statements 5-37
Chapter 6 Prospective Analysis: Forecasting 6-1
The Overall Structure of the Forecast 6-1
A Practical Framework for Forecasting 6-2
Performance Behavior: A Starting Point 6-3
Sales Growth Behavior 6-3
Earnings Behavior 6-4
xii Contents
Copyright 2012 Cengage Learning. All Rights Reserved. May not be copied, scanned, or duplicated, in whole or in part. Due to electronic rights, some third party content may be suppressed from the eBook and/or eChapter(s).
Editorial review has deemed that any suppressed content does not materially affect the overall learning experience. Cengage Learning reserves the right to remove additional content at any time if subsequent rights restrictions require it.
Return on Equity Behavior 6-5
The Behavior of Components of ROE 6-6
Other Forecasting Considerations 6-7
Strategy, Accounting, and Financial Analysis and Forecasting 6-7
Macroeconomic Factors and Forecasting 6-8
Making Forecasts 6-8
Developing a Sales Growth Forecast 6-9
Developing a NOPAT Margin Forecast 6-11
Developing a Working Capital to Sales Forecast 6-12
Developing a Long-Term Assets to Sales Forecast 6-12
Developing a Capital Structure Forecast 6-12
Cash Flow Forecasts 6-13
Sensitivity Analysis 6-13
Seasonality and Interim Forecasts 6-15
Summary 6-16
Discussion Questions 6-17
Notes 6-18
Appendix: The Behavior of Components of ROE 6-20
Chapter 7 Prospective Analysis: Valuation Theory
and Concepts
7-1
Valuation Using Price Multiples 7-2
Key Issues with Multiples-Based Valuation 7-2
The Discounted Dividend Valuation Method 7-3
The Discounted Abnormal Earnings Valuation Method 7-4
Accounting Methods and Discounted Abnormal Earnings 7-5
Revisiting Price Multiple Valuations 7-7
Value-to-Book Equity Multiple 7-7
Value-to-Earnings Multiple 7-8
Shortcut Forms of Earnings-Based Valuation 7-10
Abnormal Earnings Simplification 7-10
ROE and Growth Simplifications 7-11
The Discounted Cash Flow Model 7-12
Comparing Valuation Methods 7-13
Differences in Focus 7-13
Differences in Required Structure 7-13
Differences in Terminal Value Implications 7-14
Summary 7-15
Discussion Questions 7-16
Notes 7-17
Contents xiii
Copyright 2012 Cengage Learning. All Rights Reserved. May not be copied, scanned, or duplicated, in whole or in part. Due to electronic rights, some third party content may be suppressed from the eBook and/or eChapter(s).
Editorial review has deemed that any suppressed content does not materially affect the overall learning experience. Cengage Learning reserves the right to remove additional content at any time if subsequent rights restrictions require it.

Appendix A: Time Value of Money: Present and Future Values 7-18
Appendix B: Valuation Formulas 7-21
Appendix C: Reconciling the Discounted Dividends and Discounted
Abnormal Earnings Models
7-21
Appendix D: Asset Valuation Methodologies 7-22
Chapter 8 Prospective Analysis: Valuation Implementation 8-1
Detailed Forecasts of Performance 8-1
Making Performance Forecasts for Valuing TJX 8-2
Terminal Values 8-2
Terminal Values with the Competitive Equilibrium Assumption 8-4
Competitive Equilibrium Assumption Only on Incremental Sales 8-5
Terminal Value with Persistent Abnormal Performance and Growth 8-5
Terminal Value Based on a Price Multiple 8-6
Selecting the Terminal Year 8-6
Estimates of TJX’s Terminal Value 8-7
Computing a Discount Rate 8-8
Estimating TJX’s Cost of Equity 8-10
Adjusting Cost of Equity for Changes in Leverage 8-10
Computing Equity Value 8-11
Value Estimates Versus Market Values 8-12
Sensitivity Analysis 8-13
Some Practical Issues in Valuation 8-13
Dealing with Accounting Distortions 8-13
Dealing with Negative Book Values 8-14
Dealing with Excess Cash and Excess Cash Flow 8-14
Summary 8-15
Discussion Questions 8-15
Notes 8-16
Appendix: Estimating TJX’s Overall Asset Value 8-17
PART 3 BUSINESS ANALYSIS AND VALUATION
APPLICATIONS
Chapter 9 Equity Security Analysis 9-3
Investor Objectives and Investment Vehicles 9-4
Equity Security Analysis and Market Efficiency 9-5
Market Efficiency and the Role of Financial Statement Analysis 9-6
Market Efficiency and Managers’ Financial Reporting Strategies 9-6
Evidence of Market Efficiency 9-6
xiv Contents
Copyright 2012 Cengage Learning. All Rights Reserved. May not be copied, scanned, or duplicated, in whole or in part. Due to electronic rights, some third party content may be suppressed from the eBook and/or eChapter(s).
Editorial review has deemed that any suppressed content does not materially affect the overall learning experience. Cengage Learning reserves the right to remove additional content at any time if subsequent rights restrictions require it.
Approaches to Fund Management and Securities Analysis 9-7
Active Versus Passive Management 9-7
Quantitative Versus Traditional Fundamental Analysis 9-7
Formal Versus Informal Valuation 9-8
The Process of Comprehensive Security Analysis 9-8
Selection of Candidates for Analysis 9-8
Inferring Market Expectations 9-9
Developing the Analyst’s Expectations 9-11
The Final Product of Security Analysis 9-12
Performance of Security Analysts and Fund Managers 9-13
Performance of Sell-Side Analysts 9-13
Performance of Fund Managers 9-14
Summary 9-15
Discussion Questions 9-15
Notes 9-17
Chapter 10 Credit Analysis and Distress Prediction 10-1
Why do Firms Use Debt Financing? 10-2
The Market for Credit 10-3
Commercial Banks 10-3
Non-Bank Financial Institutions 10-4
Public Debt Markets 10-4
Sellers Who Provide Financing 10-4
The Credit Analysis Process in Private Debt Markets 10-5
Step 1: Consider the Nature and Purpose of the
Loan
10-5
Step 2: Consider the Type of Loan and Available
Security
10-6
Step 3: Conduct a Financial Analysis of the
Potential Borrower
10-7
Step 4: Assemble the Detailed Loan Structure, Including
Loan Covenants
10-8
Financial Statement Analysis and Public Debt 10-10
The Meaning of Debt Ratings 10-10
Factors That Drive Debt Ratings 10-12
Prediction of Distress and Turnaround 10-14
Models for Distress Prediction 10-15
Investment Opportunities in Distressed Companies 10-16
Credit Ratings and the Subprime Crisis 10-16
Summary 10-18
Discussion Questions 10-19
Notes 10-20
Contents xv
Copyright 2012 Cengage Learning. All Rights Reserved. May not be copied, scanned, or duplicated, in whole or in part. Due to electronic rights, some third party content may be suppressed from the eBook and/or eChapter(s).
Editorial review has deemed that any suppressed content does not materially affect the overall learning experience. Cengage Learning reserves the right to remove additional content at any time if subsequent rights restrictions require it.
Chapter 11 Mergers and Acquisitions 11-1
Motivation for Merger or Acquisition 11-2
Motivation for Pfizer’s Acquisition of Wyeth 11-4
Acquisition Pricing 11-5
Analyzing Premium Offered to Target Stockholders 11-6
Analyzing Value of the Target to the Acquirer 11-7
Earnings Multiples 11-7
Discounted Abnormal Earnings or Cash Flows 11-8
Pfizer’s Pricing of Wyeth 11-10
Acquisition Financing and Form of Payment 11-11
Effect of Form of Payment on Acquiring Stockholders 11-11
Capital Structure Effects of Form of Financing 11-11
Information Problems and the Form of Financing 11-12
Control and the Form of Payment 11-12
Effect of Form of Payment on Target Stockholders 11-13
Tax Effects of Different Forms of Consideration 11-13
Transaction Costs and the Form of Payment 11-13
Pfizer’s Financing of Wyeth 11-14
Acquisition Outcome 11-14
Other Potential Acquirers 11-14
Target Management Entrenchment 11-15
Antitrust and Security Issues 11-16
Analysis of Outcome of Pfizer’s Offer for Wyeth 11-17
Summary 11-17
Discussion Questions 11-18
Notes 11-19
Chapter 12 Communication and Governance 12-1
Governance Overview 12-2
Management Communication with Investors 12-4
A Word of Caution 12-5
Example: Communication Issues for Jefferies Group, Inc. 12-5
Communication Through Financial Reporting 12-6
Accounting as a Means of Management Communication 12-7
Factors That Increase the Credibility of Accounting Communication 12-7
Accounting Standards and Auditing 12-7
Monitoring by Financial Analysts and Ratings Agencies 12-7
Management Reputation 12-8
Limitations of Financial Reporting for Investor Communication 12-8
Accounting Rule Limitations 12-8
Auditor, Analyst, and other Intermediary Limitations 12-8
xvi Contents
Copyright 2012 Cengage Learning. All Rights Reserved. May not be copied, scanned, or duplicated, in whole or in part. Due to electronic rights, some third party content may be suppressed from the eBook and/or eChapter(s).
Editorial review has deemed that any suppressed content does not materially affect the overall learning experience. Cengage Learning reserves the right to remove additional content at any time if subsequent rights restrictions require it.
Management Credibility Problems 12-9
Example: Accounting Communication for Jefferies 12-9
Communication Through Financial Policies 12-10
Dividend Payout Policies 12-10
Stock Repurchases 12-10
Financing Choices 12-11
Hedging 12-11
Example: Financial Policies at Jefferies 12-12
Alternate Forms of Investor Communication 12-13
Analyst Meetings 12-13
Voluntary Disclosure 12-13
Example: Other Forms of Communication at Jefferies 12-14
The Role of the Auditor 12-15
Role of Financial Analysis Tools in Auditing 12-16
Example: Auditing Jefferies 12-17
The Role of the Audit Committee in the United States 12-18
Summary 12-19
Discussion Questions 12-20
Notes 12-21
Subject Index I-1
Name Index I-9
Contents xvii
Copyright 2012 Cengage Learning. All Rights Reserved. May not be copied, scanned, or duplicated, in whole or in part. Due to electronic rights, some third party content may be suppressed from the eBook and/or eChapter(s).
Editorial review has deemed that any suppressed content does not materially affect the overall learning experience. Cengage Learning reserves the right to remove additional content at any time if subsequent rights restrictions require it.

PART
1
FRAMEWORK
CHAPTER 1
A Framework for Business Analysis and Valuation
Using Financial Statements
Copyright 2012 Cengage Learning. All Rights Reserved. May not be copied, scanned, or duplicated, in whole or in part. Due to electronic rights, some third party content may be suppressed from the eBook and/or eChapter(s).
Editorial review has deemed that any suppressed content does not materially affect the overall learning experience. Cengage Learning reserves the right to remove additional content at any time if subsequent rights restrictions require it.

Chapter
1
A FRAMEWORK FOR
BUSINESS ANALYSIS
AND VALUATION USING
FINANCIAL STATEMENTS
T
his chapter outlines a comprehensive framework for financial statement analysis.
Because financial statements provide the most widely available data on public
corporations’ economic activities, investors and other stakeholders rely on
financial reports to assess the plans and performance of firms and corporate managers.
A variety of questions can be addressed by business analysis using financial
statements, as shown in the following examples:
• A security analyst may be interested in asking: “How well is the firm I am follow-
ing performing? Did the firm meet my performance expectations? If not, why not?
What is the value of the firm’s stock given my assessment of the firm’s current and
future performance?”
• A loan officer may need to ask: “What is the credit risk involved in lending a cer-
tain amount of money to this firm? How well is the firm managing its liquidity
and solvency? What is the firm’s business risk? What is the additional risk created
by the firm’s financing and dividend policies?”
• A management consultant might ask: “What is the structure of the industry in
which the firm is operating? What are the strategies pursued by various players
in the industry? How have these factors affected the relative performance of differ-
ent firms in the industry?”
• A corporate manager may ask: “Is my firm properly valued by investors? Is our
investor communication program adequate to facilitate this process?” or “Is this
firm a potential takeover target? How much value can be added if we acquire this
firm? How can we finance the acquisition?”
• An independent auditor would want to ask: “Are the accounting policies and
accrual estimates in this company ’s financial statements consistent with my under-
standing of this business and its recent performance? Do these financial reports
communicate the current status and significant risks of the business?”
The structure of state economies during the twentieth and early twenty-first centuries has
generally fallen into one of two distinct and broad ideologies for channeling savings into
business investments—capitalism and central planning. The capitalist market model broadly
relies on the market mechanism to govern economic activity, and decisions regarding
investments are made privately. Centrally planned economies have used central planning and
government agencies to pool national savings and to direct investments in business enterprises.
The failure of the central planning model is evident from the fact that at this point most of
1-3
Copyright 2012 Cengage Learning. All Rights Reserved. May not be copied, scanned, or duplicated, in whole or in part. Due to electronic rights, some third party content may be suppressed from the eBook and/or eChapter(s).
Editorial review has deemed that any suppressed content does not materially affect the overall learning experience. Cengage Learning reserves the right to remove additional content at any time if subsequent rights restrictions require it.
these economies have partly or entirely abandoned it in favor of the market model. As a result,
in almost all countries in the world today, capital markets play an important role in channeling
financial resources from savers to business enterprises that need capital.
Financial statement analysis is a valuable activity when managers have in-depth
information on a firm’s strategies and performance and a variety of institutional factors
make it unlikely that they fully disclose this information. In this setting, outside analysts
attempt to create “inside information” from analyzing financial statement data, thereby
gaining valuable insights about the firm’s current performance and future prospects.
To understand the contribution that financial statement analysis can make, it is important
to understand the role of financial reporting in the functioning of capital markets and the
institutional forces that shape financial statements. Therefore, we first present a brief
description of these forces followed by a discussion of the steps that an analyst must
perform to extract information from financial statements and provide meaningful forecasts.
THE ROLE OF FINANCIAL REPORTING IN CAPITAL MARKETS
A critical challenge for any economy is the allocation of savings to investment opportu-
nities. Economies that do this well can exploit new business ideas to spur innovation and
create jobs and wealth at a rapid pace. In contrast, economies that manage this process
poorly tend to dissipate their wealth and fail to support business opportunities.
Figure 1-1 provides a schematic representation of how capital markets typically work in a
broad sense. Savings in an economy are widely distributed among households. There are
usually many new entrepreneurs and existing companies that would like to attract these sav-
ings to fund their business ideas. While both savers and entrepreneurs would like to do busi-
ness with each other, matching savings to business investment opportunities is complicated
for at least three reasons. First, entrepreneurs typically have better information than savers
on the value of business investment opportunities. Second, communication by entrepreneurs
to investors is not completely credible because investors know entrepreneurs have an incen-
tive to inflate the value of their ideas. Third, savers generally lack the financial sophistication
needed to analyze and differentiate among the various business opportunities.
These information and incentive problems lead to what economists call the “lemons”
problem, which can potentially break down the functioning of capital markets.
1
It works
like this: Consider a situation where half the business ideas are “good” and the other half are
“bad.” If investors cannot distinguish between the two types of business ideas, entrepreneurs
with bad ideas will try to claim that their ideas are as valuable as the good ideas. Realizing this
possibility, investors value both good and bad ideas at an average level. Unfortunately, this
penalizes good ideas, and entrepreneurs with good ideas find the terms on which they can
get financing to be unattractive. As these entrepreneurs leave the capital market, the propor-
tion of bad ideas in the market increases. Over time, bad ideas “crowd out” good ideas, and
investors lose confidence in this market.
The emergence of the institutions that make up a fully formed capital market system
can prevent such a market breakdown. Financial intermediaries such as venture capital
and private equity firms, banks, mutual funds, and insurance companies focus on aggre-
gating funds from individual investors and distributing those funds to businesses seeking
sources of capital. Information intermediaries such as auditors and company audit com-
mittees serve as credibility enhancers to provide an independent assessment of business
claims. Information analyzers and advisors such as financial analysts, credit rating agen-
cies and the financial press are another type of information intermediary that collect and
analyze business information used to make business decisions. Transaction facilitators
such as stock exchanges and brokerage houses play a crucial role in capital markets by
providing a platform that facilitates buying and selling in markets. Finally, regulators
1-4
PART 1 • Framework
Copyright 2012 Cengage Learning. All Rights Reserved. May not be copied, scanned, or duplicated, in whole or in part. Due to electronic rights, some third party content may be suppressed from the eBook and/or eChapter(s).
Editorial review has deemed that any suppressed content does not materially affect the overall learning experience. Cengage Learning reserves the right to remove additional content at any time if subsequent rights restrictions require it.

such as the Securities and Exchange Commission (SEC) and the Financial Accounting
Standards Board (FASB) in the United States create appropriate regulatory policy that
establishes the legal framework of the capital market system, while adjudicators such as
the court system resolve disputes that arise between participants.
2
In a well-functioning
capital market, the market institutions described above add value by both helping inves-
tors distinguish good investment opportunities from bad ones and by directing funding
to those business ideas deemed most promising.
Financial reporting plays a critical role in the effective functioning of the capital markets.
Information intermediaries attempt to add value by either enhancing the credibility of finan-
cial reports (as auditors do) or by analyzing the information in financial statements (as ana-
lysts and the rating agencies do). Financial intermediaries rely on the information in financial
statements to analyze investment opportunities, and they supplement this with information
from other sources, including the analysis and perspective of the information intermediaries.
Ideally, the different intermediaries serve as a system of checks and balances to ensure
the efficient functioning of the capital markets system. However, this is not always the
case, as on occasion they mutually reinforce rather than counterbalance each other. This
can arise from imperfections in financial and information intermediaries’ incentives, gover-
nance issues within the intermediary organizations themselves, and conflicts of interest, as
evidenced by the spectacular failures of companies such as Enron and WorldCom in the
FIGURE 1- 1 Capital Markets
Regulators/Adjudicators
Capital Markets
Savings
Transaction Facilitators
Transaction Platform
Business
Ideas
Financial
Intermediaries
–Aggregators and
Distributors
Information
Intermediaries
–Credibility
Enhancers
–Information
Analyzers and
Advisors
Source: © Cengage Learning
A Framework for Business Analysis and Valuation Using Financial Statements 1-5
Copyright 2012 Cengage Learning. All Rights Reserved. May not be copied, scanned, or duplicated, in whole or in part. Due to electronic rights, some third party content may be suppressed from the eBook and/or eChapter(s).
Editorial review has deemed that any suppressed content does not materially affect the overall learning experience. Cengage Learning reserves the right to remove additional content at any time if subsequent rights restrictions require it.
early part of the new century,
3
and more recently companies such as Lehman Brothers,
New Century Financial, and a host of others during the recent global financial crisis.
The examples above demonstrate that while this market mechanism over time has
been seen to function efficiently with prices reflecting all available information on a par-
ticular investment, individual securities may still be mispriced, thereby justifying the
need for financial statement analysis.
In the following section, we discuss key aspects of the financial reporting system design
that enable it to effectively play this vital role in the functioning of the capital markets.
FROM BUSINESS A CTIV ITIES TO FINANCIAL STATEME NTS
Corporate managers are responsible for acquiring physical and financial resources from
the firm’s environment and using them to create value for the firm’s investors. Value is
created when the firm earns a return on its investment in excess of the cost of capital.
Managers formulate business strategies to achieve this goal, and they implement them
through business activities. A firm’s business activities are influenced by its economic
environment and its own business strategy. The economic environment includes the
firm’s industry, its input and output markets, and the regulations under which the firm
operates. The firm’ s business strategy determines how the firm positions itself in its envi-
ronment to achieve a competitive advantage.
As shown in Figure 1-2, a firm’s financial statements summarize the economic conse-
quences of its business activities. The firm’s business activities in any time period are too
numerous to be reported individually to outsiders. Further, some of the activities under-
taken by the firm are proprietary in nature, and disclosing these in detail could be a det-
riment to the firm’s competitive position. The accounting system provides a mechanism
through which business activities are selected, measured, and aggregated into financial
statement data.
INFLUENCES OF T HE ACCOUNTING SYSTEM
ON INFORMATION QUALITY
Intermediaries using financial statement data to do business analysis have to be aware
that financial reports are influenced both by the firm’s business activities and by its
accounting system. A key aspect of financial statement analysis, therefore, involves under-
standing the influence of the accounting system on the quality of the financial statement
data being used in the analysis. The institutional features of accounting systems discussed
below determine the extent of that influence.
Feat ure 1: Accrual Accounting
One of the fundamental features of corporate financial reports is that they are prepared
using accrual rather than cash accounting. Unlike cash accounting, accrual accounting
distinguishes between the recording of costs and benefits associated with economic activ-
ities and the actual payment and receipt of cash. Net income is the primary periodic per-
formance index under accrual accounting. To compute net income, the effects of
economic transactions are recorded on the basis of expected, not necessarily actual, cash
receipts and payments. Expected cash receipts from the delivery of products or services
are recognized as revenues, and expected cash outflows associated with these revenues
are recognized as expenses.
The need for accrual accounting arises from investors’ demand for financial reports
on a periodic basis. Because firms undertake economic transactions on a continual
1-6
PART 1 • Framework
Copyright 2012 Cengage Learning. All Rights Reserved. May not be copied, scanned, or duplicated, in whole or in part. Due to electronic rights, some third party content may be suppressed from the eBook and/or eChapter(s).
Editorial review has deemed that any suppressed content does not materially affect the overall learning experience. Cengage Learning reserves the right to remove additional content at any time if subsequent rights restrictions require it.

basis, the arbitrary closing of accounting books at the end of a reporting period leads to a
fundamental measurement problem. Since cash accounting does not report the full eco-
nomic consequence of the transactions undertaken in a given period, accrual accounting
is designed to provide more complete information on a firm ’s periodic performance.
Feature 2: Accounting Conventions and Standards
The use of accrual accounting lies at the center of many important complexities in cor-
porate financial reporting. Because accrual accounting deals with expectations of future
cash consequences of current events, it is subjective and relies on a variety of assump-
tions. Who should be charged with the primary responsibility of making these ass-
umptions? In the current system, a firm’s managers are entrusted with the task of
making the appropriate estimates and assumptions to prepare the financial statements
because they have intimate knowledge of their firm’s business.
The accounting discretion granted to managers is potentially valuable because it
allows them to reflect inside information in reported financial statements. However,
FIGURE 1- 2 From Business Activities to Financial Statements
Business Environment
Labor markets
Capital markets
Product markets:
Suppliers
Customers
Competitors
Business regulations
Business Activities
Operating activities
Investment activities
Financing activities
Accounting System
Measure and report
economic
consequences of
business activities.
Financial Statements
Managers’ superior
information on
business activities
Estimation errors
Distortions from man-
agers’ accounting
choices
Business Strategy
Scope of business:
Degree of diversication
Type of diversication
Competitive positioning:
Cost leadership
Differentiation
Key success factors and
risks
Accounting Strategy
Choice of accounting
policies
Choice of accounting
estimates
Choice of reporting format
Choice of supplementary
disclosures
Accounting Environment
Capital market structure
Contracting and
governance
Accounting conventions
and regulations
Tax and nancial
accounting linkages
Third-party auditing
Legal system for
accounting disputes
Source: © Cengage Learning
A Framework for Business Analysis and Valuation Using Financial Statements 1-7
Copyright 2012 Cengage Learning. All Rights Reserved. May not be copied, scanned, or duplicated, in whole or in part. Due to electronic rights, some third party content may be suppressed from the eBook and/or eChapter(s).
Editorial review has deemed that any suppressed content does not materially affect the overall learning experience. Cengage Learning reserves the right to remove additional content at any time if subsequent rights restrictions require it.
since investors view profits as a measure of managers’ performance, managers have
incentives to use their accounting discretion to distort reported profits by making biased
assumptions. Further, the use of accounting numbers in contracts between the firm and
outsiders provides another motivation for management manipulation of accounting
numbers. Income management distorts financial accounting data, making them less valu-
able to external users of financial statements. Therefore, the delegation of financial
reporting decisions to corporate managers has both costs and benefits.
A number of accounting conventions have evolved to ensure that managers use their
accounting flexibility to summarize their knowledge of the firm’s business activities
and not disguise reality for self-serving purposes. For example, the measurability and
conservatism conventions are accounting responses to concerns about distortions from
managers’ potentially optimistic bias. Both these conventions attempt to limit managers’
optimistic bias by imposing their own pessimistic bias.
Accounting standards, promulgated by the FASB in the United States and similar
standard-setting bodies in other countries, also limit potential distortions that managers
can introduce into reported numbers. These uniform standards, such as Generally
Accepted Accounting Principles (GAAP) in the United States and the International Finan-
cial Reporting Standards (IFRS) internationally, attempt to reduce managers’ ability to
record similar economic transactions in dissimilar ways, either over time or across firms.
Increased uniformity from accounting standards, however, comes at the expense of
reduced flexibility for managers to reflect genuine business differences in their firms’
financial statements. Rigid accounting standards work best for economic transactions
whose accounting treatment is not predicated on managers’ proprietary information.
However, when there is significant business judgment involved in assessing a transac-
tion’s economic consequences, rigid standards that prevent managers from using their
superior business knowledge would be counterproductive. Further, if accounting stan-
dards are too rigid, they may induce managers to expend economic resources to restruc-
ture business transactions to achieve a desired accounting result.
Feature 3: Managers’ Repor ting Strategy
Because the mechanisms that limit managers’ ability to distort accounting data add
noise, it is not optimal to use accounting regulation to eliminate managerial flexibility
completely. Therefore, real-world accounting systems leave considerable room for man-
agers to influence financial statement data. A firm’s reporting strategy, i.e., the manner in
which managers use their accounting discretion, has an important influence on the firm’s
financial statements.
Corporate managers can choose accounting and disclosure policies that make it more
or less difficult for external users of financial reports to understand the true economic
picture of their businesses. Accounting rules often provide a broad set of alternatives
from which managers can choose. Further, managers are entrusted with making a range
of estimates in implementing these accounting policies. Accounting regulations usually
prescribe minimum disclosure requirements, but they do not restrict managers from vol-
untarily providing additional disclosures.
A superior disclosure strategy will enable managers to communicate the underlying
business reality to outside investors. One important constraint on a firm’s disclosure
strategy is the competitive dynamics in product markets. Disclosure of proprietary infor-
mation about business strategies and their expected economic consequences may hurt
the firm’s competitive position. Subject to this constraint, managers can use financial
statements to provide information useful to investors in assessing their firm’s true eco-
nomic performance.
1-8
PART 1 • Framework
Copyright 2012 Cengage Learning. All Rights Reserved. May not be copied, scanned, or duplicated, in whole or in part. Due to electronic rights, some third party content may be suppressed from the eBook and/or eChapter(s).
Editorial review has deemed that any suppressed content does not materially affect the overall learning experience. Cengage Learning reserves the right to remove additional content at any time if subsequent rights restrictions require it.

Managers can also use financial reporting strategies to manipulate investors’ percep-
tions. Using the discretion granted to them, managers can make it difficult for investors
to identify poor performance on a timely basis. For example, managers can choose
accounting policies and estimates to provide an optimistic assessment of the firm’s true
performance. They can also make it costly for investors to understand the true perfor-
mance by controlling the extent of information that is disclosed voluntarily.
The extent to which financial statements reveal the underlying business reality varies
across firms and across time for a given firm. This variation in accounting quality pro-
vides both an important opportunity and a challenge in doing business analysis.
The process through which analysts can separate noise from information in financial
statements, and gain valuable business insights from financial statement analysis, is dis-
cussed in the following section.
Feature 4: Auditing
Auditing, broadly defined as a verification of the integrity of the reported financial state-
ments by someone other than the preparer, ensures that managers use accounting rules
and conventions consistently over time and that their accounting estimates are reason-
able. Therefore, auditing improves the quality of accounting data.
Third-party auditing may also reduce the quality of financial reporting because it con-
strains the kind of accounting rules and conventions that evolve over time. For example,
the FASB considers the views of auditors in the standard-setting process. Auditors are
likely to argue against accounting standards producing numbers that are difficult to
audit, even if the proposed rules produce relevant information for investors.
The legal environment in which accounting disputes between managers, auditors, and
investors are adjudicated can also have a significant effect on the quality of reported
numbers. The threat of lawsuits and resulting penalties has the beneficial effect of
improving the accuracy of disclosure. However, the potential for a significant legal liabil-
ity might also discourage managers and auditors from supporting accounting proposals
requiring risky forecasts, such as forward-looking disclosures.
The governance structure of firms includes an audit committee of the board of direc-
tors. The audit committee is expected to be independent of management, and its key
roles include overseeing the work of the auditor and ensuring that financial statements
are properly prepared. This governance mechanism further serves to enhance the quality
and accountability of financial reporting.
LEGISLATION AFFECTING FINANCIAL REPORTING AND AUDITING
In the United States, the Sarbanes-Oxley Act of 2002 made important changes in
financial reporting and auditing. The Dodd-Frank Wall Street Reform and Consumer
Protection Act of 2010 introduced new regulations for the banking sector, including
several new requirements likely to affect financial reporting and auditing.
Sarbanes-Oxley Act
In the aftermath of the collapse of the dot-com bubble and high-profile accounting scandals
such as Enron and WorldCom, the U.S. Congress passed the bipartisan Sarbanes-Oxley Act
(SOX as it has come to be known) in July 2002. The margin by which the bill was enacted—
it passed by a vote of 424 to 3 in the House of Representatives and a vote of 99 to 0 in the
Senate—and the far-reaching nature of the reforms reflected the degree to which the pub-
lic’s confidence in the quality of corporate financial reporting had been undermined.
A Framework for Business Analysis and Valuation Using Financial Statements 1-9
Copyright 2012 Cengage Learning. All Rights Reserved. May not be copied, scanned, or duplicated, in whole or in part. Due to electronic rights, some third party content may be suppressed from the eBook and/or eChapter(s).
Editorial review has deemed that any suppressed content does not materially affect the overall learning experience. Cengage Learning reserves the right to remove additional content at any time if subsequent rights restrictions require it.

SOX mandated certain fundamental changes to corporate governance as related to
financial reporting and altered the relationship between a firm and its auditor. Some of
the highlights included:
• Creation of a not-for-profit accounting oversight board, the Public Company
Accounting Oversight Board (PCAOB), to ensure standards for auditing and the
ethics and independence of public accounting firms;
• Mandating stricter guidelines for the composition and role of the audit committee
of the Board of Directors, including director independence and financial expertise;
• Enhancing corporate responsibility for financial reporting by requiring the CEO
and CFO to personally certify the appropriateness of periodic reports;
• Requiring management to assess and report on the adequacy of internal controls,
which then needs to be certified by the auditor;
• Providing greater whistleblower protection;
• Allowing for the imposition of stiffer penalties, including prison terms and fines,
for securities fraud;
• Prohibiting accounting firms from providing certain non-audit services contempo-
raneously with an audit and mandating audit partner rotation;
• Prescribing conflict of interest rules for equity research analysts; and
• Increasing the funding available to the Securities and Exchange Commission to
ensure compliance.
Since the adoption of SOX, similar legislation has been passed in Japan, the EU,
Canada, Israel, Australia, and France, among others, indicating general agreement on
the importance of tighter reporting standards.
Dodd-Frank Wall Street Reform and Consumer Protection Act of 2010
The Dodd-Frank Act was passed in 2010 in response to the financial crisis on Wall Street.
The new legislation mandated important new changes in the governance of banks, including:
• The creation of a new independent consumer protection agency to ensure that
consumers receive the information they need to shop for financial products;
• Increased monitoring of banks, including restrictions on proprietary trading;
• New procedures to facilitate the orderly liquidation of failed banks;
• Increased transparency of the trading of financial instruments, which should facili-
tate fair value accounting for these instruments;
• Increased oversight of ratings agencies;
• Provisions for shareholders to have a non-binding vote on executive compensa-
tion; and
• Increased disclosures on the assets underlying complex financial securities.
FROM FINANCIAL STATEMENTS TO BUSINESS ANALYSIS
Because managers’ insider knowledge is a source of both value and distortion in accounting
data, it is difficult for outside users of financial statements to separate information from
distortion and noise. Not being able to undo accounting distortions completely, investors
“discount” a firm’s reported accounting performance. In doing so, they make a probabilistic
assessment of the extent to which a firm’s reported numbers reflect its economic perfor-
mance. As a result, investors frequently have an imprecise assessment of an individual
firm’s performance. Financial and information intermediaries can add value by improving
investors’ understanding of a firm’s current performance and its future prospects.
1-10
PART 1 • Frame work
Copyright 2012 Cengage Learning. All Rights Reserved. May not be copied, scanned, or duplicated, in whole or in part. Due to electronic rights, some third party content may be suppressed from the eBook and/or eChapter(s).
Editorial review has deemed that any suppressed content does not materially affect the overall learning experience. Cengage Learning reserves the right to remove additional content at any time if subsequent rights restrictions require it.

Effective financial statement analysis is valuable because it attempts to get at man-
agers’ inside information from public financial statement data. Since intermediaries do
not have direct or complete access to this inside information, they rely on their knowl-
edge of the firm’s industry and its competitive strategies to interpret financial statements.
Successful intermediaries have at least as good an understanding of the industry econom-
ics as the firm’s managers do, as well as a reasonably good understanding of the firm’s
competitive strategy. Although outside analysts have an information disadvantage
relative to the firm’s managers, they are more objective in evaluating the economic con-
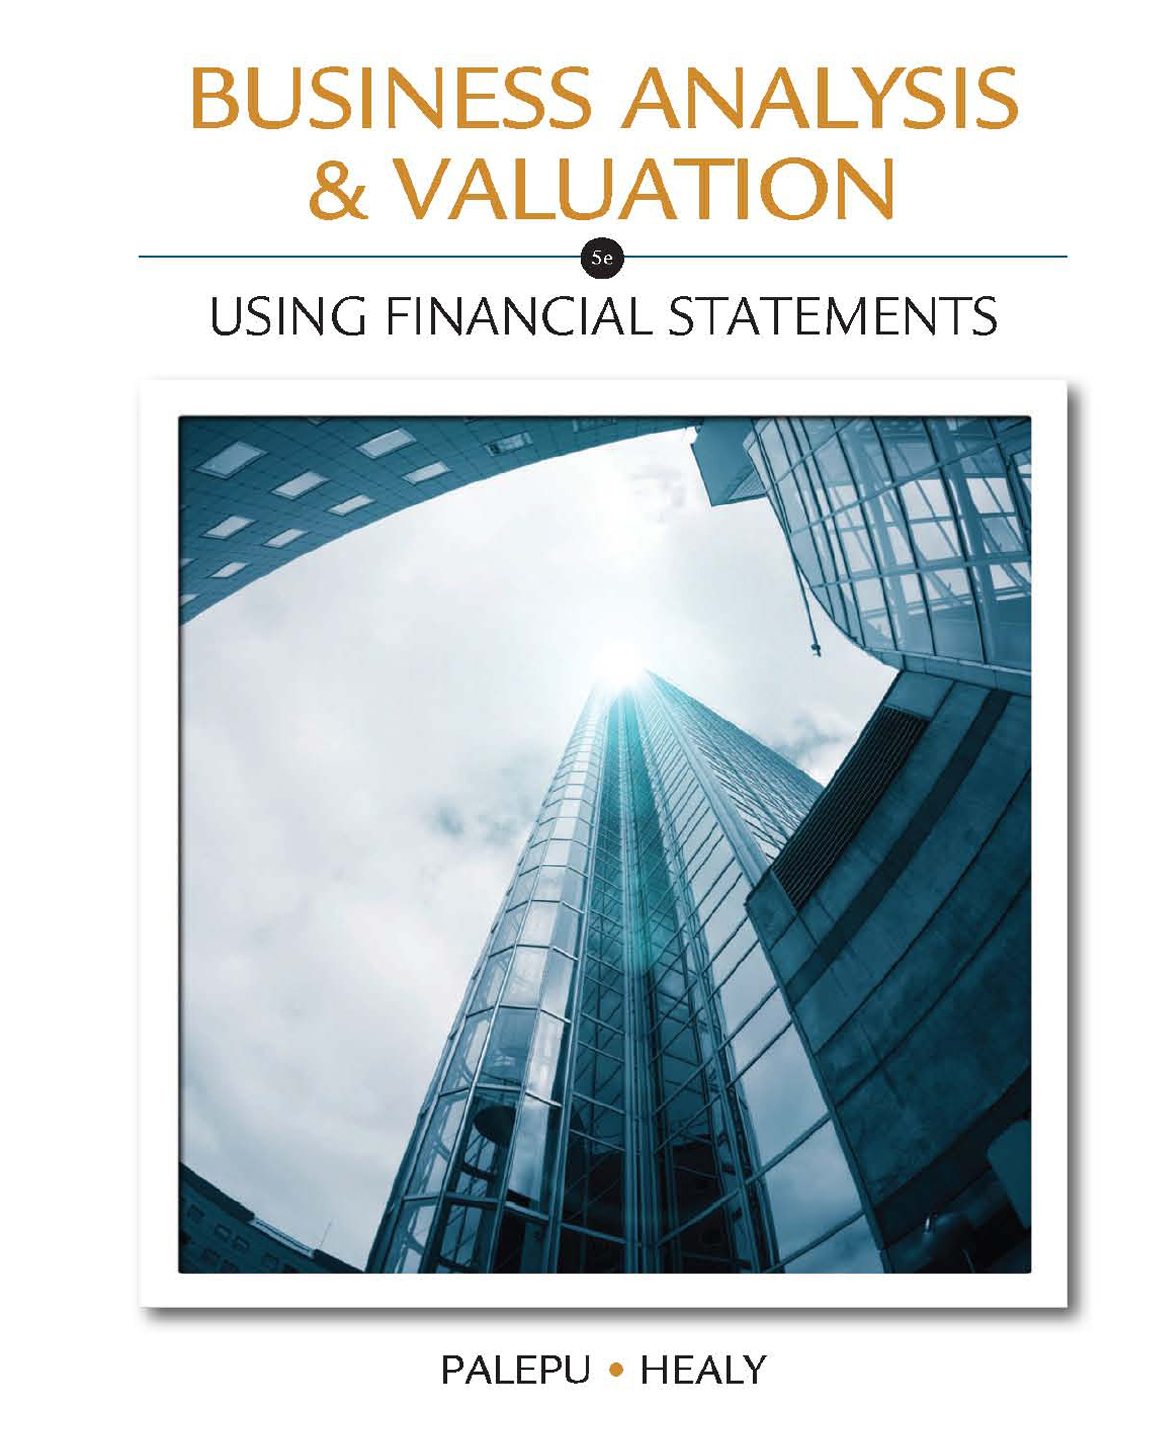
sequences of the firm’ s investment and operating decisions. Figure 1-3 provides a sche-
matic overview of how business intermediaries use financial statements to accomplish
four key steps: (1) business strategy analysis, (2) accounting analysis, (3) financial analy-
sis, and (4) prospective analysis.
Analysis Step 1: Business Strategy Analysis
The purpose of business strategy analysis is to identify key profit drivers and business
risks, and to assess the company’s profit potential at a qualitative level. Business strategy
analysis involves analyzing a firm’s industry and its strategy to create a sustainable
FIGURE 1- 3 Analysis Using Financial Statements
Financial Statements
Managers’ superior information
on business activities
Noise from estimation errors
Distortion from managers’
accounting choices
Other Public Data
Industry and rm data
Outside nancial statements
Business Strategy
Analysis
Generate performance
expectations through
industry analysis and com-
petitive strategy analysis.
Accounting Analysis
Evaluate accounting
quality by assessing
accounting policies and
estimates.
Financial Analysis
Evaluate performance
using ratios and cash
ow analysis.
Prospective Analysis
Make forecasts and
value business.
Business Application Context
Credit analysis
Securities analysis
Mergers and acquisitions analysis
Debt/Dividend analysis
Corporate communication
strategy analysis
General business analysis
ANALYSIS TOOLS
Source: © Cengage Learning
A Framework for Business Analysis and Valuation Using Financial Statements 1-11
Copyright 2012 Cengage Learning. All Rights Reserved. May not be copied, scanned, or duplicated, in whole or in part. Due to electronic rights, some third party content may be suppressed from the eBook and/or eChapter(s).
Editorial review has deemed that any suppressed content does not materially affect the overall learning experience. Cengage Learning reserves the right to remove additional content at any time if subsequent rights restrictions require it.
competitive advantage. This qualitative analysis is an essential first step because it
enables the analyst to better frame the subsequent accounting and financial analysis.
For example, identifying the key success factors and key business risks allows the identi-
fication of key accounting policies. Assessment of a firm’s competitive strategy facilitates
evaluating whether current profitability is sustainable. Finally, business analysis enables
the analyst to make sound assumptions in forecasting a firm’s future performance.
Analysis Step 2: Accounting Analysis
The purpose of accounting analysis is to evaluate the degree to which a firm’s accounting
captures its underlying business economics. By identifying places where there is account-
ing flexibility, and by evaluating the appropriateness of the firm’s accounting policies and
estimates, analysts can assess the degree of distortion in a firm’s reported numbers.
Another important step in accounting analysis is to “undo” any distortions by recasting
a firm’s accounting numbers to create unbiased accounting data. Sound accounting anal-
ysis improves the reliability of conclusions from financial analysis, the next step in finan-
cial statement analysis.
Analysis Step 3: Financial Analysis
The goal of financial analysis is to use financial data to evaluate the current and past
performance of a firm and to assess its sustainability. There are two important skills
related to financial analysis. First, the analysis should be systematic and efficient. Second,
it should allow the analyst to use financial data to explore business issues. Ratio analysis
and cash flow analysis are the two most commonly used financial tools. Ratio analysis
focuses on evaluating a firm’s product market performance and financial policies, while
cash flow analysis focuses on a firm’s liquidity and financial flexibility.
Analysis Step 4: Prospective Analysis
Prospective analysis, which focuses on forecasting a firm’s future, is the final step in
business analysis. Two commonly used techniques in prospective analysis are financial
statement forecasting and valuation. Both these tools allow the synthesis of the insights
from business analysis, accounting analysis, and financial analysis in order to make pre-
dictions about a firm’s future.
While the intrinsic value of a firm is a function of its future cash flow performance, it
is also possible to assess a firm’s value based on the firm’s current book value of equity
and its future return on equity (ROE) and growth. Strategy analysis, accounting analysis,
and financial analysis, the first three steps in the framework discussed above, provide an
excellent foundation for estimating a firm’s intrinsic value. Strategy analysis, in addition
to enabling sound accounting and financial analysis, also helps in assessing potential
changes in a firm’s competitive advantage and their implications for the firm ’s future
ROE and growth. Accounting analysis provides an unbiased estimate of a firm’s current
book value and ROE. Financial analysis allows an in-depth understanding of what drives
the firm’s current ROE.
The predictions from a sound business analysis are useful to a variety of parties and
can be applied in various contexts. The exact nature of the analysis will depend on the
context. The contexts that we will examine include securities analysis, credit evaluation,
mergers and acquisitions, and the assessment of corporate communication strategies.
The four analytical steps described above are useful in each of these contexts. Appropri-
ate use of these tools, however, requires a familiarity with the economic theories and
institutional factors relevant to the context.
1-12
PART 1 • Frame work
Copyright 2012 Cengage Learning. All Rights Reserved. May not be copied, scanned, or duplicated, in whole or in part. Due to electronic rights, some third party content may be suppressed from the eBook and/or eChapter(s).
Editorial review has deemed that any suppressed content does not materially affect the overall learning experience. Cengage Learning reserves the right to remove additional content at any time if subsequent rights restrictions require it.

There are several ways in which financial statement analysis can add value, even when
capital markets are reasonably efficient. First, there are many applications of financial
statement analysis whose focus is outside the capital market context—credit analysis,
competitive benchmarking, and analysis of mergers and acquisitions, to name a few.
Second, markets become efficient precisely because some market participants rely on
analytical tools such as the ones we discuss in this book to analyze information and
make investment decisions. This in turn imposes greater discipline on corporate man-
agers to develop an appropriate disclosure and communication strategy.
SUMMARY
Financial statements provide the most widely available data on public corporations’ eco-
nomic activities; investors and other stakeholders rely on them to assess the plans and
performance of firms and corporate managers. Accrual accounting data in financial
statements are noisy, and unsophisticated investors can assess firms’ performance only
imprecisely. Financial analysts who understand managers’ disclosure strategies have an
opportunity to create inside information from public data, and they play a valuable role
in enabling outside parties to evaluate a firm’s current and prospective performance.
This chapter has outlined the framework for business analysis with financial statements,
using four key steps: business strategy analysis, accounting analysis, financial analysis, and
prospective analysis. The remaining chapters in this book describe these steps in greater
detail and discuss how they can be used in a variety of business contexts.
DISCUSSION QUESTIONS
1. John, who has just completed his first finance course, is unsure whether he should
take a course in business analysis and valuation using financial statements since he
believes that financial analysis adds little value, given the efficiency of capital mar-
kets. Explain to John when financial analysis can add value, even if capital markets
are generally seen as being efficient.
2. In 2009, Larry Summers, former Secretary of the Treasury, observed that “in the past
20-year period, we have seen the 1987 stock market crash. We have seen the Savings
& Loan debacle and commercial real estate collapse of the late 80’s and early 90’s. We
have seen the Mexican financial crisis, the Asian financial crisis, the Long Term Capi-
tal Management liquidity crisis, the bursting of the NASDAQ bubble and the associ-
ated Enron threat to corporate governance. And now we’ve seen this [global economic
crisis], which is more serious than any of that. Twenty years, seven major crises. One
major crisis every three years.” How could this happen given the large number of
financial and information intermediaries working in financial markets throughout
the world? Can crises be averted by more effective financial analysis?
3. Accounting statements rarely report financial performance without error. List three
types of errors that can arise in financial reporting.
4. Joe Smith argues that “learning how to do business analysis and valuation using
financial statements is not very useful, unless you are interested in becoming a
financial analyst.” Comment.
5. Four steps for business analysis are discussed in the chapter (strategy analysis,
accounting analysis, financial analysis, and prospective analysis). As a financial ana-
lyst, explain why each of these steps is a critical part of your job and how they relate
to one another.
A Framework for Business Analysis and Valuation Using Financial Statements 1-13
Copyright 2012 Cengage Learning. All Rights Reserved. May not be copied, scanned, or duplicated, in whole or in part. Due to electronic rights, some third party content may be suppressed from the eBook and/or eChapter(s).
Editorial review has deemed that any suppressed content does not materially affect the overall learning experience. Cengage Learning reserves the right to remove additional content at any time if subsequent rights restrictions require it.

NOTES
1. See G. Akerlof, “The Market for ‘Lemons’ : Quality Uncertainty and the Market
Mechanism,” Quarterly Journal of Economics (August 1970): 488–500. Akerlof rec-
ognized that the seller of a used car knew more about the car’s value than the
buyer. This meant that the buyer was likely to end up overpaying, since the seller
would accept any offer that exceeded the car’s true value and reject any lower
offer. Car buyers recognized this problem and would respond by only making low-
ball offers for used cars, leading sellers with high-quality cars to exit the market. As
a result, only the lowest quality cars (the “lemons”) would remain in the market.
Akerlof pointed out that qualified independent mechanics could correct this market
breakdown by providing buyers with reliable information on a used car’s true value.
2. T. Khanna and K. Palepu, Winning in Emerging Markets: A Road Map for Strategy
and Execution (Boston, MA: Harvard Business Press, 2010), 54–58.
3. See P. Healy and K. Palepu, “How the Quest for Efficiency Corroded the Market,”
Harvard Business Review (July 2003): 76–85.
1-14
PART 1 • Frame work
Copyright 2012 Cengage Learning. All Rights Reserved. May not be copied, scanned, or duplicated, in whole or in part. Due to electronic rights, some third party content may be suppressed from the eBook and/or eChapter(s).
Editorial review has deemed that any suppressed content does not materially affect the overall learning experience. Cengage Learning reserves the right to remove additional content at any time if subsequent rights restrictions require it.

PART
2
BUSINESS ANALYSIS AND
VALUATION TOOLS
CHAPTER 2
Strategy Analysis
CHAPTER 3
Overview of Accounting Analysis
CHAPTER 4
Implementing Accounting Analysis
CHAPTER 5
Financial Analysis
CHAPTER 6
Prospective Analysis: Forecasting
CHAPTER 7
Prospective Analysis: Valuation Theory and Concepts
CHAPTER 8
Prospective Analysis: Valuation Implementation
Copyright 2012 Cengage Learning. All Rights Reserved. May not be copied, scanned, or duplicated, in whole or in part. Due to electronic rights, some third party content may be suppressed from the eBook and/or eChapter(s).
Editorial review has deemed that any suppressed content does not materially affect the overall learning experience. Cengage Learning reserves the right to remove additional content at any time if subsequent rights restrictions require it.

Chapter
2
STRATEGY ANALYSIS
S
trategy analysis is an important starting point for the analysis of financial
statements. Strategy analysis allows the analyst to probe the economics of a firm
at a qualitative level so that the subsequent accounting and financial analysis is
grounded in business reality. Strategy analysis also allows the identification of the firm’s
profit drivers and key risks. This in turn enables the analyst to assess the sustainability of
the firm’s current performance and make realistic forecasts of future performance.
A firm’s value is determined by its ability to earn a return on its capital in excess of
the cost of capital. What determines whether or not a firm is able to accomplish this
goal? While a firm’s cost of capital is determined by the capital markets, its profit
potential is determined by its own strategic choices: (1) the choice of an industry or a
set of industries in which the firm operates (industry choice), (2) the manner in which
the firm intends to compete with other firms in its chosen industry or industries
(competitive positioning), and (3) the way in which the firm expects to create and
exploit synergies across the range of businesses in which it operates (corporate
strategy). Strategy analysis, therefore, involves industry analysis, competitive strategy
analysis, and corporate strategy analysis.
1
In this chapter, we will briefly discuss these
three steps and use the U.S. retail department store industry, Nordstrom Inc., and the
Tata Group, respectively, to illustrate the application of the steps.
INDUSTRY ANALYSIS
In analyzing a firm’s profit potential, an analyst has to first assess the profit potential of
each of the industries in which the firm is competing. While specific industry profitabil-
ity can change over time as the industry evolves, in general the profitability across indus-
tries has tended to differ systematically. For example, an analysis of financial results of all
U.S.-based companies between 1991 and 2009 shows a ratio of earnings before interest
and taxes to the book value of assets of 4.9 percent. However, the average returns varied
widely across specific industries: for example, the passenger airline industry group (SIC
code 4512), which has struggled with intense competition and low profitability since
deregulation in the late 1970s, has seen a 1.8 percent return over the study period. In
contrast, the pharmaceutical preparations industry group (SIC code 2834) returned
14.6 percent on average over the period.
2
These are illustrative— there are even more
extreme examples. What causes these profitability differences?
There is a vast body of research in industrial organization on the influence of industry
structure on profitability.
3
Relying on this research, strategy literature suggests that the
2-3
Copyright 2012 Cengage Learning. All Rights Reserved. May not be copied, scanned, or duplicated, in whole or in part. Due to electronic rights, some third party content may be suppressed from the eBook and/or eChapter(s).
Editorial review has deemed that any suppressed content does not materially affect the overall learning experience. Cengage Learning reserves the right to remove additional content at any time if subsequent rights restrictions require it.

average profitability of an industry is influenced by the “five forces” shown in
Figure 2-1.
4
According to this framework, the intensity of competition determines the
potential for creating abnormal profits by the firms in an industry. Whether or not
the potential profits are kept by the industry is determined by the relative bargaining
power of the firms in the industry and their customers and suppliers. We will discuss
each of these industry profit drivers in more detail below.
Degree of Actual and Potential Competition
At the most basic level, the profits in an industry are a function of the maximum price
that customers are willing to pay for the industry’s product or service. One of the key
determinants of the price is the degree to which there is competition among suppliers
of the same or similar products. At one extreme, if there is a state of perfect competition
in the industry, micro-economic theory predicts that prices will be equal to marginal
cost, and there will be few opportunities to earn supernormal profits. At the other
extreme, if the industry is dominated by a single firm, there will be potential to earn
FIGURE 2-1 Industry Structure and Profitability
Rivalry Among
Existing Firms
Industry growth
Concentration
Differentiation
Switching costs
Scale / Learning
economies
Fixed-Variable costs
Excess capacity
Exit barriers
Threat of
New Entrants
Scale economies
First mover advantage
Distribution access
Relationships
Legal barriers
Threat of
Substitute Products
Relative price and
performance
Buyers’ willingness to
switch
INDUSTRY
PROFITABILITY
Bargaining Power
of Buyers
Switching costs
Differentiation
Importance of product for
costs and quality
Number of buyers
Volume per buyer
Bargaining Power
of Suppliers
Switching costs
Differentiation
Importance of product for
costs and quality
Number of suppliers
Volume per supplier
BARGAINING POWER IN INPUT AND OUTPUT MARKETS
DEGREE OF ACTUAL AND POTENTIAL COMPETITION
Source: © Cengage Learning
2-4 PART 2 • Business Analysis and Valuation Tools
Copyright 2012 Cengage Learning. All Rights Reserved. May not be copied, scanned, or duplicated, in whole or in part. Due to electronic rights, some third party content may be suppressed from the eBook and/or eChapter(s).
Editorial review has deemed that any suppressed content does not materially affect the overall learning experience. Cengage Learning reserves the right to remove additional content at any time if subsequent rights restrictions require it.
monopoly profits. In reality, the degree of competition in most industries is somewhere
in between perfect competition and monopoly.
There are three potential sources of competition in an industry: (1) rivalry between
existing firms, (2) threat of entry of new firms, and (3) threat of substitute products or
services. We discuss each of these competitive forces in the following paragraphs.
Competitive Force 1: Rivalry among Existing Firms
In most industries the average level of profitability is primarily influenced by the nature of
rivalry among existing firms in the industry. In some industries firms compete aggres-
sively, pushing prices close to (and sometimes below) the marginal cost. In other industries
firms do not compete aggressively on price. Instead, they find ways to coordinate their
pricing, or compete on non-price dimensions such as innovation or brand image. Several
factors determine the intensity of competition among existing players in an industry:
Industry Growth Rate If an industry is growing very rapidly, incumbent firms need not
grab market share from each other to grow. In contrast, in stagnant industries the only
way existing firms can grow is by taking share away from the other players. In this situ-
ation one can expect price wars among firms in the industry.
Concentration and Balance of Competitors The number of firms in an industry and
their relative sizes determine the degree of concentration in an industry.
5
The degree of
concentration influences the extent to which firms in an industry can coordinate their
pricing and other competitive moves. For example, if there is one dominant firm in an
industry (such as Microsoft or Intel in the 1990s), it can set and enforce the rules of com-
petition. Similarly, if there are only two or three similarly sized players (such as Coca-Cola
and Pepsi in the U.S. soft drink industry), they can implicitly cooperate with each other to
avoid destructive price competition. If an industry is fragmented, price competition is
likely to be severe, as can be seen in the hotel/motel and construction industries.
Degree of Differentiation and S witching Costs The extent to which firms in an industry
can avoid head-on competition depends on the extent to which they can differentiate
their products and services. If the products in an industry are very similar, customers
are ready to switch from one competitor to another purely on the basis of price. Switch-
ing costs also determine customers’ propensity to move from one product to another.
When switching costs are low, there is a greater incentive for firms in an industry to
engage in price competition. The PC industry, where the standardization of the software
and microprocessor has led to relatively low switching costs, is extremely price
competitive.
Scale/Learning Economies and the Ratio of Fixed to Variable Costs If there is a steep
learning curve or there are other types of scale economies in an industry, size becomes
an important factor for firms in the industry. In such situations, there are incentives to
engage in aggressive competition for market share. Similarly, if the ratio of fixed to vari-
able costs is high, firms have an incentive to reduce prices to utilize installed capacity.
The airline industry, where price wars are quite common, is an example of this type of
situation.
Exces s Capacity and Exit Barriers If capacity in an industry is larger than customer
demand, there is a strong incentive for firms to cut prices to fill capacity. The problem
of excess capacity is likely to be exacerbated if there are significant barriers for firms to
exit the industry. Exit barriers are high when the assets are specialized or if there are
regulations which make exit costly. The competitive dynamics of the global automotive
industry demonstrates these forces at play.
Strategy Analysis 2-5
Copyright 2012 Cengage Learning. All Rights Reserved. May not be copied, scanned, or duplicated, in whole or in part. Due to electronic rights, some third party content may be suppressed from the eBook and/or eChapter(s).
Editorial review has deemed that any suppressed content does not materially affect the overall learning experience. Cengage Learning reserves the right to remove additional content at any time if subsequent rights restrictions require it.
Competitive Force 2: Threat of New Entrants
The potential for earning abnormal profits will attract new entrants to an industry. The
very threat of new firms entering an industry potentially constrains the pricing of exist-
ing firms within it. Therefore, the ease with which a new firm can enter an industry is a
key determinant of its profitability. Several factors determine the height of barriers to
entry in an industry:
Economies of Scale When there are large economies of scale, new entrants face the
choice of having either to invest in large capacity which might not be utilized right
away, or to enter with less than the optimum capacity. Either way, new entrants will at
least initially suffer from a cost disadvantage in competing with existing firms. Econo-
mies of scale might arise from large investments in research and development (the phar-
maceutical or jet engine industries), in brand advertising (soft drink industry), or in
physical plant and equipment (telecommunications industry).
First Mover Advantage Early entrants in an industry may deter future entrants if there
are first mover advantages. For example, first movers might be able to set industry stan-
dards or enter into exclusive arrangements with suppliers of cheap raw materials. They
may also acquire scarce government licenses to operate in regulated industries. Finally, if
there are learning economies, early firms will have an absolute cost advantage over new
entrants. First mover advantages are also likely to be large when there are significant
switching costs for customers once they start using existing products. For example,
switching costs faced by the users of Microsoft’s Windows operating system make it dif-
ficult for software companies to market a new operating system.
Access to Channels of Distribution and Relationships Limited capacity in the existing
distribution channels and high costs of developing new channels can act as powerful bar-
riers to entry. For example, a new entrant into the domestic auto industry in the United
States is likely to face formidable barriers because of the difficulty of developing a dealer
network. Tesla Motors, the California-based electric automobile manufacturer that has
gained a lot of positive press for its sporty electric roadster, called out this risk in its 2010
pre-IPO S1 filing with the SEC.
6
In addition, its 2010 strategic partnership with Toyota
has been seen by many as a way to leap this barrier by gaining access to Toyota’s exten-
sive dealer network. Existing relationships between firms and customers in an industry
are another barrier that can make it difficult for new firms to enter an industry. Exam-
ples of industries where this is a factor include auditing and investment banking.
Legal Barriers There are many industries in which legal barriers such as patents and
copyrights in research-intensive industries limit entry. Similarly, licensing regulations
limit entry into taxi services, medical services, broadcasting, and telecommunications
industries.
Competitive Force 3: Threat of Substitute Product s
The third dimension of competition in an industry is the threat of substitute products or
services. Relevant substitutes are not necessarily those that have the same form as the
existing products but those that perform the same function. For example, airlines and
car rental services might be substitutes for each other when it comes to travel over
medium distances. Similarly, plastic bottles and metal cans substitute for each other as
packaging in the beverage industry. In some cases, threat of substitution comes not
from customers’ switching to another product but from utilizing technologies that allow
them to do without, or use less of, the existing products. For example, energy-conserving
technologies allow customers to reduce their consumption of electricity and fossil fuels.
2-6
PART 2 • Business Analysis and Valuation Tools
Copyright 2012 Cengage Learning. All Rights Reserved. May not be copied, scanned, or duplicated, in whole or in part. Due to electronic rights, some third party content may be suppressed from the eBook and/or eChapter(s).
Editorial review has deemed that any suppressed content does not materially affect the overall learning experience. Cengage Learning reserves the right to remove additional content at any time if subsequent rights restrictions require it.
The threat of substitutes depends on the relative price and performance of the com-
peting products or services and on customers’ willingness to substitute. Customers’ per-
ception of whether two products are substitutes depends to some extent on whether they
perform the same function for a similar price. If two products perform an identical func-
tion, then it would be difficult for them to differ from each other in price. However, cus-
tomers’ willingness to switch is often the critical factor in making this competitive
dynamic work. For example, even when tap water and bottled water serve the same func-
tion, many customers may be unwilling to substitute the former for the latter, enabling
bottlers to charge a price premium. Similarly, designer label clothing commands a price
premium even if it is not superior in terms of basic functionality because customers place
a value on the image or style offered by designer labels.
Bargaining Power in Input and Output Markets
While the degree of competition in an industry determines whether there is potential to
earn abnormal profits, the actual profits are influenced by the industry ’s bargaining
power with its suppliers and customers. On the input side, firms enter into transactions
with suppliers of labor, raw materials and components, and finances. On the output side,
firms either sell directly to the final customers or enter into contracts with intermediaries
in the distribution chain. In all these transactions, the relative economic power of the
two sides is important to the overall profitability of the industry firms.
Competitive Force 4: Bargaining Power of Buyers
Two factors determine the power of buyers: price sensitivity and relative bargaining
power. Price sensitivity determines the extent to which buyers care to bargain on price;
relative bargaining power determines the extent to which they will succeed in forcing the
price down.
7
Price Sensitivity Buyers are more price sensitive when the product is undifferentiated
and there are few switching costs. For example, Windows-based personal computers are
seen by customers as close substitutes of each other, and hence purchasing decisions
among different brands of PCs is heavily influenced by price. The sensitivity of buyers
to price also depends on the importance of the product to their own cost structure.
When the product represents a large fraction of the buyers’ cost (for example, the pack-
aging material for soft drink producers), the buyer is likely to expend the resources nec-
essary to shop for a lower cost alternative. In contrast, if the product is a small fraction
of the buyers’ cost (for example, windshield wipers for automobile manufacturers), it
may not pay to expend resources to search for lower-cost alternatives. Further, the
importance of the product to the buyers’ own product quality also determines whether
or not price becomes the most important determinant of the buying decision. The explo-
sion in compensation paid to marquee sports figures can be seen as an example of this
type of phenomenon because these players are viewed by teams as critical to their fan
appeal and success as a franchise.
Relative Bargaining Power Even if buyers are price sensitive, they may not be able to
achieve low prices unless they have a strong bargaining position. Relative bargaining
power in a transaction depends, ultimately, on the cost to each party of not doing busi-
ness with the other party. The buyers’ bargaining power is determined by the number of
buyers relative to the number of suppliers, volume of purchases by a single buyer, num-
ber of alternative products available to the buyer, buyers’ costs of switching from one
product to another, and the threat of backward integration by the buyers. For example,
in the automobile industry, car manufacturers have considerable power over component
Strategy Analysis 2-7
Copyright 2012 Cengage Learning. All Rights Reserved. May not be copied, scanned, or duplicated, in whole or in part. Due to electronic rights, some third party content may be suppressed from the eBook and/or eChapter(s).
Editorial review has deemed that any suppressed content does not materially affect the overall learning experience. Cengage Learning reserves the right to remove additional content at any time if subsequent rights restrictions require it.
manufacturers because auto companies are large buyers with several alternative suppliers
to choose from, and switching costs are relatively low. In contrast, in the personal com-
puter industry, computer makers have low bargaining power relative to the operating
system software producers because of high switching costs.
Competitive Force 5: Bargaining Power of Suppliers
The analysis of the relative power of suppliers is a mirror image of the analysis of the
buyer’s power in an industry. Suppliers are powerful when there are only a few compa-
nies and few substitutes available to their customers. For example, in the soft drink
industry, Coke and Pepsi are very powerful relative to the bottlers. In contrast, metal
can suppliers to the soft drink industry are not very powerful because of intense compe-
tition among can producers and the threat of substitution by plastic bottles. Suppliers
also have a great deal of power over buyers when the suppliers’ product or service is
critical to buyers’ business. Microsoft’s power in the personal computer industry is a
good example of this. Suppliers also tend to be powerful when they pose a credible threat
of forward integration. For example, IBM is powerful relative to mainframe computer
leasing companies because of its unique position as a mainframe supplier and its own
presence in the computer leasing business.
APPLYING INDUSTRY ANALYSIS: THE U.S. RETAIL
DEPARTMENT STORE INDUSTRY
Let us consider the above concepts of industry analysis in the context of the U.S. retail
department store industry. The growth of cities and mass production techniques spurred
the emergence of retail clothing stores in the late 1800s. The rapid expansion of the mar-
ket in the twentieth century fostered the development of regional and national chains
that gave the industry its concentrated profile we see today. While the major players
originally located in stand-alone flagship locations in urban centers, the population
migration out of cities and the rise of the suburban shopping mall in the mid-twentieth
century resulted in these players positioning themselves as “anchor stores”—large depart-
ment stores selling a wide range of apparel, accessories, and other related goods that
“anchored” the broader shopping mall and its selection of smaller specialty stores.
Broadly stated, the industry can be segmented into high-end, middle market, and dis-
count department stores. Table 2-1 shows profitability of select competitors in these
three segments. The overall department store industry has historically earned higher
than average returns when compared to all U.S. industries (analysis described above),
with the high-end and discount segments outperforming the middle market. What has
accounted for this above average industry return? Looking forward, what is the depart-
ment store industry’s future profit potential?
Competition in the U.S. Ret ail Department Store Industry
Industry analysis can help to explain the above average profitability seen in the depart-
ment store industry. Key elements of industry structure:
• The industry is concentrated, with the four largest players accounting for over
75 percent of the industry revenue in 2009.
8
• Consumer demand grew along with the growth in U.S. affluence for most of the
twentieth and early twenty-first century. This has meant that department stores
have typically experienced growth without having to resort to high levels of price
competition in an effort to steal market share from competitors.
2-8
PART 2 • Business Analysis and Valuation Tools
Copyright 2012 Cengage Learning. All Rights Reserved. May not be copied, scanned, or duplicated, in whole or in part. Due to electronic rights, some third party content may be suppressed from the eBook and/or eChapter(s).
Editorial review has deemed that any suppressed content does not materially affect the overall learning experience. Cengage Learning reserves the right to remove additional content at any time if subsequent rights restrictions require it.

• Competitors such as Nordstrom, Saks Fifth Avenue, and Neiman Marcus have suc-
cessfully differentiated themselves on non-price parameters such as superior cus-
tomer service, a differentiated product offering through the use of private label
lines and exclusive designer relationships, loyalty programs, and an upscale shop-
ping experience—all of which are designed to build customer loyalty and thus
increase switching costs.
• There are significant economies of scale available to larger competitors, who have
more power to obtain lower prices from their suppliers, to invest in sophisticated
IT infrastructure to better understand customer needs and manage inventory, and
to conduct national advertising campaigns. These economies of scale have been
critical to the success of competitors pursuing a cost-leadership strategy
(Wal-Mart, Target, TJX), who have been ruthless in streamlining their operations,
reducing their cost from suppliers, and otherwise driving down their cost to bring
product to market.
• Established competitors have strong brand recognition earned through years of
effort, while a new competitor is faced with the need to expend large amounts
of capital in order to gain this brand equity. This first mover advantage holds
true not only in traditional physical stores but also in the realm of the Internet
where consumers, lacking the ability to measure the quality of a store or product
TABLE 2 -1 Retail Department store pre-tax profitability—select
competitors 1991–2009
Company EBIT/Net Assets
....................................................................................................................................................
Neiman-Marcus Group, Inc.
a
11.8%
Saks Inc / Saks Holdings, Inc. 5.2%
Nordstrom Inc.
13.8%
High-end segment average 10.3%
Sears Roebuck & Co / Sears Holding
Group
b
6.3%
Dillards Inc. 6.4%
R H Macy & Co / Macy’s Inc.
c
7.0%
J C Penney Co.
7.9%
Middle market segment average 6.8%
Wal-Mart Stores, Inc. 12.4%
Target Corp 11.3%
TJX Companies Inc.
22.1%
Discount segment average 12.5%
Average of all retail department store
segments
9.9%
d
Average of all U.S. companies 4.9%
....................................................................................................................................................
Source: Financial statement data for noted companies, industry, and all publicly traded U.S.-based companies
from 1991–2009, listed in Research Insight. Analysis completed November, 2011.
a
Neiman-Marcus was taken private in 2006—results shown are through 2005.
b
Includes Kmart beginning 2005 when the companies merged to form Sears Holding Group.
c
Includes Bloomingdales, other brands, which make up about 10 percent of total revenues.
d
Average of SIC codes 5311, 5331, and 5651 data 1991–2009. The representative group of competitors
shown above mirrors the overall results of the department store industry with a return of 10.0 percent over
the period.
Strategy Analysis 2-9
Copyright 2012 Cengage Learning. All Rights Reserved. May not be copied, scanned, or duplicated, in whole or in part. Due to electronic rights, some third party content may be suppressed from the eBook and/or eChapter(s).
Editorial review has deemed that any suppressed content does not materially affect the overall learning experience. Cengage Learning reserves the right to remove additional content at any time if subsequent rights restrictions require it.
by experiencing it firsthand, have tended to gravitate to established, “trusted” name
brands.
• A new competitor in the industry would typically face a distribution constraint
when seeking a prime retail location as established competitors have better access
to prime retail locations and favorable terms since they are viewed as valuable
“anchor” tenants that can ensure success of an entire development. With the
increased use of the online channel, this barrier has been eased somewhat as a
competitive factor in the industry.
• The rise of the online shopping channel as represented by online-only competitors
such as Amazon.com has resulted in a large and growing threat of substitution for
the traditional “bricks and mortar” stores. Competitors such as Nordstrom have
aggressively developed their own online presence in an attempt to reduce this
threat, while at the same time working to integrate their online and physical chan-
nels in order to leverage their physical presence to their advantage.
The Power of Buyers and Suppliers
Suppliers and buyers have limited power over firms in the industry for these reasons:
• Generally, buyers tend to have relatively low bargaining power with department
stores—there is little or no “haggling” over price. Given the relative number of
individual buyers to providers (high), buyers mainly are able to exert their ability
to switch providers rather than to exert any relative strength in bargaining power.
• Suppliers to department stores also have low relative power due to their small size
as compared to their clients. The expansion of the private label lines has also estab-
lished a credible alternative to the designer lines, further reducing supplier power.
Competitors in all segments of the department store industry have focused on
building their power over suppliers. As an example, TJX added approximately
2,000 new suppliers in 2010 bringing their total global count to over 14,000.
9
Also, Nordstrom has no guaranteed supply arrangements with its vendors,
10
which allows it to maintain flexibility to adjust their products to meet current
demand.
In recent years, industry dynamics have been shifting. First, growth in consumer
demand slowed significantly during the recent global economic crisis, and there is spec-
ulation that it may not return to pre-crisis levels at least in the short term.
11
Also, the
emergence of the Internet channel has begun to change consumer shopping behavior
both online and off. The availability of price and product information has increased sub-
stitution as the consumer is able to make more informed buying decisions. The ease of
shopping across multiple online outlets has reduced switching costs, and perhaps has
served to reduce the value of the broad product offering of the retail department store
model. In a similar offline shift, the rise of “lifestyle centers,” which emphasize smaller
specialty retailers clustered in an attractive center, has de-emphasized the role of the
anchor store. In general, the trend toward specialization would seem to be against the
department store model.
12
While it is not clear what additional structural changes will take place in the industry,
what is clear is that the competitors who adapt will be the ones to survive and thrive.
Nordstrom’s aggressive push to expand its online presence, TJX working to expand its
global supplier base while pursuing a specialized offering strategy (Home Goods,
Marshalls / TJ Maxx), and Wal-Mart’s push into China and other high growth potential
emerging markets are examples of actions competitors are taking to adapt to the chang-
ing dynamics of the marketplace.
2-10
PART 2 • Business Analysis and Valuation Tools
Copyright 2012 Cengage Learning. All Rights Reserved. May not be copied, scanned, or duplicated, in whole or in part. Due to electronic rights, some third party content may be suppressed from the eBook and/or eChapter(s).
Editorial review has deemed that any suppressed content does not materially affect the overall learning experience. Cengage Learning reserves the right to remove additional content at any time if subsequent rights restrictions require it.

Limitations of Industry Analysis
A potential limitation of the industry analysis framework discussed in this chapter is the
assumption that industries have clear boundaries. In reality, it is often not easy to demarcate
industry boundaries. For example, in analyzin g Nordstrom’s industry, should one limit the
analysis to large department store competitors, or also include smaller specialty retailers which
compete with Nordstrom for market share? With the rise of the discount and off-price retailers,
should one include Wal-Mart and TJX? Where do onlineretailerssuchasAmazon.comfit?
Inappropriate industry definition will result in incomplete analysis and inaccurate forecasts,
and thus it is important to correctly scope the industry segment to be considered.
COMPETITIVE STRAT EGY ANALYSIS
The profitability of a firm is influenced not only by its industry structure but also by the
strategic choices it makes in positioning itself in the industry. While there are many ways
to characterize a firm’s business strategy, research has traditionally identified two generic
competitive strategies, (1) cost leadership and (2) differentiation, that can potentially
allow a firm to build a sustainable competitive advantage.
13
These strategies (shown in
Figure 2-2) have broadly been seen as mutually exclusive—firms that straddle the two
strategies are said to be “stuck in the middle” and expected to earn low profitability
(the middle market department store competitors described in the last section are a
good example of this).
14
These firms, the thinking goes, run the risk of not being able
to attract price-conscious customers because their costs are too high; they are also unable
to provide adequate differentiation to attract premium price customers.
FIGURE 2-2 Strategies for Creating Competitive Advantage
Cost Leadership
Supply same product or service
at a lower cost.
Economies of scale and scope
Efcient production
Simpler product designs
Lower input costs
Low-cost distribution
Little research and development or
brand advertising
Tight cost control system
Differentiation
Supply a unique product or
service at a cost lower than the
price premium customers will
pay.
Superior product quality
Superior product variety
Superior customer service
More exible delivery
Investment in brand image
Investment in research and
development
Control system focus on creativity
and innovation
Competitive Advantage
• Match between rm’s core competencies and key success
factors to execute strategy
• Match between rm’s value chain and activities required to
execute strategy
• Sustainability of competitive advantage
Source: © Cengage Learning
Strategy Analysis 2-11
Copyright 2012 Cengage Learning. All Rights Reserved. May not be copied, scanned, or duplicated, in whole or in part. Due to electronic rights, some third party content may be suppressed from the eBook and/or eChapter(s).
Editorial review has deemed that any suppressed content does not materially affect the overall learning experience. Cengage Learning reserves the right to remove additional content at any time if subsequent rights restrictions require it.
Additional research has attempted to explain the apparent exc eption of certain
competitors, for instance, the Japanese automotive industry, which for many years offered
both higher quality and lower cost than its competitors in t he United States and Europe.
Generally, though, this ability to compete successfully from the “middle” has been
attributed to a focus on operational effectiveness—not strategy—that has allowed them to
continuously push the “productivity frontier” ahead of their competitors. This advantage
is only expected to be sustainable if it could not eventually be duplicated allowing
competitors to “catch up. ”
15
Sources of Competitive Advantage
Cost leadership enables a firm to supply the same product or service offered by its com-
petitors at a lower cost. Differentiation strategy involves providing a product or service
that is distinct in some important respect valued by the customer. We will illustrate both
of these strategies using two companies in the U.S. retail department store industry. TJX
Companies, Inc. (parent to stores such as T.J. Maxx and Marshalls) has been highly suc-
cessful competing purely on a low-cost basis. Nordstrom, in contrast, has succeeded on
the basis of differentiation by emphasizing exceptionally high customer service and
broad, differentiated merchandise selection.
Competitive Strategy 1: Cost Leadership
Cost leadership is often the clearest way to achieve competitive advantage. In indus-
tries where the basic product or service is a commodity, cost leadership might be the
only way to achieve superior performance. There are many ways to achieve cost lead-
ership, including economies of scale and scope, economies of learning, efficient pro-
duction, simpler product design, better sourcing and lower input costs, and efficient
organizational processes. If a firm can achieve cost leadership, then it will be able to
earn above-average profitability by merely charging the same price as its rivals. Con-
versely, a cost leader can force its competitors to cut prices and accept lower returns
or to exit the industry.
Firms that achieve cost leadership focus on tight cost controls. They make invest-
ments in efficient scale plants, focus on product designs that reduce manufacturing
costs, minimize overhead costs, capitalize on global sourcing opportunities, make little
investment in risky research and development, and avoid serving marginal customers.
They have organizational structures and control systems that focus on cost control.
Competitive Strategy 2: Differentiation
A firm following the differentiation strategy seeks to be unique in its industry along
some dimension that is highly valued by customers. For differentiation to be successful,
the firm has to accomplish three things. First, it needs to identify one or more attributes
of a product or service that customers value. Second, it has to position itself to meet the
chosen customer need in a unique manner. Finally, the firm has to achieve differentia-
tion at a cost that is lower than the price the customer is willing to pay for the differen-
tiated product or service.
Drivers of differentiation include providing superior intrinsic value via product
quality, product variety, bundled services, or delivery timing. Differentiation can also
be achieved by investing in signals of value such as brand image, product appearance,
or reputation. Differentiated strategies require investments in research and develop-
ment, engineering skills, and marketing capabilities. The organizational structures and
control systems in firms with differentiation strategies need to foster creativity and
innovation.
2-12
PART 2 • Business Analysis and Valuation Tools
Copyright 2012 Cengage Learning. All Rights Reserved. May not be copied, scanned, or duplicated, in whole or in part. Due to electronic rights, some third party content may be suppressed from the eBook and/or eChapter(s).
Editorial review has deemed that any suppressed content does not materially affect the overall learning experience. Cengage Learning reserves the right to remove additional content at any time if subsequent rights restrictions require it.
While successful firms choose between cost leadership and differentiation, they can-
not completely ignore the dimension on which they are not primarily competing. Firms
that target differentiation still need to focus on costs so that the differentiation can be
achieved at an acceptable cost. Similarly, cost leaders cannot compete unless they achieve
at least a minimum level on key dimensions on which competitors might differentiate,
such as quality and service.
Achieving Competi tive Advantage
The choice of competitive strategy does not automatically lead to the achievement of
competitive advantage. To achieve competitive advantage, the firm has to have the capa-
bilities needed to implement and sustain the chosen strategy. Both cost leadership and
differentiation strategy require that the firm make the necessary commitments to acquire
the core competencies needed and structure its value chain in an appropriate way. Core
competencies are the economic assets that the firm possesses, whereas the value chain is
the set of activities that the firm performs to convert inputs into outputs.
To evaluate whether a firm is likely to achieve its intended competitive advantage, the
analyst should ask the following questions:
• What is the customer need that the company is focusing on?
• How does the company distinguish its customer value proposition from the alter-
native propositions available to the customers from its competitors?
• Does the firm currently have the key capabilities and processes to deliver its value
proposition?
Sustaining Compet itive Advantage
The uniqueness of a firm’s core competencies and its value chain and the extent to
which it is difficult for competitors to imitate them determine the sustainability of a
firm’s competitive advantage.
16
Very few companies are able to sustain their competitive
advantage over a long period of time. There are a number of reasons for this. First, suc-
cessful strategies are often copied by competitors. This can only be prevented or delayed
if there are explicit barriers such as patents or other legal protections, or implicit barriers
such as customer switching costs or first mover advantages. The second reason why
firms lose their competitive advantage is due to changes in the environment. New tech-
nologies, changes in regulation, changes in customer requirements make current value
propositions obsolete or enable creation of new, substitute propositions that might be
more attractive for customers. As industries and markets evolve over time, it is critical
that a firm’s strategy evolve as well in response. The competitors who will win over
time will be the ones who will continually be alert to the need to adapt to changing
industry dynamics.
To evaluate whether or not a firm is likely to sustain its competitive advantage, an
analyst should ask the following questions:
• Are there any barriers to imitation in this company’s strategy? If so, what are they?
How long are they likely to last?
• Are there any changes that potentially affect this company’s industry and its stra-
tegic position in that industry? What are they? In what way are these changes
likely to lead to lead to changes in the competitive dynamics in this industry?
• What actions, if any, can this company take to address these changes, and renew
its competitive advantage? How likely is it that the company will be able to renew
itself successfully?
Strategy Analysis 2-13
Copyright 2012 Cengage Learning. All Rights Reserved. May not be copied, scanned, or duplicated, in whole or in part. Due to electronic rights, some third party content may be suppressed from the eBook and/or eChapter(s).
Editorial review has deemed that any suppressed content does not materially affect the overall learning experience. Cengage Learning reserves the right to remove additional content at any time if subsequent rights restrictions require it.
Applying Competitive Strategy Analysis
Let us consider the concepts of competitive strategy analysis in the context of TJX and
Nordstrom.
The TJX Companies, Inc.
TJX is the leading off-price apparel and home fashions retailer in the United States and
worldwide. At the beginning of 2011, the company operated over 2,700 retail outlets
through its T.J. Maxx, Marshalls, and HomeGoods brands in the United States; its Win-
ners, Marshalls and HomeSense brands in Canada; and its T.K. Maxx and HomeSense
brands in Europe.
17
TJX pursues a cost leadership strategy, offering its customers a “rapidly changing
assortment of quality, brand-name and designer merchandise at prices generally 20% to
60% below department and specialty store regular prices, every day.”
18
In order to exe-
cute that strategy, the company has developed a low-cost, flexible business model that
has at its core a focus on opportunistic buying of merchandise. Since TJX’s philosophy
of presenting its customers with a “treasure hunt atmosphere” is not dependent on offer-
ing complete product lines, having all sizes available, or presenting a set mix of merchan-
dise, it has the ability to buy partial lots, discontinued items, or cancelled orders. This
opportunistic positioning allows TJX to purchase very late in the merchandising cycle,
enabling it to react quickly to market trends, to negotiate the best deals, and to adjust
pricing to maintain its margin.
19
Key elements of this business model:
• Open store concept: The lack of set departments in its stores allows TJX to main-
tain an opportunistic product mix that targets current consumer tastes.
20
• Global sourcing network: In order to source product opportunistically with maxi-
mum effectiveness, TJX maintains a global sourcing network, which in 2011 con-
sisted of 700 buyers managing 14,000 vendors across 60 countries. As TJX noted in
its 2009 Annual Report, “One way to think about our business model is as more of
a sourcing machine than most other retailers.”
21
• Significant buying power: TJX quotes its “$20 billion buying pencil”
22
to describe
the buying power its large scale gives it with vendors.
• Focus on efficient inventory management: True to its positioning as a low-cost com-
petitor, TJX has an ongoing focus on increasing the efficiency of its supply chain.
23
TJX sees itself as well positioned to take advantage of what it sees as a permanent
shift in consumer spending behavior as a result of the global financial crisis: “We believe
that there has been a paradigm shift among consumers to value and that our new custo-
mers will continue to be attracted to our great values even as the recession abates….
What sets this recession apart from previous ones is that we have seen positive business
trends accelerate during the recession, underscoring our belief that there has been a fun-
damental shift in the consumer psyche toward value.”
24
During fiscal year 2010 (ending January 29, 2011), TJX results seemed to bear out
management’s viewpoint. Despite a challenging retail climate, sales increased by 8 per-
cent to $21.9 billion, with same store sales increasing by 4 percent. Cost of sales fell,
reflecting improved merchandise margins and increased cost leverage. Overall, net
income grew 11 percent to $1.3 billion.
25
However, while TJX seemed to be executing
its cost leadership strategy successfully, changes in the industry structure and moves by
competitors had begun to raise questions about the long term sustainability of TJX’s
competitive position. Key questions:
• Will there be enough merchandise available to purchase? As competitors such as
Nordstrom and Saks Fifth Avenue rapidly expand their own off-price chains, an
2-14
PART 2 • Business Analysis and Valuation Tools
Copyright 2012 Cengage Learning. All Rights Reserved. May not be copied, scanned, or duplicated, in whole or in part. Due to electronic rights, some third party content may be suppressed from the eBook and/or eChapter(s).
Editorial review has deemed that any suppressed content does not materially affect the overall learning experience. Cengage Learning reserves the right to remove additional content at any time if subsequent rights restrictions require it.
ever-growing TJX could eventually face merchandise sourcing constraints as com-
petitors increasingly retain product for their own off-price channels. TJX is cogni-
zant of this potential issue and views its extensive global sourcing network and
strong supplier relationships as key to its success in product procurement going
forward.
26
• Can TJX expand successfully outside of the United States? TJX views continued
expansion as key to maintaining its low-cost position over the long term by ever-
increasing purchasing and operational leverage. However, as it increasingly looks
outside the United States for growth, it remains to be seen whether it can achieve
the same success internationally.
• Is the shift to value permanent? It remains to be seen whether this consumer shift
that TJX sees is permanent. TJX has undertaken a program of store remodeling
and has made additional advertising expenditures in order to capitalize on this
shift.
27
It is an open question whether this expenditure will result in a permanent
increase in market share.
• What about the Internet? As of 2011, TJX had almost no online presence. While
it is not clear at this point what threat online retailing represents to the TJX “trea-
sure hunt” model, moves by competitors, such as the recent purchase of Haute-
Look (an online apparel auction site) by Nordstrom and the increasing ubiquity
of online retailing, raises the question of what TJX will need to do to defend itself
against this substitute channel.
Nordstrom, Inc.
Nordstrom is a high-end department store offering a wide variety of apparel, shoes, and
accessories. Founded as a shoe store in Seattle, Washington, in 1901, the company
quickly became known for its broad selection of high-quality merchandise coupled with
exceptional customer service. By 2011 the company had grown to be a leading retailer,
operating 207 stores located in 28 states (both full-line Nordstrom and discount Nord-
strom Rack stores) as well as a growing online presence. The company also offered a
variety of private label credit and debit card products through Nordstrom fsb, its
wholly-owned bank. The company posted 2010 annual earnings of $613 million against
annual revenues of $9.7 billion.
28
Nordstrom’s success has historically been based on a competitive strategy of differen-
tiation that has sought to build loyalty in consumers who have many retail purchase
options. The key elements of that strategy:
• Providing exceptional customer service: From the beginning, Nordstrom has sought
to differentiate itself in the market by providing exceptional customer service. A
quote from the 2009 annual report sums up this customer-centric philosophy:
“We follow, first and foremost, a customer strategy at Nordstrom—not a price,
brand, technology or any other corporate strategy.”
29
• Offering a broad selection of high-end, differentiated merchandise closely targeted to
local tastes: Nordstrom has sought to differentiate itself from competitors by low
product overlap, which it has achieved with exclusive agreements with designers
as well as by the development of an extensive private label line. In addition, Nord-
strom prides itself on making buying decisions with local customer input, thus
maximizing merchandizing success and minimizing inventory investments.
While the above broad strategic elements have served it well for much of its 110-year
history, in recent years Nordstrom has recognized that the rapid expansion of the online
channel and the rise of the discount retail model represent shifts in the market that
could threaten the long-term sustainability of its differentiation strategy. As such,
Strategy Analysis 2-15
Copyright 2012 Cengage Learning. All Rights Reserved. May not be copied, scanned, or duplicated, in whole or in part. Due to electronic rights, some third party content may be suppressed from the eBook and/or eChapter(s).
Editorial review has deemed that any suppressed content does not materially affect the overall learning experience. Cengage Learning reserves the right to remove additional content at any time if subsequent rights restrictions require it.
Nordstrom’s current strategy is to stay true to its original precepts of superior customer
service and product selection, while adding additional initiatives that it views as critical
to remaining competitive in an evolving marketplace. Key initiatives being undertaken in
response to this market shift:
• Diversification into the discount segment— In response to the market shift towards
the discount segment, Nordstrom has rapidly expanded its Nordstrom Rack divi-
sion of off-price stores. This has served several purposes. First, in establishing its
own discount entrant, it has “created its own substitute” for customers that would
otherwise potentially be lost to a TJX or other discount retailer. Also, the Rack
division gives Nordstrom a channel to move slow-selling inventory from its full-
line stores without needing to resort to more frequent sales or markdowns that
might erode the brand. Finally, given that the discount segment tends to perform
better in poor economic times, this can be seen as adding counter-cyclical balance
to the full-line store segment.
• Expansion and integration of a multichannel presence—Responding to the changing
shopping habits of consumers, Nordstrom has recently undertaken a number of
initiatives designed to expand its online presence and fully integrate its systems
across all channels. In 2010 the company launched a new version of the
Nordstrom.com website designed to more effectively serve the online shopper.
The integration of inventory systems across channels has enabled seamless
multichannel customer services such as “Buy Online, Pick Up in Store” and rapid
fulfillment of online orders from local stores. Recent initiatives designed to further
enhance the multichannel offering include the addition of Wi-Fi to its full-line
stores, development of mobile checkout, and the acquisition of online retailer Hau-
teLook, Inc.—a provider of online private sales.
30
In general, Nordstrom views the
development of a seamless multichannel shopping experience as an extension of its
focus on providing superior customer service and as critical to its continued ability
to compete successfully in an evolving marketplace.
As the United States slowly began to emerge from the deep downturn that began in
2008, Nordstrom was a company taking steps to adapt to changing industry dynamics.
In early 2011, analysts seemed to think that it was on the right track:
“JWN remains one of our top picks in the department store space…. We believe Nord-
strom is the most technologically savvy of the large cap department stores. The acqui-
sition of HauteLook not only introduces a new revenue stream, but should help the
company further expand its internet marketing capabilities and monetize the multi-
channel customer (who spends 3-4x more than the store only customer).”
31
“From its move in 2009/2010 to integrate its in-store and online inventory to its
announcement yesterday of an acquisition of HauteLook, a leading online closeout
channel, the Company remains well ahead of competitors in its online presence. More-
over, we think that this helps provide a long-term roadmap for growth…”
32
“We continue to believe Nordstrom is a longer term share winner…”
33
Analysts’ opinions aside, it remains to be seen whether Nordstrom can maintain its
superior competitive position going forward in the rapidly evolving industry landscape.
CORPORATE STRATEGY ANALYSIS
So far in this chapter we have focused on strategies at the individual business level.
While some companies focus on only one business, many companies operate in multiple
businesses. For example, the average number of business segments operated by the top
2-16
PART 2 • Business Analysis and Valuation Tools
Copyright 2012 Cengage Learning. All Rights Reserved. May not be copied, scanned, or duplicated, in whole or in part. Due to electronic rights, some third party content may be suppressed from the eBook and/or eChapter(s).
Editorial review has deemed that any suppressed content does not materially affect the overall learning experience. Cengage Learning reserves the right to remove additional content at any time if subsequent rights restrictions require it.
500 U.S. companies in 1992 was eleven industries.
34
In recent years, there has been an
attempt by U.S. companies to reduce the diversity of their operations and focus on a rel-
atively few “core” businesses. However, multi-business organizations continue to domi-
nate the economic activity in most countries in the world.
When analyzing a multi-business organization, an analyst has to evaluate not only the
industries and strategies of the individual business units but also the economic conse-
quences—either positive or negative—of managing all the different businesses under
one corporate umbrella. Some companies have viewed this multibusiness structure as a
source of strength and have embraced it, while others have seen it as distracting and
value dilutive and have moved to narrow their business focus. For example, General
Electric has been very successful in creating significant value by managing a highly diver-
sified set of businesses ranging from aircraft engines to light bulbs. In contrast, starting
in 2000, the Swiss pharmaceutical giant Roche sold off its flavors and fragrances, vita-
mins, and fine chemicals businesses to focus on oncology and diagnostics.
35
Sources of Value Creation at the Corporate Level
Economists and strategy researchers have identified several factors that influence an
organization’s ability to create value through a broad corporate scope. Economic theory
suggests that the optimal scope of activity of a firm depends on the relative transaction
cost of performing a set of activities inside the firm versus using the market mecha-
nism.
36
Transaction cost economics implies that the multiproduct firm is an efficient
choice of organizational form when coordination among independent, focused firms is
costly due to market transaction costs.
Transaction costs can arise out of several sources. They may arise if the production
process involves specialized assets such as human capital skills, proprietary technology,
or other organizational know-how that is not easily available in the marketplace. Trans-
action costs also may arise from market imperfections such as information and incentive
problems. If buyers and sellers cannot solve these problems through standard mechan-
isms such as enforceable contracts, it will be costly to conduct transactions through mar-
ket mechanisms.
For example, as discussed in Chapter 1, capital markets may not work well when
there are significant information and incentive problems, making it difficult for entrepre-
neurs to raise capital from investors. Similarly, if buyers cannot ascertain the quality of
products being sold because of lack of information, or cannot enforce warranties because
of poor legal infrastructure, entrepreneurs will find it difficult to break into new markets.
Finally, if employers cannot assess the quality of applicants for new positions, they will
have to rely more on internal promotions rather than external recruiting to fill higher
positions in an organization. Emerging economies often suffer from these types of trans-
action costs because of poorly developed intermediation infrastructure.
37
Even in many
advanced economies, examples of high transaction costs can be found. For example, in
most countries other than the United States, the venture capital industry is not highly
developed, making it costly for new businesses in high technology industries to attract
financing. Even in the United States, transaction costs may vary across economic sectors.
For example, electronic commerce continues to be hampered by consumer concerns
regarding the security of credit card information sent over the Internet.
38
Transactions inside an organization may be less costly than market-based transactions
for several reasons. First, communication costs inside an organization are reduced
because confidentiality can be protected and credibility can be assured through internal
mechanisms. Second, the head office can play a critical role in reducing costs of enfor-
cing agreements between organizational subunits. Third, organizational subunits can
Strategy Analysis 2-17
Copyright 2012 Cengage Learning. All Rights Reserved. May not be copied, scanned, or duplicated, in whole or in part. Due to electronic rights, some third party content may be suppressed from the eBook and/or eChapter(s).
Editorial review has deemed that any suppressed content does not materially affect the overall learning experience. Cengage Learning reserves the right to remove additional content at any time if subsequent rights restrictions require it.
share valuable non-tradable assets (such as organizational skills, systems, and processes)
or non-divisible assets (such as brand names, distribution channels, and reputation).
There are also forces that increase transaction costs inside organizations. Top man-
agement of an organization may lack the specialized information and skills necessary to
manage businesses across several different industries. This lack of expertise reduces the
possibility of actually realizing economies of scope, even when there is potential for such
economies. This problem can be remedied by creating a decentralized organization, hir-
ing specialist managers to run each business unit, and providing these managers with
proper incentives. However, decentralization will also potentially decrease goal congru-
ence among subunit managers, making it difficult to realize economies of scope.
Whether or not a multibusiness organization creates more value than a comparable
collection of focused firms is, therefore, context dependent.
39
Analysts should ask the fol-
lowing questions to assess whether an organization’s corporate strategy has the potential
to create value:
• Are there significant imperfections in the product, labor, or financial markets in
the industries (or countries) in which a company is operating? Is it likely that
transaction costs in these markets are higher than the costs of similar activities
inside a well-managed organization?
• Does the organization have special resources such as brand names, proprietary
know-how, access to scarce distribution channels, and special organizational pro-
cesses that have the potential to create economies of scope?
• Is there a good fit between the company’s specialized resources and the portfolio of
businesses in which the company is operating?
• Does the company allocate decision rights between the headquarters office and the
business units optimally to realize all the potential economies of scope?
• Does the company have internal measurement, information, and incentive systems
to reduce agency costs and increase coordination across business units?
Empirical evidence suggests that creating value through a multibusiness corporate strat-
egy is difficult in practice. Several researchers have documented that diversified U.S. com-
panies trade at a discount in the stock market relative to a comparable portfolio of focused
companies.
40
Studies also show that acquisitions of one company by another, especially
when the two are in unrelated businesses, often fail to create value for the acquiring compa-
nies.
41
Finally, there is considerable evidence that value is created when multibusiness com-
panies increase corporate focus through divisional spin-offs and asset sales.
42
There are several potential explanations for this diversification discount. First, man-
agers’ decisions to diversify and expand are frequently driven by a desire to maximize
the size of their organization rather than to maximize shareholder value. Second, diversi-
fied companies often suffer from incentive misalignment problems leading to suboptimal
investment decisions and poor operating performance. Third, capital markets find it dif-
ficult to monitor and value multibusiness organizations because of inadequate disclosure
about the performance of individual business segments.
In summary, while companies can theoretically create value through innovative cor-
porate strategies, there are many ways in which this potential fails to get realized in prac-
tice. Therefore, it pays to be skeptical when evaluating companies ’ corporate strategies.
Applying Corporate Strategy Analysis
Let’s apply the concepts of corporate strategy analysis to the Tata Group, a diversified
global company headquartered in India. Tata traces its beginnings to the founding of a
private trading firm in 1868. In 2009-2010 the company reported revenues of
2-18
PART 2 • Business Analysis and Valuation Tools
Copyright 2012 Cengage Learning. All Rights Reserved. May not be copied, scanned, or duplicated, in whole or in part. Due to electronic rights, some third party content may be suppressed from the eBook and/or eChapter(s).
Editorial review has deemed that any suppressed content does not materially affect the overall learning experience. Cengage Learning reserves the right to remove additional content at any time if subsequent rights restrictions require it.
$67.4 billion, employed almost 400,000 people, and had operations in over 80 coun-
tries.
43
Its structure as a diversified conglomerate reflects its Indian roots as a legacy of
the British colonial managing agency system, and also in the need to provide its own
intermediary infrastructure in the absence of that infrastructure in the emerging Indian
market.
44
Chairman Ratan Tata has worked since his appointment in 1991 to turn what
was then a collection of highly independent companies spread across disparate industries
into a modern global enterprise able to harness the value of multicompany synergy to
successfully compete in India and beyond.
At the end of 2010, the Tata Group was organized into seven business sectors:
45
• Information Technology and Communications: In 2009-2010 this sector represented
about 16 percent of Tata’s revenues. Tata Consultancy Services is India’s most
valuable IT company and its over 140,000 consultants provide IT services, business
solutions, and outsourcing across 42 countries. This sector also includes companies
engaged in product design and technology development services, interactive learn-
ing development, business support services, and telecommunications.
• Engineering products and services: This sector represented about 33 percent of
Tata’s revenues. Tata Motors, producer of the Nano, the world’s least expensive
car, is India’s largest automobile company, and is also a significant player globally,
being the world’s fourth-largest truck manufacturer, the second-largest bus manu-
facturer, and the owner (since 2008) of Jaguar Land Rover. Other companies in
this sector provide automotive, construction, and engineering products and
services.
• Materials: Materials represented about 32 percent of Tata’s revenues. Tata Steel, a
Fortune Global 500 company in its own right,
46
employs over 80,000 people in
nearly 50 countries. Other companies in the sector provide a wide range of materi-
als production and services.
• Services: Services represented about 4 percent of Tata’s revenues. The Taj Hotels
Resorts and Palaces group offers 66 hotels across India as well as 16 international
locations, while related companies provide additional rea-estate-focused services.
Tata AIG Life Insurance Company and Tata AIG General Insurance Company
provide insurance solutions to individuals and businesses. Additional companies
provide asset management, management consulting, and other services.
• Energy: Energy represented about 6 percent of Tata’s revenues. Tata Power is
India’s largest private-sector-integrated power utility. Tata BP Solar is the largest
Indian maker of solar photovoltaic and solar water heating products.
• Consumer Products: Consumer products represented about 4 percent of Tata’s rev-
enues. Tata Beverage Group markets brands such as Tata Tea, Tata Coffee, Tetley
(the leading UK market brand), Eight O’Clock Coffee, and Mount Everest Mineral
Water. Other companies in the sector own retail stores, and also produce and mar-
ket watches, jewelry, and eyewear.
• Chemicals: Chemicals represented about 3 percent of Tata’s revenues. Tata Chemi-
cals is the world’s second largest producer of soda ash, and produces a variety of
chemicals for the consumer, industrial, and farm sectors. Other companies in the
sector pursue drug discovery and development and produce agrochemicals.
Given the conventional wisdom that multi-industry conglomerates will struggle to
compete against their more-focused competitors, how has Tata managed to achieve its
success thus far? The answer lies in the well-executed development of centralized
functions applied across the group that support, connect, and elevate the individual com-
panies on many different levels, while at the same time allowing them the independence
to succeed on their own. Key elements of this model include:
Strategy Analysis 2-19
Copyright 2012 Cengage Learning. All Rights Reserved. May not be copied, scanned, or duplicated, in whole or in part. Due to electronic rights, some third party content may be suppressed from the eBook and/or eChapter(s).
Editorial review has deemed that any suppressed content does not materially affect the overall learning experience. Cengage Learning reserves the right to remove additional content at any time if subsequent rights restrictions require it.
• The primary connection between the Tata Group companies, and perhaps their
biggest collective source of strength is the Tata Brand, which in 2011 was named
one of the top 50 global brands by Brand Finance.
47
This recognition comes as the
result of a well-planned and careful nurturing of the brand by Chairman Tata that
began in 1995 when he introduced the Tata Brand Equity Scheme. This subscrip-
tion plan establishes the criteria by which a subscriber company may use the Tata
brand and also gain access to the resources of the broader group.
48
Subscribing
companies sign the Brand Equity and Business Promotion (BEBP) agreement,
which specifies a required code of conduct that helps to ensure high standards of
quality and integrity across the company. A centralized organization, Tata Quality
Management Services (TQMS), works to help Tata companies achieve their busi-
ness objectives and meet the standards specified by the agreement. Companies
who excel in quality management can be nominated for the JRD Quality Value
Award, which is modeled after the Malcolm Baldrige Award.
49
Conversely, compa-
nies who fail to meet the standards set out in the BEBP agreement risk losing their
right to use the Tata name. The value of the Tata brand is immense for a group
company that is not well recognized in its market, and especially in emerging mar-
kets the brand can be a very powerful and important sign of quality and integrity.
• The Tata Group exploits its scale and the diversity of its collective companies in
order to foster learning, leadership development, and the sharing of best practices
across the group. Tata Administrative Services (TAS) coordinates a group-wide
management recruitment and development program, recruiting at top Indian busi-
ness schools and rotating new managers across group companies during a five-year
development plan. The Tata Management Training Centre (TMTC) brings
together senior executives, who share insights with their fellow executives from a
huge diversity of industries.
50
The scale of the company is such that these pro-
grams can easily bring together 50 or more company CEOs, who share best prac-
tices, view problems from a multitude of perspectives, and build relationships that
help facilitate cross-company communication and synergy.
• While Tata Group companies operate with a significant degree of independence,
they have the financial, intellectual, and other resources of the broader group
behind them. In many ways the central office acts as a venture capitalist—serving
as a resource for investment funds, management expertise, and connections within
the broader group, in industry, and in government. Much like venture capitalists,
the Group Executive Office (GEO) members sit on the boards of Tata Group com-
panies in order to facilitate communication between the central office and individ-
ual companies, and to bring the knowledge and experience of the broader group to
each individual company.
51
This support allows group companies to act like a
much larger company in making acquisitions, investing in new technologies, and
making other strategic moves. The power of this backing can be seen in the acqui-
sitions of Tetley Tea by Tata Tea in 2000, Corus by Tata Steel in 2007, and Jaguar
Land Rover by Tata Motors in 2008, all of which represented an acquisition of a
company much larger than the Tata company which acquired it. This would not
have been possible without the backing of the broader group.
52
As of 2010, almost 60 percent of Tata Group revenue came from outside the Indian mar-
ket.
53
The increasingly global footprint of the company as well as the evolving global econ-
omy present several challenges to the effectiveness of its conglomerate model. First, the
continued expansion into developed countries may reduce the importance of the internal
intermediary infrastructure that Tata has worked to develop. Second, as the Indian econ-
omy continues to evolve, this same issue may eventually hold true in the home market.
2-20
PART 2 • Business Analysis and Valuation Tools
Copyright 2012 Cengage Learning. All Rights Reserved. May not be copied, scanned, or duplicated, in whole or in part. Due to electronic rights, some third party content may be suppressed from the eBook and/or eChapter(s).
Editorial review has deemed that any suppressed content does not materially affect the overall learning experience. Cengage Learning reserves the right to remove additional content at any time if subsequent rights restrictions require it.

Finally, the continued successful integration and coordination of the operating companies
in a company with a strong tradition of independence will be made ever harder when spread
across an increasingly broad geography. As the company works to identify a worthy succes-
sor to Ratan Tata (who is scheduled to retire in 2012),
54
how the Tata Group responds in
the coming years to the challenges and opportunities presented by both globalization and
the rapid development of its Indian home market will be closely watched as a test case for
the viability of the multi-industry conglomerate in the modern global economy.
SUMMARY
Strategy analysis is an important starting point for the analysis of financial statements
because it allows the analyst to probe the economics of the firm at a qualitative level.
Strategy analysis also allows the identification of the firm’s profit drivers and key risks,
enabling the analyst to assess the sustainability of the firm’s performance and make real-
istic forecasts of future performance.
Whether a firm is able to earn a return on its capital in excess of its cost of capital is
determined by its own strategic choices: (1) the choice of an industry or a set of indus-
tries in which the firm operates (industry choice), (2) the manner in which the firm
intends to compete with other firms in its chosen industry or industries (competitive
positioning), and (3) the way in which the firm expects to create and exploit synergies
across the range of businesses in which it operates (corporate strategy). Strategy analysis
involves analyzing all three choices.
Industry analysis consists of identifying the economic factors which drive industry
profitability. In general, an industry’s average profit potential is influenced by the degree
of rivalry among existing competitors, the ease with which new firms can enter the
industry, the availability of substitute products, the power of buyers, and the power of
suppliers. To perform industry analysis, the analyst has to assess the current strength
of each of these forces in an industry and make forecasts of any likely future changes.
Competitive strategy analysis involves identifying the basis on which the firm intends
to compete in its industry. In general, there are two potential strategies that could pro-
vide a firm with a competitive advantage: cost leadership and differentiation. Cost lead-
ership involves offering at a lower cost the same product or service that other firms offer.
Differentiation involves satisfying a chosen dimension of customer need better than the
competition, at an incremental cost that is less than the price premium that customers
are willing to pay. To perform strategy analysis, the analyst has to identify the firm’s
intended strategy, assess whether the firm possesses the competencies required to execute
the strategy, and recognize the key risks that the firm has to guard against. The analyst
also has to evaluate the sustainability of the firm’s strategy.
Corporate strategy analysis involves examining whether a company is able to create
value by being in multiple businesses at the same time. A well-crafted corporate strategy
reduces costs or increases revenues from running several businesses in one firm relative
to the same businesses operating independently and transacting with each other in the
marketplace. These cost savings or revenue increases come from specialized resources
that the firm has to exploit synergies across these businesses. For these resources to be
valuable, they must be non-tradable, not easily imitated by competition, and non-
divisible. Even when a firm has such resources, it can create value through a multibusi-
ness organization only when it is managed so that the information and agency costs
inside the organization are smaller than the market transaction costs.
The insights gained from strategy analysis can be useful in performing the remainder
of the financial statement analysis. In accounting analysis, the analyst can examine
Strategy Analysis 2-21
Copyright 2012 Cengage Learning. All Rights Reserved. May not be copied, scanned, or duplicated, in whole or in part. Due to electronic rights, some third party content may be suppressed from the eBook and/or eChapter(s).
Editorial review has deemed that any suppressed content does not materially affect the overall learning experience. Cengage Learning reserves the right to remove additional content at any time if subsequent rights restrictions require it.

whether a firm’s accounting policies and estimates are consistent with its stated strategy.
For example, a firm’s choice of functional currency in accounting for its international
operations should be consistent with the level of integration between domestic and inter-
national operations that the business strategy calls for. Similarly, a firm that mainly sells
housing to high-risk customers should have higher-than-average bad debts expenses and
a higher-than-average allowance for loan losses.
Strategy analysis is also useful in guiding financial analysis. For example, in a cross-
sectional analysis, the analyst should expect firms with cost leadership strategy to have
lower gross margins and higher asset turnover than firms that follow differentiated strat-
egies. In a time series analysis, the analyst should closely monitor any increases in
expense ratios and asset turnover ratios for low-cost firms, and any decreases in invest-
ments critical to differentiation for firms that follow differentiation strategy.
Business strategy analysis also helps in prospective analysis and valuation. First, it
allows the analyst to assess whether, and for how long, differences between the firm’s
performance and its industry’s (or industries’) performance are likely to persist. Second,
strategy analysis facilitates forecasting investment outlays the firm has to make to main-
tain its competitive advantage.
DISCUSSION QUESTI ONS
1. Judith, an accounting major, states, “Strategy analysis seems to be an unnecessary
detour in doing financial statement analysis. Why can’t we just get straight to the
accounting issues?” Explain to Judith why she might be wrong.
2. What are the critical drivers of industry profitability?
3. One of the fastest growing industries in the last 20 years is the memory chip indus-
try, which supplies chips for personal computers and other electronic devices. Yet
the average profitability for this industry has been very low. Using the industry anal-
ysis framework, list all the potential factors that might explain this apparent
contradiction.
4. Rate the pharmaceutical and lumber industries as high, medium, or low on the fol-
lowing dimensions of industry structure:
Pharmaceutical
Industry
Lumber
Industry
......................................................................................................................................
Rivalry
Threat of new entrants
Threat of substitute products
Bargaining power of buyers
Bargaining power of suppliers
......................................................................................................................................
Given your ratings, which industry would you expect to earn the highest returns?
.......................................................................................................................................
5. Joe Smith argues, “Your analysis of the five forces that affect industry profitability is
incomplete. For example, in the banking industry, I can think of at least three other
factors that are also important; namely, government regulation, demographic trends,
and cultural factors.” His classmate Jane Brown disagrees and says, “These three fac-
tors are important only to the extent that they influence one of the five forces.”
Explain how, if at all, the three factors discussed by Joe affect the five forces in the
banking industry.
6. Coca-Cola and Pepsi are both very profitable soft drinks. Inputs for these products
include corn syrup, bottles/cans, and soft drink syrup. Coca-Cola and Pepsi produce
2-22
PART 2 • Business Analysis and Valuation Tools
Copyright 2012 Cengage Learning. All Rights Reserved. May not be copied, scanned, or duplicated, in whole or in part. Due to electronic rights, some third party content may be suppressed from the eBook and/or eChapter(s).
Editorial review has deemed that any suppressed content does not materially affect the overall learning experience. Cengage Learning reserves the right to remove additional content at any time if subsequent rights restrictions require it.

the syrup themselves and purchase the other inputs. They then enter into exclusive
contracts with independent bottlers to produce their products. Use the five forces
framework and your knowledge of the soft drink industry to explain how Coca-
Cola and Pepsi are able to retain most of the profits in this industry.
7. All major airlines offer frequent flier programs. Originally seen as a way to differen-
tiate their providers in response to excess capacity in the industry, these programs
have long since become ubiquitous. Many industry analysts believe that these pro-
grams have met with only mixed success in accomplishing their goal. Use the com-
petitive advantage concepts to explain why.
8. What are the ways that a firm can create barriers to entry to deter competition in its
business? What factors determine whether these barriers are likely to be enduring?
9. Explain why you agree or disagree with each of the following statements:
a. It is better to be a differentiator than a cost leader, since you can then charge
premium prices.
b. It is more profitable to be in a high technology industry than a low technology
one.
c. The reason industries with large investments have high barriers to entry is that it
is costly to raise capital.
10. There are very few companies that are able to be both cost leaders and differentia-
tors. Why? Can you think of a company that has been successful at both?
11. Many consultants are advising diversified companies in emerging markets such as
India, South Korea, Mexico, and Turkey to adopt corporate strategies proven to be
of value in advanced economies such as the United States and the United Kingdom.
What are the pros and cons of this advice?
NOTES
1. The discussion presented here is intended to provide a basic background in strategy
analysis. For a more complete discussion of the strategy concepts, see, for example,
Contemporary Strategy Analysis by Robert M. Grant (Cambridge, MA: Blackwell
Publishers, 1991); Economics of Strategy by David Besanko, David Dranove, and
Mark Shanley (New York: John Wiley & Sons, 1996); Strategy and the Business
Landscape by Pankaj Ghemawat (Reading, MA: Addison Wesley Longman, 1999);
and Corporate Strategy: Resources and the Scope of the Firm by David J. Collis and
Cynthia Montgomery (Burr Ridge, IL: Irwin/McGraw-Hill, 1997).
2. Standard & Poor’s Compustat data via Research Insight, accessed November 2010.
The analysis here owes its logic to that presented in A. M. McGahan, “Do Compe-
titors Perform Better When They Pursue Different Strategies?” working paper, Har-
vard Business School, May 12, 1999).
3. For a summary of this research, see F. M. Scherer, Industrial Market Structure and
Economic Performance, second edition (Chicago: Rand McNally College Publishing,
1980).
4. See M. E. Porter, Competitive Strategy (New York: The Free Press, 1980).
5. The U.S. Department of Justice and the Federal Trade Commission use the
Herfindahl-Hirschman Index (HHI) to measure concentration when evaluating hor-
izontal mergers. The HHI is calculated by summing the squares of the individual
market shares of all the participants. The Department of Justice considers a market
with a result of less than 1,000 to be a competitive marketplace; a result of 1,000 to
1,800 to be a moderately concentrated marketplace; and a result of 1,800 or greater
to be a highly concentrated marketplace. The four-firm concentration ratio is
Strategy Analysis 2-23
Copyright 2012 Cengage Learning. All Rights Reserved. May not be copied, scanned, or duplicated, in whole or in part. Due to electronic rights, some third party content may be suppressed from the eBook and/or eChapter(s).
Editorial review has deemed that any suppressed content does not materially affect the overall learning experience. Cengage Learning reserves the right to remove additional content at any time if subsequent rights restrictions require it.
another commonly used measure of industry concentration; it refers to the market
share of the four largest firms in an industry.
6. Tesla Motors, Inc., Form S-1 (filed January 29, 2010), p. 17, http://www.sec.gov/
Archives/edgar/data/1318605/000119312510017054/ds1.htm, accessed January, 2011.
7. While the discussion here uses buyer to connote industrial buyers, the same con-
cepts also apply to buyers of consumer products. Throughout this chapter we use
the terms buyers and customers interchangeably.
8. Standard & Poor’s Compustat data via Research Insight, accessed April 2011. The
department store industry is defined here as those firms contained in SIC codes
5311, 5331, and 5651.
9. The TJX Companies, Inc., 2010 Annual Report, via Thomson ONE, accessed August
2011.
10. Nordstrom, Inc., January 29, 2011, Form 10-K (filed March 18, 2011), p. 6, via
Thomson ONE, accessed April 2011.
11. See for instance, C. Roche, P. Ducasse, C. Liao, and C. Grevler, “A New World
Order of Consumption 2010 Report on Consumer Sentiment,” The Boston Consult-
ing Group, June 28, 2010, https://www.bcgperspectives.com/content/articles/consumer_
products_retail_new_world_order_of_consumption/, accessed February 2011.
12. J. Weber and A. T. Palmer, “How The Net Is Remaking The Mall,” Bloomberg Busi-
nessweek, May 9, 2005, http://www.businessweek.com/magazine/content/05_19/
b3932105_mz057.htm, accessed April 2011; B. Boswell, “Investors Want to Know:
What Defines a Lifestyle Center?” Retail Traffic, December 1, 2002, http://retailtraf-
ficmag.com/mag/retail_investors_know_defines/, accessed April 6, 2011.
13. For a more detailed discussion of these two sources of competitive advantage, see
M. E. Porter, Competitive Advantage: Creating and Sustaining Superior Performance
(New York: The Free Press, 1985).
14. Ibid.
15. For a more detailed discussion of this theory, see Michael E. Porter, “What is Strat-
egy,” Harvard Business Review (November-December 1996).
16. See G. Hamel and C. K. Prahalad, Competing for the Future (Boston: Harvard Busi-
ness School Press, 1994), for a more detailed discussion of the concept of core com-
petencies and their critical role in corporate strategy.
17. The TJX Companies, Inc., January 29, 2011, Form 10-K (filed March 30, 2011), p. 2,
via Morningstar Document Research, accessed February 2011.
18. Ibid.
19. Ibid., p. 4.
20. Ibid., p. 4.
21. The TJX Companies, Inc., 2009 Annual Report, p. 4, via Thomson ONE, accessed
February 2011.
22. The TJX Companies, “Background Information 2010,” The TJX Companies, Inc.
website, http://www.tjx.com/files/pdf/TJXbackground_2011.pdf, accessed April 2011.
23. The TJX Companies, Inc., 2009 Annual Report, p. 6, via Thomson ONE, accessed
February 2011.
24. Ibid., pp. 2–3.
25. The TJX Companies, Inc., January 29, 2011, Form 10-K (filed March 30, 2011),
p. 30, via Morningstar Document Research, accessed February 2011.
26. The TJX Companies, Inc., “Why We Always Have Product Availability,” The TJX
Companies, Inc. website, http://www.tjx.com/investor_2.asp, accessed February 2011.
27. The TJX Companies, Inc., 2009 Annual Report, p. 4, http://thomson.mobular.net/
thomson/7/2968/4250/, accessed February 2011.
2-24
PART 2 • Business Analysis and Valuation Tools
Copyright 2012 Cengage Learning. All Rights Reserved. May not be copied, scanned, or duplicated, in whole or in part. Due to electronic rights, some third party content may be suppressed from the eBook and/or eChapter(s).
Editorial review has deemed that any suppressed content does not materially affect the overall learning experience. Cengage Learning reserves the right to remove additional content at any time if subsequent rights restrictions require it.
28. Nordstrom, Inc., January 29, 2011, Form 10-K (filed March 18, 2011), p. 16, via
Thomson ONE, accessed April 2011.
29. Nordstrom, Inc., 2009 Annual Report, p. 3, via Thomson ONE, accessed April 2011.
30. Nordstrom, Inc., 2010 Annual Report, pp. 4–5, via Thomson ONE, accessed May
2011.
31. M. L. Clark and C. Cuomo, “Nordstrom Highlights from Dinner with Management;
Reiterate Overweight Rating, ” Morgan Stanley Research, March 16, 2011, via Thom-
son ONE, accessed April 2011.
32. E. Yruma and C. Sharma, “Nordstrom, Inc.: JWN: 4Q - Flow Through, Forward
Thinking,” KeyBanc Capital Markets, February 18, 2011, via Thomson ONE,
accessed April 2011.
33. M. Exstein, C. Su, and T. Schorgi, “Full Price Selling Remains Strong Along with the
Franchise Itself, Aggressively Expanding Its Presence in Both Physical Stores and E-
Commerce,” Credit Suisse Equity Research, February 17, 2011, via Thomson ONE,
accessed April 2011.
34. C. Montgomery, “Corporate Diversification,” Journal of Economic Perspectives, Sum-
mer 1994.
35. M. C. Mankins, D. Harding, and R. M. Weddigen, “How the Best Divest,” Harvard
Business Review (October 2008).
36. The following works are seminal to transaction cost economics: R. Coase, “The
Nature of the Firm,” Economica 4 (1937): 386–405; O. Williamson, Markets and
Hierarchies: Analysis and Antitrust Implications (New York: The Free Press, 1975);
and D. Teece, “Toward an Economic Theory of the Multi-product Firm,” Journal of
Economic Behavior and Organization 3 (1982): 39–63.
37. For a more complete discussion of these issues, see T. Khanna and K. Palepu,
“Building Institutional Infrastructure in Emerging Markets,” Brown Journal of
World Affairs, Winter/Spring 1998, and T. Khanna and K. Palepu, “Why Focused
Strategies May Be Wrong for Emerging Markets, ” Harvard Business Review (July-
August 1997).
38. “E-commerce Held Back by Security Concerns,” Ecommerce Journal (April 9, 2008),
http://ecommerce-journal.com/news/e_commerce_held_back_by_security_concerns,
accessed April 2011.
39. For an empirical study which illustrates this point, see T. Khanna and K. Palepu, “ Is
Group Affiliation Profitable in Emerging Markets? An Analysis of Diversified Indian
Business Groups,” Journal of Finance (April 2000): 867–891.
40. See L. Lang and R. Stulz, “Tobin’s q, diversification, and firm performance,” Journal
of Political Economy 102 (1994): 1248–1280, and Phillip Berger and Eli Ofek,
“Diversification’s Effect on Firm Value,” Journal of Financial Economics 37 (1994):
39–65.
41. See P. Healy, K. Palepu, and R. Ruback, “Which Takeovers Are Profitable: Strategic
or Financial?” Sloan Management Review 38 (Summer 1997): 45–57.
42. See K. Schipper and A. Smith, “Effects of Recontracting on Shareholder Wealth: The
Case of Voluntary Spin-offs,” Journal of Financial Economics 12 (December 1983):
437–467, and L. Lang, A. Poulsen, and R. Stulz, “Asset Sales, Firm Performance,
and the Agency Costs of Managerial Discretion,” Journal of Financial Economics 37
(January 1995): 3–37.
43. The Tata Group, “Leadership with trust,” The Tata Group website, http://www.tata.
com/aboutus/sub_index.aspx?sectid=8hOk5Qq3EfQ=, accessed April 2011.
44. For a broader discussion of this topic, see Tarun Khanna and Krishna Palepu, “The
Right Way to Restructure Conglomerates in Emerging Markets,” Harvard Business
Review (July-August 1999).
Strategy Analysis 2-25
Copyright 2012 Cengage Learning. All Rights Reserved. May not be copied, scanned, or duplicated, in whole or in part. Due to electronic rights, some third party content may be suppressed from the eBook and/or eChapter(s).
Editorial review has deemed that any suppressed content does not materially affect the overall learning experience. Cengage Learning reserves the right to remove additional content at any time if subsequent rights restrictions require it.
45. Information on Tata’s business sectors from The Tata Group, “Tata group sector-
wise operations,” The Tata Group website, http://www.tata.com/htm/Group_
Investor_pieChart.htm, accessed April 2011; The Tata Group, “Tata Group Bro-
chure,” The Tata Group website, http://www.tata.com/pdf/Tata_Group_Brochure.
pdf, accessed April 2011.
46. “GLOBAL 500 Our annual ranking of the world’s largest corporations,” Fortune Mag-
azine, http://money.cnn.com/magazines/fortune/global500/2009/snapshots/11459.html,
accessed March 2011.
47. S. Sharma, “Worth its salt: Tata among top 50 global brands,” The Financial
Express, March 22, 2011, http://www.financialexpress.com/news/worth-its-salt-tata-
among-top-50-global-brands/765653/1, accessed April 2011.
48. T. Khanna, K. Palepu, and D. M. Wu, “House of Tata, 1995: The Next Generation
(A),” Case No. 9-798-037 (Boston: Harvard Business School Publishing, 1998,
revised 2006), p. 6.
49. The Tata Group, “Business excellence,” The Tata Group website, http://www.tata.
com/article.aspx?artid=OMSlPyjJp68=, accessed April 2011.
50. The Tata Group, “Fan-TAS-tic fifty,” The Tata Group website, http://www.tata.com/
article.aspx?artid=qz8j1wqs3TU=, accessed April 2011.
51. T. Khanna and K. Palepu, “House of Tata—2000: The Next Generation (B),” Case No.
9-704-408 (Boston: Harvard Business School Publishing, 1998, revised 2006), p.1.
52. The Tata Group, “Mergers and acquisitions,” The Tata Group website, http://www.
tata.com/htm/Group_MnA_CompanyWise.htm, accessed May 2011.
53. The Tata Group, “Leadership with trust,” The Tata Group website, http://www.tata.
com/aboutus/sub_index.aspx?sectid=8hOk5Qq3EfQ=, accessed April 2011.
54. P. Mehra and J. Chakravort, “Ratan Tata to retire at end December 2012,” Reuters,
http://in.reuters.com/article/2010/08/04/idINIndia-50627320100804, accessed May
2011.
2-26
PART 2 • Business Analysis and Valuation Tools
Copyright 2012 Cengage Learning. All Rights Reserved. May not be copied, scanned, or duplicated, in whole or in part. Due to electronic rights, some third party content may be suppressed from the eBook and/or eChapter(s).
Editorial review has deemed that any suppressed content does not materially affect the overall learning experience. Cengage Learning reserves the right to remove additional content at any time if subsequent rights restrictions require it.

Chapter
3
OVERVIEW OF
ACCOUNTING ANALYSIS
T
he purpose of accounting analysis is to evaluate the degree to which a firm’s
accounting captures its underlying business reality.
1
By identifying places where
there is accounting flexibility, and by evaluating the appropriateness of the
firm’s accounting policies and estimates, analysts can assess the reliability of a firm’s
accounting numbers. Having identified any accounting distortions, analysts can then
adjust a firm’s accounting numbers using cash flow and footnote information to “undo”
the distortions. Sound accounting analysis improves the reliability of conclusions from
financial analysis, the next step in financial statement analysis.
THE INSTITUTIONAL FRAMEWORK FOR FINANCIAL REPORTI NG
There is typically a separation between ownership and management in public corpora-
tions. Financial statements serve as the vehicle through which owners keep track of
their firms’ financial situation. On a periodic basis, firms typically produce three primary
financial reports: (1) an income statement that describes the operating performance dur-
ing a time period, (2) a balance sheet that states the firm’ s assets and how they are
financed, and (3) a cash flow statement (or in some countries, a funds flow statement)
that summarizes the cash (or fund) flows of the firm. These statements are accompanied
by footnotes that provide additional details on the financial statement line items, as well
as by management’s narrative discussion of the firm’s performance in the Management
Discussion and Analysis section.
To evaluate effectively the quality of a firm’s financial statement data, the analyst
needs to first understand the basic features of financial reporting and the institutional
framework that governs them, as discussed in the following sections.
Accrual Accounting
One of the fundamental features of corporate financial reports is that they are prepared
using accrual rather than cash accounting. Unlike cash accounting, accrual accounting
distinguishes between the recording of costs and benefits associated with economic activ-
ities and the actual payment and receipt of cash. Net income is the primary periodic per-
formance index under accrual accounting. To compute net income, the effects of
economic transactions are recorded on the basis of expected, not necessarily actual, cash
receipts and payments. Expected cash receipts from the delivery of products or services
are recognized as revenues, and expected cash outflows associated with these
revenues are recognized as expenses.
3-1
Copyright 2012 Cengage Learning. All Rights Reserved. May not be copied, scanned, or duplicated, in whole or in part. Due to electronic rights, some third party content may be suppressed from the eBook and/or eChapter(s).
Editorial review has deemed that any suppressed content does not materially affect the overall learning experience. Cengage Learning reserves the right to remove additional content at any time if subsequent rights restrictions require it.
While there are many rules and conventions that govern the preparation of a firm’s
financial statements, there are only a few conceptual building blocks that form the foun-
dation of accrual accounting. The following definitions are critical to the income state-
ment, which summarizes a firm’s revenues and expenses:
2
• Revenues are economic resources earned during a time period. Revenue recogni-
tion is governed by the realization principle, which establishes that revenues should
be recognized when (a) the firm has provided all, or substantially all, the goods or
services to be delivered to the customer and (b) the customer has paid cash or is
expected to pay cash with a reasonable degree of certainty.
3
• Expenses are economic resources used up in a time period. Expense recognition is
governed by the matching and the conservatism principles. Under these principles,
expenses are resource costs (a) directly associated with revenues recognized in the
same period, (b) associated with benefits that are consumed in this time period, or
(c) whose future benefits are not reasonably certain.
• Profit is the difference between a firm’s revenues and expenses in a time period.
4
The following fundamental relationship is therefore reflected in a firm’s income
statement:
Profit = Revenues − Expenses
In contrast, the balance sheet is a summary at one point in time. The principles that
define a firm’s assets, liabilities, and equity are as follows:
• Assets are economic resources owned by a firm that are (a) likely to produce future
economic benefits and (b) measurable with a reasonable degree of certainty.
• Liabilities are economic obligations of a firm arising from benefits received in the
past that (a) are required to be met with a reasonable degree of certainty and
(b) whose timing is reasonably well defined.
• Equity is the difference between a firm’s assets and its liabilities.
The definitions of assets, liabilities, and equity lead to the fundamental relationship
that governs a firm’s balance sheet:
Assets = Liabilities + Equity
Delegatio n of Reporting t o Ma nagement
While the basic definitions of the elements of a firm’s financial statements are simple, their
application in practice often involves complex judgments. For example, how should reven-
ues be recognized when a firm sells land to customers and also provides customer financ-
ing? If revenue is recognized before cash is collected, how should potential defaults be
estimated? Are the outlays associated with research and development activities, whose pay-
offs are uncertain, assets or expenses when incurred? Are contractual commitments under
lease arrangements or post-retirement plans liabilities? If so, how should they be valued?
Because corporate managers have intimate knowledge of their firms’ businesses, they
are entrusted with the primary task of making the appropriate judgments in portraying
myriad business transactions using the basic accrual accounting framework. The
accounting discretion granted to managers is potentially valuable because it allows them
to reflect inside information in reported financial statements. However, since investors
view profits as a measure of managers’ performance, managers have an incentive to use
their accounting discretion to distort reported profits by making biased assumptions.
Further, the use of accounting numbers in contracts between the firm and outsiders pro-
vides a motivation for management manipulation of accounting numbers.
3-2
PART 2 • Business Analysis and Valuation Tools
Copyright 2012 Cengage Learning. All Rights Reserved. May not be copied, scanned, or duplicated, in whole or in part. Due to electronic rights, some third party content may be suppressed from the eBook and/or eChapter(s).
Editorial review has deemed that any suppressed content does not materially affect the overall learning experience. Cengage Learning reserves the right to remove additional content at any time if subsequent rights restrictions require it.

This earnings management distorts financial accounting data, making it less valuable
to external financial statement users. Therefore, the delegation of financial reporting
decisions to managers has both costs and benefits. Accounting rules and auditing are
mechanisms designed to reduce the cost and preserve the benefit of delegating financial
reporting to corporate managers. The Sarbanes-Oxley Act increased the involvement of
the audit committee of a firm’s board of directors and required the personal certification
of the CEO and CFO as to the appropriateness of financial reports as a way of reducing
the costs of this delegation. The legal system is used to adjudicate disputes among man-
agers, auditors, and investors.
Generally Accepted Accounting Principles
Given that it is difficult for outside investors to determine whether managers have used
accounting flexibility to signal their proprietary information or merely to disguise reality,
a number of accounting conventions have evolved to mitigate the problem. For example,
in most countries financial statements are prepared using the historical cost convention,
where assets and liabilities are recorded at historical exchange prices rather than fair
values, replacement values, or values in use. This reduces managers’ ability to overstate
the value of the assets that they have acquired or developed, or to understate the value of
liabilities. Of course, historical cost also limits the information that is available to inves-
tors about the potential of the firm’s assets, since past exchange prices are usually differ-
ent from fair values or values in use. In recognition of this, the world’s major standard
setters have increasingly required the use of fair value accounting in their respective
standards.
INTRODUCTION OF FAIR VALUE ACCOUNTING
U.S. and international accounting standards require firms to use fair value accounting
(FVA) to value certain financial assets. The rules specify which types of assets are to be
recorded at fair values, and which are to be valued at cost. They also define how to
record the unrealized gains and losses from using fair values, and how to measure fair
values.
Under the rules, marketable securities and derivatives are required to be valued at
their fair value. Financial instruments (such as debt securities) are reported at fair value
if management anticipates that they will be traded in the future, or if they are potentially
available to be traded. In contrast, debt instruments that managers anticipate holding to
maturity are reported at cost.
The standards also specify whether gains or losses from revisions in fair values should
appear in the income statement or be directly included in equity. Unrealized gains and
losses on marketable securities, traded financial instruments, and derivatives that are not
held for hedging purposes are included in net income. For financial instruments that are
available for sale or derivatives held as part of a hedging arrangement, any unrealized
gains or losses go directly to owners’ equity and do not flow through the income
statement.
Finally, standard setters have recognized that reporting financial assets at their fair
values involves varying levels of subjectivity depending on the liquidity and transparency
of the asset market in question. The standards have established a hierarchy for measur-
ing the fair value of financial assets. Instruments that are traded in a liquid and orderly
market are called Level One instruments and are valued using the latest market prices.
Financial assets that are not traded in liquid markets, but which can be valued using
Overview of Accounting Analysis 3-3
Copyright 2012 Cengage Learning. All Rights Reserved. May not be copied, scanned, or duplicated, in whole or in part. Due to electronic rights, some third party content may be suppressed from the eBook and/or eChapter(s).
Editorial review has deemed that any suppressed content does not materially affect the overall learning experience. Cengage Learning reserves the right to remove additional content at any time if subsequent rights restrictions require it.

financial models whose inputs are available from liquid markets, are called Level Two
assets and are valued using the financial model and the market input prices. Finally,
some instruments can be valued using financial models but require managers to estimate
the inputs. These are termed Level Three assets, and require considerable management
judgment to estimate their fair values.
The financial crisis of 2008 demonstrated the challenges in estimating fair values of
financial instruments when markets for the securities in question are highly illiquid.
Such was the case for mortgage-backed securities, which were claims on the cash flows
from residential mortgage loans created through a process known as securitization.
Many of these securities were owned by financial institutions throughout the world. As
uncertainty about mortgage loan default rates and declines in the value of the underlying
properties rose, the market for mortgage-backed securities became highly illiquid and
there was wide variation in their values reported on the balance sheets of the banks
and investment firms that owned the securities.
Accounting standards and rules also limit management’s ability to misuse accounting
judgment by regulating how particular types of transactions are recorded. For example,
accounting standards for leases stipulate how firms are to record contractual arrange-
ments to lease resources. Similarly, pension and other post-employment benefit stan-
dards describe how firms are to record commitments to provide pensions and other
retirement benefits for employees. These accounting standards, which are designed to
convey quantitative information on a firm’s performance, are complemented by a set of
disclosure principles. These disclosure principles guide the amount and kinds of infor-
mation that is disclosed and require a firm to provide qualitative information related to
the assumptions, policies, and uncertainties that underlie the quantitative data presented.
In the United States, the Securities and Exchange Commission (SEC) has the legal
authority to set accounting standards. The SEC typically relies on private sector account-
ing bodies to undertake this task. Since 1973 accounting standards in the United States
have been set by the Financial Accounting Standards Board (FASB); Generally Accepted
Accounting Principles (GAAP) denote the standards, conventions, rules, and procedures
that FASB requires firms to apply in preparing their financial statements.
Similar private or public sector accounting standard-setting bodies have developed
locally based accounting standards in many other countries. More recently, the Interna-
tional Accounting Standards Board (IASB) and its predecessor, the International
Accounting Standards Committee (IASC), have promoted worldwide accounting stan-
dards. Those standards, the International Financial Reporting Standards (IFRS), are
gaining increasing acceptance worldwide.
U.S. GAAP / IFRS CONVERGENCE
5
Local accounting standards arose independently over time in major capital markets with
little regard for, or need of, cross-border consistency. The concept of convergence of
these diverse standards first arose in the mid-twentieth century as post World War II
economic integration and increased international capital flows began to create demand
for greater comparability of financial information.
The IASC (International Accounting Standards Committee), established in 1973, was
the first international standards setting body and issued its first standard in 1974. The
IASC was reorganized in 2001 and renamed the IASB (International Accounting
3-4
PART 2 • Business Analysis and Valuation Tools
Copyright 2012 Cengage Learning. All Rights Reserved. May not be copied, scanned, or duplicated, in whole or in part. Due to electronic rights, some third party content may be suppressed from the eBook and/or eChapter(s).
Editorial review has deemed that any suppressed content does not materially affect the overall learning experience. Cengage Learning reserves the right to remove additional content at any time if subsequent rights restrictions require it.

Standards Board). Its goal is to “develop, in the public interest, a single set of high qual-
ity global accounting standards.”
6
By 2011, IASB standards, known as IFRS (Interna-
tional Financial Reporting Standards) were required or permitted in almost 120
countries. In addition, by 2011 all remaining major economies had established timelines
and programs to converge with or adopt IFRS.
7
In 2002, the FASB in the United States and the IASB issued “The Norwalk Agree-
ment” in which the two standard setters committed to the convergence of U.S. GAAP
and IFRS. The agreement described a shared goal of developing accounting standards
that could be used for both domestic and cross-border financial reporting and that
would reduce complexity and the cost of business in global capital markets. Since then,
there have been a number of important steps toward convergence. In 2007, the SEC
eliminated the requirement that foreign issuers that used IFRS and listed in the United
States provide financial statements reconciled to U.S. GAAP. During the same year,
FASB and IASB completed their first major joint project and issued converged standards
on business combinations. Subsequent discussions among the FASB, the IASB, and the
SEC have reaffirmed a commitment to standard convergence and set 2011 as the horizon
to determine whether it makes sense for U.S. companies to use IFRS.
In Chapter Four we discuss some of the remaining material differences between U.S.
GAAP and IFRS, and how to compare the performance of companies using the two
approaches.
Uniform accounting standards attempt to reduce managers’ ability to record similar
economic transactions in dissimilar ways, either over time or across firms. Thus they cre-
ate a uniform accounting language and increase the credibility of financial statements by
limiting a firm’s ability to distort them. Increased uniformity from accounting standards,
however, comes at the expense of reduced flexibility for managers to reflect genuine
business differences in a firm’s accounting decisions. Rigid accounting standards work
best for economic transactions whose accounting treatment is not predicated on man-
agers’ proprietary information. However, when there is significant business judgment
involved in assessing a transaction’s economic consequences, rigid standards are likely
to be dysfunctional for some companies because they prevent managers from using
their superior knowledge of the business to determine how best to report the economics
of key business events. Further, if accounting standards are too rigid, they may induce
managers to expend economic resources to restructure business transactions to achieve
a desired accounting result or to forgo transactions that may be difficult to report on.
Exte rnal Auditing
External auditing, broadly defined as a verification of the integrity of the reported finan-
cial statements by someone other than the preparer, ensures that managers use account-
ing rules and conventions consistently over time, and that their accounting estimates
are reasonable. In all public markets, listed companies are required to have their
financial statements audited by an independent public accountant. In the United States,
the standards and procedures to be followed by independent auditors are known as
Generally Accepted Auditing Standards (GAAS). Under the Sarbanes-Oxley Act, the
responsibility for overseeing audit firms and for ensuring that they are complying with
GAAS resides with the Public Company Accounting Oversight Board (PCAOB), a regu-
latory body established by the Act. All public accounting firms are required to register
with the PCAOB, which has the power to inspect and investigate audit work, and—if
needed—to discipline auditors.
Overview of Accounting Analysis 3-5
Copyright 2012 Cengage Learning. All Rights Reserved. May not be copied, scanned, or duplicated, in whole or in part. Due to electronic rights, some third party content may be suppressed from the eBook and/or eChapter(s).
Editorial review has deemed that any suppressed content does not materially affect the overall learning experience. Cengage Learning reserves the right to remove additional content at any time if subsequent rights restrictions require it.
The Sarbanes-Oxley Act also specifies the relationship between a company and its
external auditor, requiring auditors to report to, and be overseen by, a company’s audit
committee rather than its management. In addition, the Act prohibits public accounting
firms from providing non-audit services, such as bookkeeping, information systems
design and implementation, valuation and a range of other consulting services, to a com-
pany that it audits. Finally, the Act requires that audit firms rotate the lead and review-
ing audit partner every five years.
While auditors issue an opinion on published financial statements, it is important to
remember that the primary responsibility for the statements still rests with corporate
managers. Auditing improves the quality and credibility of accounting data by limiting
a firm’s ability to distort financial statements to suit its own purposes. However, as
audit failures at companies such as Enron and WorldCom, and more recently lawsuits
that allege audit failures at companies such as AIG, Bear Stearns, Countrywide Financial
Corp, Lehman Brothers, Washington Mutual,
8
New Century Financial,
9
and others sug-
gest, auditing is imperfect. Audits cannot review all of a firm’s transactions. They can
also fail because of lapses in quality or in judgment by auditors who fail to challenge
management for fear of losing future business.
Third-party auditing may also reduce the quality of financial reporting because it can
constrain the kind of accounting rules and conventions that evolve over time. For exam-
ple, the FASB considers the views of auditors in the standard-setting process. Auditors
are likely to argue against accounting standards that produce numbers that are difficult
to audit, even if the proposed rules provide relevant information for investors.
Legal Liability
The legal environment in which accounting disputes among managers, auditors, and inves-
tors are adjudicated can also have a significant effect on the quality of reported numbers.
The threat of lawsuits and penalties has the beneficial effect of improving the accuracy of
disclosure. However, the potential for significant legal liability might also discourage man-
agers and auditors from supporting accounting proposals where management and auditor
judgment and increased complexity or nuance come into play. In addition, the Sarbanes-
Oxley Act enacted in 2002 has provisions that potentially increase this risk: managers must
personally certify financial results, and auditors are subject to enhanced oversight and
potential penalties from the PCAOB (Public Company Accounting Oversight Board) cre-
ated by SOX. Also, as can be seen from the numerous lawsuits filed against auditing firms
and management in the wake of the global financial crisis, the possibility of legal liability
represents a very significant and real risk to both company managers and audit firms.
FACTORS INFLUENCING ACCOUNTING QUALITY
Because the mechanisms that limit managers’ ability to distort accounting data them-
selves add noise, it is not optimal to use accounting regulation to completely eliminate
managerial flexibility. Therefore, real-world accounting systems leave considerable room
for managers to influence financial statement data. The net result is that information in
corporate financial reports is noisy and biased, even in the presence of accounting regu-
lation and external auditing.
10
The objective of accounting analysis is to evaluate the
degree to which a firm’s accounting captures its underlying business reality and to
“undo” any accounting distortions. When potential distortions are large, accounting
analysis can add considerable value.
11
There are three potential sources of noise and bias in accounting data: (1) noise intro-
duced by rigidity in accounting rules, (2) random forecast errors, and (3) systematic
3-6
PART 2 • Business Analysis and Valuation Tools
Copyright 2012 Cengage Learning. All Rights Reserved. May not be copied, scanned, or duplicated, in whole or in part. Due to electronic rights, some third party content may be suppressed from the eBook and/or eChapter(s).
Editorial review has deemed that any suppressed content does not materially affect the overall learning experience. Cengage Learning reserves the right to remove additional content at any time if subsequent rights restrictions require it.
reporting choices made by corporate managers to achieve specific objectives. Each of
these factors is discussed below.
Noise from Accounting Rules
Accounting rules introduce noise and bias because it is often difficult to restrict manage-
ment discretion without reducing the information content of accounting data. For exam-
ple, the Statement of Financial Accounting Standards (SFAS) No. 2 issued by the FASB
requires firms to expense research and development outlays when they are incurred.
Clearly, some of these expenditures have future value while others do not. However,
because SFAS 2 does not allow firms to distinguish between the two types of expendi-
tures, it leads to a systematic distortion of reported accounting numbers. Interestingly,
the IASB allows firms to capitalize development expenditures, which are presumed to
have future economic value, and like FASB requires research outlays to be expensed
(IAS 38). Hence, broadly speaking, the degree of distortion introduced by accounting
standards depends on how well uniform accounting standards capture the nature of a
firm’s transactions.
Forecast Errors
Another source of noise in accounting data arises from pure forecast error, because man-
agers cannot predict future consequences of current transactions perfectly. For example,
when a firm sells products on credit, accrual accounting requires managers to make a
judgment about the probability of collecting payments from customers. If payments are
deemed “reasonably certain,” the firm treats the transactions as sales, creating accounts
receivable on its balance sheet. Managers then make an estimate of the proportion of
receivables that will not be collected. Because managers do not have perfect foresight,
actual customer defaults are likely to be different from estimated defaults, leading to a
forecast error. The extent of errors in managers’ accounting forecasts depends on a vari-
ety of factors including the complexity of the business transactions, the predictability of
the firm’s environment, and unforeseen economy-wide changes.
Mana gers’ Accounting Choices
Corporate managers also introduce noise and bias into accounting data through their
own accounting decisions. Managers have a variety of incentives to exercise their
accounting discretion to achieve certain objectives:
12
• Accounting-based debt covenants. Managers may make accounting decisions to
meet certain contractual obligations in their debt covenants. For example, firms ’
lending agreements with banks and other debt holders require them to meet cove-
nants related to interest coverage, working capital ratios, and net worth, all defined
in terms of accounting numbers. Violation of these agreements may be costly
because lenders can trigger penalties including demanding immediate repayment
of their loans. Managers of firms close to violating debt covenants have an incen-
tive to select accounting policies and estimates to reduce the probability of cove-
nant violation. The debt covenant motivation for managers’ accounting decisions
has been analyzed by a number of accounting researchers.
13
• Management compensation. Another motivation for managers’ accounting choice
comes from the fact that their compensation and job security are often tied to
reported profits. For example, many top managers receive bonus compensation if
they exceed certain pre-specified profit targets. This provides motivation for man-
agers to choose accounting policies and estimates to maximize their expected
Overview of Accounting Analysis 3-7
Copyright 2012 Cengage Learning. All Rights Reserved. May not be copied, scanned, or duplicated, in whole or in part. Due to electronic rights, some third party content may be suppressed from the eBook and/or eChapter(s).
Editorial review has deemed that any suppressed content does not materially affect the overall learning experience. Cengage Learning reserves the right to remove additional content at any time if subsequent rights restrictions require it.
compensation.
14
Stock option awards can also potentially induce managers to
manage earnings. Options provide managers with incentives to understate earnings
prior to option grants to lower the firm’s current stock price and hence the option
exercise price, and to inflate earnings and stock prices at the time of option
exercise.
15
• Corporate control contests. In corporate control contests, including hostile take-
overs and proxy fights, competing management groups attempt to win over the
firm’s shareholders. Accounting numbers are used extensively in debating man-
agers’ performance in these contests. Therefore, managers may make accounting
decisions to influence investor perceptions in corporate control contests.
16
• Tax considerations. Managers may also make reporting choices to trade off
between financial reporting and tax considerations. For example, U.S. firms are
required to use LIFO inventory accounting for shareholder reporting in order to
also use it for tax reporting. Under LIFO, when prices are rising, firms report
lower profits, thereby reducing tax payments. Some firms may forgo the tax reduc-
tion in order to report higher profits in their financial statements.
17
• Regulatory considerations. Since accounting numbers are used by regulators in a
variety of contexts, managers of some firms may make accounting decisions to
influence regulatory outcomes. Examples of regulatory situations where accounting
numbers are used include antitrust actions, import tariffs to protect domestic
industries, and tax policies.
18
• Capital market considerations. Managers may make accounting decisions to influ-
ence the perceptions of capital markets. When there are information asymmetries
between managers and outsiders, this strategy may succeed in influencing investor
perceptions, at least temporarily.
19
• Stakeholder considerations. Managers may also make accounting decisions to influ-
ence the perception of important stakeholders in the firm. For example, since labor
unions can use healthy profits as a basis for demanding wage increases, managers
may make accounting decisions to decrease income when they are facing union
contract negotiations. In countries like Germany, where labor unions are strong,
these considerations appear to play an important role in firms’ accounting policy.
Other important stakeholders that firms may wish to influence through their
financial reports include suppliers and customers.
20
• Competitive considerations. The dynamics of competition in an industry might also
influence a firm’s reporting choices. For example, a firm’s segment disclosure deci-
sions may be influenced by its concern that disaggregated disclosure may help
competitors in their business decisions. Similarly, firms may not disclose data on
their margins by product line for fear of giving away proprietary information.
Finally, firms may discourage new entrants by making income-decreasing account-
ing choices.
In addition to accounting policy choices and estimates, the level of disclosure is also
an important determinant of a firm’s accounting quality. Corporate managers can choose
disclosure policies that make it more or less costly for external users of financial reports
to understand the true economic picture of their businesses. Accounting regulations usu-
ally prescribe minimum disclosure requirements, but they do not restrict managers from
voluntarily providing additional disclosures. Managers can use various parts of the finan-
cial reports, including the Letter to the Shareholders, Management Discussion and Anal-
ysis, and footnotes, to describe the company’s strategy, its accounting policies, and its
current performance. There is wide variation across firms in how managers use their dis-
closure flexibility.
21
3-8 PART 2 • Business Analysis and Valuation Tools
Copyright 2012 Cengage Learning. All Rights Reserved. May not be copied, scanned, or duplicated, in whole or in part. Due to electronic rights, some third party content may be suppressed from the eBook and/or eChapter(s).
Editorial review has deemed that any suppressed content does not materially affect the overall learning experience. Cengage Learning reserves the right to remove additional content at any time if subsequent rights restrictions require it.
STEPS IN PERFOR MING ACCOUNTING ANAL YSIS
In this section we discuss a series of steps that an analyst can follow to evaluate a firm’s
accounting quality.
Step 1: Identify Principal Accounting Policies
As discussed in the chapter on business strategy analysis, a firm ’s industry characteristics
and its own competitive strategy determine its key success factors and risks. One of the
goals of financial statement analysis is to evaluate how well these success factors and
risks are being managed by the firm. In accounting analysis, therefore, the analyst should
identify and evaluate the policies and the estimates the firm uses to measure its critical
factors and risks.
Key success factors in the banking industry include interest rate and credit risk manage-
ment; in the retail industry, inventory management is important; and for a manufacturer
competing on product quality and innovation, research and development, and product
defects after sale are major areas of concern. A significant success factor in the leasing
business is to make accurate forecasts of residual values of the leased equipment at the
end of the lease terms. In each of these cases, the analyst has to identify the accounting
measures the firm uses to capture these business constructs, the policies that determine
how the measures are implemented, and the important estimates embedded in these poli-
cies. For example, the accounting measure a bank uses to capture credit risk is its loan loss
reserves, and the accounting measure that captures product quality for a manufacturer is
its warranty expenses and reserves. For a firm in the equipment leasing industry, one of
the most important accounting policies is the way residual values are recorded. Residual
values influence the company’s reported profits and its asset base. If residual values are
overestimated, the firm runs the risk of having to take large write-offs in the future.
Step 2: Assess Accountin g Fl exibility
Not all firms have equal flexibility in choosing their accounting policies and estimates.
Some firms’ accounting choice is severely constrained by accounting standards and con-
ventions. For example, even though research and development is a key success factor for
biotechnology companies, managers in U.S. companies have no accounting discretion in
reporting on this activity. Similarly, even though marketing and brand building are
essential to the success of consumer goods firms, they are required to expense all their
marketing outlays. In contrast, managing credit risk is one of the critical success factors
for banks, and bank managers have the freedom to estimate expected defaults on their
loans. Similarly, software developers have the flexibility to decide at what points in their
development cycles the outlays can be capitalized.
If managers have little flexibility in choosing accounting policies and estimates related
to their key success factors, accounting data are likely to be less informative for under-
standing the firm’s economics. Such is likely to be the case for U.S. biotechnology firms
that are required to expense research and development outlays. In contrast, if managers
have flexibility in choosing the policies and estimates (as in the case for banks in report-
ing on credit risk), accounting numbers have the potential to be informative, depending
upon how managers exercise this flexibility.
Regardless of the degree of accounting flexibility a firm’s managers have in measuring
their key success factors and risks, they have some flexibility with respect to other
accounting policies. For example, firms have to make choices with respect to deprecia-
tion policy (straight-line or accelerated methods), inventory accounting policy (LIFO for
U.S. firms, FIFO, or Average Cost), and policies regarding the estimation of pension and
Overview of Accounting Analysis 3-9
Copyright 2012 Cengage Learning. All Rights Reserved. May not be copied, scanned, or duplicated, in whole or in part. Due to electronic rights, some third party content may be suppressed from the eBook and/or eChapter(s).
Editorial review has deemed that any suppressed content does not materially affect the overall learning experience. Cengage Learning reserves the right to remove additional content at any time if subsequent rights restrictions require it.
other post-employment benefits (expected return on plan assets, discount rate for liabili-
ties, and rate of increase in wages and health care costs). Since all these policy choices
can have a significant impact on the reported performance of a firm, they offer an
opportunity for the firm to manage its reported numbers and should be the focus of
analysis in this step.
Step 3: Evaluate Accounting Strategy
When managers have accounting flexibility, they can use it either to communicate their
firm’s economic situation or to hide true performance. Some of the questions one could
ask in examining how managers exercise their accounting flexibility include the following:
• How do the firm’s accounting policies compare to the norms in the industry? If
they are dissimilar, is it because the firm’s competitive strategy is unique? For
example, consider a firm that reports a lower warranty allowance than the industry
average. One explanation is that the firm competes on the basis of high quality and
has invested considerable resources to reduce the rate of product failure. An alter-
native explanation is that the firm is merely understating its warranty liabilities.
• Do managers face strong incentives to use accounting discretion to manage earn-
ings? For example, is the firm close to violating bond covenants? Or are the man-
agers having difficulty meeting accounting-based bonus targets? Does management
own significant stock? Is the firm in the middle of a proxy fight or union negotia-
tions? Managers may also make accounting decisions to reduce tax payments or to
influence the perceptions of the firm ’s competitors.
• Has the firm changed any of its policies or estimates? What is the justification?
What is the impact of these changes? For example, if warranty expenses decreased,
is it because the firm made significant investments to improve quality?
• Have the company’s policies and estimates been realistic in the past? For example,
firms may overstate their revenues and understate their expenses during the year
by manipulating quarterly reports, which are not subject to a full-blown external
audit. However, the auditing process at the end of the fiscal year forces such com-
panies to make large fourth-quarter adjustments, providing an opportunity for the
analyst to assess the quality of the firm’s interim reporting. Similarly, firms that
depreciate fixed assets too slowly will be forced to take a large write-off later. A
history of write-offs may be, therefore, a sign of prior earnings management.
• Does the firm structure any significant business transactions so that it can achieve
certain accounting objectives? For example, under current accounting standards,
leasing firms can alter lease terms (the length of the lease or the bargain purchase
option at the end of the lease term) so that the transactions qualify as sales-type
leases for the lessors. Lehman Brothers used repurchase agreements called “Repo
105” transactions to window-dress its balance sheet. Under these agreements Leh-
man “sold” short-term loans immediately prior to its year-end and used the pro-
ceeds to pay down debt, making it appear less leveraged. After year-end, it
borrowed cash and repurchased the loans.
22
Such behaviors suggest that the
firm’s managers are willing to expend economic resources merely to achieve an
accounting objective.
Step 4: Evaluate the Quality of Disclosure
Managers can make it more or less easy for an analyst to assess the firm’s accounting
quality and to use its financial statements to understand business reality. While account-
ing rules require a certain amount of minimum disclosure, managers have considerable
3-10
PART 2 • Business Analysis and Valuation Tools
Copyright 2012 Cengage Learning. All Rights Reserved. May not be copied, scanned, or duplicated, in whole or in part. Due to electronic rights, some third party content may be suppressed from the eBook and/or eChapter(s).
Editorial review has deemed that any suppressed content does not materially affect the overall learning experience. Cengage Learning reserves the right to remove additional content at any time if subsequent rights restrictions require it.
choice in the matter. Disclosure quality, therefore, is an important dimension of a firm’s
accounting quality.
In assessing a firm’s disclosure quality, an analyst could ask the following questions:
• Does the company provide adequate disclosures to assess the firm’s business strat-
egy and its economic consequences? For example, some firms use the Letter to the
Shareholders in their annual report to clearly lay out the firm’s industry condi-
tions, its competitive position, and management’s plans for the future. Others use
the letter to puff up the firm ’s financial performance and gloss over any competi-
tive difficulties the firm might be facing.
• Do the footnotes adequately explain the key accounting policies and assumptions
and their logic? For example, if a firm’s revenue and expense recognition policies
differ from industry norms, the firm can explain its choices in a footnote. Simi-
larly, when there are significant changes in a firm’s policies, footnotes can be
used to disclose the reasons.
• Does the firm adequately explain its current performance? The Management Dis-
cussion and Analysis (MD&A) section of the annual report provides an opportu-
nity to help analysts understand the reasons behind a firm’s performance changes.
Some firms use this section to link financial performance to business conditions.
For example, if profit margins went down in a period, was it because of price com-
petition or because of increases in manufacturing costs? If the selling and general
administrative expenses went up, was it because the firm is investing in a differen-
tiation strategy, or because unproductive overhead expenses were creeping up?
Based on a review of the Fortune 500 companies, in 2003 the SEC released a circu-
lar indicating that companies should provide more discussion in MD&A about
their critical accounting policies.
23
Companies were encouraged to disclose the
most difficult and judgmental estimates and accounting policies they used, among
other guidance.
• If accounting rules and conventions restrict the firm from measuring its key suc-
cess factors appropriately, does the firm provide adequate additional disclosure to
help outsiders understand how these factors are being managed? For example, if a
firm invests in product quality and customer service, accounting rules do not allow
the management to capitalize these outlays, even when the future benefits are cer-
tain. The firm’s MD&A can be used to highlight how these outlays are being man-
aged and their performance consequences. For example, the firm can disclose
physical indexes of defect rates and customer satisfaction so that outsiders can
assess the progress being made in these areas and the future cash flow conse-
quences of these actions.
• If a firm is in multiple business segments, what is the quality of segment disclo-
sure? Some firms provide excellent discussion of their performance by product seg-
ments and geographic segments. Others lump many different businesses into one
broad segment. The level of competition in an industry and management’s willing-
ness to share desegregated performance data influence a firm’s quality of segment
disclosure.
• How forthcoming is the management with respect to bad news? A firm’s disclosure
quality is most clearly revealed by the way management deals with bad news. Does
it adequately explain the reasons for poor performance? Does the company clearly
articulate its strategy, if any, to address the company’s performance problems?
• How good is the firm’s investor relations program? Does the firm provide fact
books with detailed data on the firm’s business and performance? Is management
accessible to analysts?
Overview of Accounting Analysis 3-11
Copyright 2012 Cengage Learning. All Rights Reserved. May not be copied, scanned, or duplicated, in whole or in part. Due to electronic rights, some third party content may be suppressed from the eBook and/or eChapter(s).
Editorial review has deemed that any suppressed content does not materially affect the overall learning experience. Cengage Learning reserves the right to remove additional content at any time if subsequent rights restrictions require it.
Step 5: Identify Potential Red Flags
In addition to the preceding steps, a common approach to accounting quality analysis is
to look for “red flags ” pointing to questionable accounting. These indicators suggest that
the analyst should examine certain items more closely or gather more information on
them. Some common red flags are the following:
• Unexplained changes in accounting, especially when performance is poor. This may
suggest that managers are using their accounting discretion to “dress up” their
financial statements.
24
• Unexplained transactions that boost profits. For example, firms might undertake
balance sheet transactions, such as asset sales or debt for equity swaps, to realize
gains in periods when operating performance is poor.
25
• Unusual increases in accounts receivable in relation to sales increases. This may
suggest that the company is relaxing its credit policies or artificially loading up its
distribution channels to record revenues during the current period, a practice com-
monly referred to as “channel stuffing.” If credit policies are relaxed unduly, the
firm may face receivable write-offs in subsequent periods as a result of customer
defaults. If the firm accelerates shipments to its distributors, it may face either
product returns or reduced shipments in subsequent periods.
• Unusual increases in inventories in relation to sales increases. If the inventory
build-up is due to an increase in finished goods inventory, it could be a sign that
demand for the firm’s products is slowing down, suggesting that the firm may be
forced to cut prices (and hence earn lower margins) or write down its inventory. A
build-up in work-in-progress inventory tends to be good news on average, proba-
bly signaling that managers expect an increase in sales. If the build-up is in raw
materials, it could suggest manufacturing or procurement inefficiencies, leading to
an increase in cost of goods sold (and hence lower margins).
26
• An increasing gap between a firm’s reported income and its cash flow from operating
activities. While it is legitimate for accrual accounting numbers to differ from cash
flows, there is usually a steady relationship between the two if the company’s
accounting policies remain the same. Therefore, any change in the relationship
between reported profits and operating cash flows might indicate subtle changes
in the firm’s accrual estimates. For example, a firm undertaking large construction
contracts might use the percentage-of-completion method to record revenues.
While earnings and operating cash flows are likely to differ for such a firm, they
should bear a steady relationship to each other. Now suppose the firm increases
revenues in a period through an aggressive application of the percentage-
of-completion method. Then its earnings will go up, but its cash flow remains
unaffected. This change in the firm’s accounting quality will be manifested by a
change in the relationship between the firm’s earnings and cash flows.
• An increasing gap between a firm’s reported income and its tax income. Once again,
it is quite legitimate for a firm to follow different accounting policies for financial
reporting and tax accounting as long as the tax law allows it.
27
However, the rela-
tionship between a firm’s book and tax accounting is likely to remain stable over
time unless there are significant changes in tax rules or accounting standards.
Thus, an increasing gap between a firm’s reported income and its tax income
may indicate that financial reporting to shareholders has become more aggressive.
For example, warranty expenses are estimated on an accrual basis for financial
reporting, but they are recorded on a cash basis for tax reporting. Unless there is
a big change in the firm ’s product quality, these two numbers bear a consistent
relationship to each other. Therefore, a change in this relationship can be an
3-12
PART 2 • Business Analysis and Valuation Tools
Copyright 2012 Cengage Learning. All Rights Reserved. May not be copied, scanned, or duplicated, in whole or in part. Due to electronic rights, some third party content may be suppressed from the eBook and/or eChapter(s).
Editorial review has deemed that any suppressed content does not materially affect the overall learning experience. Cengage Learning reserves the right to remove additional content at any time if subsequent rights restrictions require it.
indication either that product quality is changing significantly or that financial
reporting estimates are changing.
• A tendency to use financing mechanisms such as research and development partner-
ships, special-purpose entities, and the sale of receivables with recourse. While these
arrangements may have a sound business logic, they can also provide management
with an opportunity to understate the firm’s liabilities and/or overstate its assets.
28
• Unexpected large asset write-offs. This may suggest that management is slow to
incorporate changing business circumstances into its accounting estimates. Asset
write-offs may also be a result of unexpected changes in business circumstances.
29
• Large fourth-quarter adjustments. A firm’s annual reports are audited by the exter-
nal auditors, but its interim financial statements are usually only reviewed. If a
firm’s management is reluctant to make appropriate accounting estimates (such
as provisions for uncollectible receivables) in its interim statements, it could be
forced to make adjustments at the end of the year as a result of pressure from its
external auditors. A consistent pattern of fourth-quarter adjustments, therefore,
may indicate aggressive management of interim reporting.
30
• Qualified audit opinions or changes in independent auditors that are not well justi-
fied. These may indicate a firm’s aggressive attitude or a tendency to “opinion
shop.”
• Related-party transactions or transactions between related entities. These transac-
tions may lack the objectivity of the marketplace, and managers’ accounting esti-
mates related to these transactions are likely to be more subjective and potentially
self-serving.
31
• Unexplained increases in contingencies and off-balance sheet transactions. These
types of transactions could signify an attempt by management to window-dress
the firm’s balance sheet.
While the preceding list provides a number of red flags for potentially poor accounting
quality, it is important to do further analysis before reaching final conclusions. Each of the
red flags has multiple interpretations; some interpretations are based on sound business
reasons, and others indicate questionable accounting. It is, therefore, best to use the red
flag analysis as a starting point for further probing, not as an end point in itself.
32
As we discussed in the previous chapter, it is important to also maintain a broad
strategic view of the company’s markets, customers, suppliers, and overall macroeco-
nomic trends that may be influencing the company’s performance. Keeping this per-
spective while identifying red flags in the company’s financial statements can help to
direct the analyst to areas of potential concern and provide an important context for
further analysis.
Step 6: Und o Accounting Distortions
If the accounting analysis suggests that the firm’s reported numbers are misleading, ana-
lysts should attempt to restate the reported numbers to reduce the distortion to the
extent possible. It is, of course, virtually impossible to perfectly undo the distortion
using outside information alone. However, some progress can be made in this direction
by using the cash flow statement and the financial statement footnotes.
A firm’s cash flow statement provides a reconciliation of its performance based on
accrual accounting and cash accounting. If the analyst is unsure of the quality of the
firm’s accrual accounting, the cash flow statement provides an alternative benchmark of
its performance. The cash flow statement also provides information on how individual
line items in the income statement diverge from the underlying cash flows. For example,
if an analyst is concerned that the firm is aggressively capitalizing certain costs that
Overview of Accounting Analysis 3-13
Copyright 2012 Cengage Learning. All Rights Reserved. May not be copied, scanned, or duplicated, in whole or in part. Due to electronic rights, some third party content may be suppressed from the eBook and/or eChapter(s).
Editorial review has deemed that any suppressed content does not materially affect the overall learning experience. Cengage Learning reserves the right to remove additional content at any time if subsequent rights restrictions require it.
should be expensed, the information in the cash flow statement provides a basis to make
the necessary adjustment.
Financial statement footnotes also provide information that is potentially useful in
restating reported accounting numbers. For example, when a firm changes its accounting
policies, it provides a footnote indicating the effect of that change if it is material. Simi-
larly, some firms provide information on the details of accrual estimates such as the
allowance for bad debts. The tax footnote usually provides information on the differences
between a firm’s accounting policies for shareholder reporting and tax reporting. Since
tax reporting is often more conservative than shareholder reporting, the information in
the tax footnote can be used to estimate what the earnings reported to shareholders
would be under more conservative policies.
In Chapter 4, we show how to make accounting adjustments for some of the most
common types of accounting distortions.
ACCOUNTING AN ALYSIS PITFALLS
There are several potential pitfalls and common misconceptions in accounting analysis
that an analyst should avoid.
1. Conservative Accounting Is Not “Good” Accounting
Some firms take the approach that it pays to be conservative in financial reporting and
to set aside as much as possible for contingencies. This logic is commonly used to justify
the expensing of R&D and advertising, and the rapid write-down of intangible assets. It
is also used to support large loss reserves for insurance companies, for merger expenses,
and for restructuring charges.
From the standpoint of a financial statement user, it is important to recognize that
conservative accounting is not the same as “good” accounting. Financial statement users
want to evaluate how well a firm’s accounting captures business performance in an unbi-
ased manner, and conservative accounting can be just as misleading as aggressive
accounting in this respect.
It is certainly true that it can be difficult to estimate the economic benefits from many
intangibles. However, the intangible nature of some assets does not mean that they do
not have value. Indeed, for many firms these types of assets are their most valued. For
example, the two most valuable assets for pharmaceutical companies, such as Pfizer,
Merck, and Novartis, are the research capabilities that permit them to generate new
drugs and their sales forces that enable them to sell those drugs to doctors. Yet neither
is recorded on their balance sheets. From the investors’ point of view, accountants’ reluc-
tance to value intangible assets does not diminish their importance. If they are not
included in financial statements, investors must look to alternative sources of informa-
tion on these assets.
Further, conservative accounting often provides managers with opportunities for
“income smoothing,” which may prevent analysts from recognizing poor performance
in a timely fashion. Finally, over time investors are likely to figure out which firms are
conservative and may discount their management’s disclosures and communications.
2. Not All Unusual Accounting Is Questio nable
It is easy to confuse unusual accounting with questionable accounting. While unusual
accounting choices might make a firm’s performance difficult to compare with other
firms’ performance, such an accounting choice might be justified if the company’s busi-
ness is unusual. For example, firms that follow differentiated strategies or firms that
3-14
PART 2 • Business Analysis and Valuation Tools
Copyright 2012 Cengage Learning. All Rights Reserved. May not be copied, scanned, or duplicated, in whole or in part. Due to electronic rights, some third party content may be suppressed from the eBook and/or eChapter(s).
Editorial review has deemed that any suppressed content does not materially affect the overall learning experience. Cengage Learning reserves the right to remove additional content at any time if subsequent rights restrictions require it.
structure their business in an innovative manner to take advantage of particular market
situations may make unusual accounting choices to properly reflect their business.
Therefore, it is important to evaluate a company’s accounting choices in the context of
its business strategy.
Similarly, it is important not to automatically attribute all changes in a firm’s account-
ing policies and accruals to earnings management motives.
33
Accounting changes can
also reflect changed business circumstances. For example, as already discussed, a firm
that shows unusual increases in its inventory might be preparing for a new product
introduction. Similarly, unusual increases in receivables might merely be due to changes
in a firm’s sales strategy. Unusual decreases in the allowance for uncollectible receivables
might reflect a firm’s changed customer focus. It is therefore important for an analyst to
consider all possible explanations for accounting changes and investigate them using the
qualitative information available in a firm’s financial statements.
VALUE OF ACCOUNTING DATA AND ACCOUNTING ANALYSIS
What is the value of accounting information and accounting analysis? Given the incen-
tives and opportunities for managers to affect their firms’ reported accounting numbers,
some have argued that accounting data and accounting analysis are not likely to be use-
ful for investors.
Researchers have examined the value of earnings and return on equity (ROE) by com-
paring stock returns that could be earned by a hypothetical investor who has perfect
foresight of firms’ earnings, return on equity (ROE), and cash flows for the following
year.
34
To assess the importance of earnings, the hypothetical investor is assumed to
buy stocks of firms that have earnings increases for the subsequent year and to sell stocks
of firms with subsequent earnings decreases. If this strategy is followed consistently, the
hypothetical investor would have earned over a 40-year period an average return of
37.5 percent per year. If a similar investment strategy is followed using ROE, buying
stocks with subsequent increases in ROE and selling stocks with ROE decreases, an
even higher annual return of 43 percent would be earned. In contrast, cash flow data
appear to be considerably less valuable than earnings or ROE information. Annual
returns generated from buying stocks with increased subsequent cash flows from opera-
tions and selling stocks with cash flow decreases would be only 9 percent. This suggests
that next period’s earnings and ROE performance are more relevant information for
investors than cash flow performance.
Overall, this research suggests that the institutional arrangements and conventions
created to mitigate potential misuse of accounting by managers are generally effective
in providing assurance to investors. The research indicates that investors do not view
earnings management as so pervasive as to make earnings data completely unreliable.
A number of research studies have examined whether accounting analysis is a valuable
activity. By and large, this evidence indicates that there are opportunities for superior ana-
lysts to earn positive stock returns. Studies show that companies criticized in the financial
press for misleading financial reporting subsequently suffered an average stock price drop
of 8 percent.
35
Firms where managers appeared to inflate reported earnings prior to an
equity issue and subsequently reported poor earnings performance had more negative
stock performance after the offer than firms with no apparent earnings management.
36
Finally, firms subject to SEC investigation for earnings management showed an average
stock price decline of 9 percent when the earnings management was first announced, and
they continued to have poor stock performance for up to two years.
37
These findings imply that analysts who are able to identify firms with misleading
accounting are able to create value for investors. The findings also indicate that the
Overview of Accounting Analysis 3-15
Copyright 2012 Cengage Learning. All Rights Reserved. May not be copied, scanned, or duplicated, in whole or in part. Due to electronic rights, some third party content may be suppressed from the eBook and/or eChapter(s).
Editorial review has deemed that any suppressed content does not materially affect the overall learning experience. Cengage Learning reserves the right to remove additional content at any time if subsequent rights restrictions require it.

stock market ultimately sees through earnings management. In most cases, earnings
management is eventually uncovered and the stock price responds negatively to evidence
that firms have inflated prior earnings through misleading accounting.
SUMMARY
In summary, accounting analysis is an important step in the process of analyzing corpo-
rate financial reports. The purpose of accounting analysis is to evaluate the degree to
which a firm’s accounting captures its underlying business reality. Sound accounting
analysis improves the reliability of conclusions from financial analysis, the next step in
financial statement analysis.
There are six principal steps in accounting analysis. The analyst begins by identifying
the key accounting policies and estimates given the firm’s industry and its business strat-
egy. The second step is to evaluate the degree of flexibility available to managers given
the accounting rules and conventions. Next, the analyst evaluates how managers exercise
their accounting flexibility and the likely motivations behind managers ’ accounting strat-
egy. The fourth step involves assessing the depth and quality of a firm’s disclosures. The
analyst should next identify any red flags, indicating a need for further investigation. The
final step in accounting analysis is to restate accounting numbers to remove any noise
and bias introduced by the accounting rules and management decisions.
The next chapter discusses how to implement these concepts and shows how to make
some of the most common types of adjustments.
DISCUSSION QUESTI ONS
1. A finance student states, “I don’t understand why anyone pays any attention to
accounting earnings numbers, given that a ‘clean’ number like cash from operations
is readily available.” Do you agree? Why or why not?
2. Fred argues, “The standards that I like most are the ones that eliminate all manage-
ment discretion in reporting—that way I get uniform numbers across all companies
and don’t have to worry about doing accounting analysis.” Do you agree? Why or
why not?
3. Bill Simon says, “We should get rid of the FASB and SEC since free market forces
will make sure that companies report reliable information.” Do you agree? Why or
why not?
4. Many firms recognize revenues at the point of shipment. This provides an incentive
to accelerate revenues by shipping goods at the end of the quarter. Consider two
companies, one of which ships its product evenly throughout the quarter, and the
second, which ships all its products in the last two weeks of the quarter. Each com-
pany’s customers pay 30 days after receiving shipment. Using accounting ratios, how
can you distinguish these companies?
5. a. If management reports truthfully, what economic events are likely to prompt the
following accounting changes?
• Increase in the estimated life of depreciable assets
• Decrease in the uncollectible allowance as a percentage of gross receivables
• Recognition of revenues at the point of delivery rather than at the point cash is
received
• Capitalization of a higher proportion of software R&D costs
b. What features of accounting, if any, would make it costly for dishonest managers
to make the same changes without any corresponding economic changes?
3-16
PART 2 • Business Analysis and Valuation Tools
Copyright 2012 Cengage Learning. All Rights Reserved. May not be copied, scanned, or duplicated, in whole or in part. Due to electronic rights, some third party content may be suppressed from the eBook and/or eChapter(s).
Editorial review has deemed that any suppressed content does not materially affect the overall learning experience. Cengage Learning reserves the right to remove additional content at any time if subsequent rights restrictions require it.

6. The conservatism principle arises because of concerns about management’s incen-
tives to overstate the firm’s performance. Joe Banks argues, “We could get rid of
conservatism and make accounting numbers more useful if we delegated financial
reporting to independent auditors rather than to corporate managers.” Do you
agree? Why or why not?
7. A fund manager states, “I refuse to buy any company that makes a voluntary
accounting change, since it’s certainly a case of management trying to hide bad
news.” Can you think of any alternative interpretation?
8. Fair value accounting attempts to make financial information more relevant to
financial statement users, at the risk of greater subjectivity. What factors would you
examine to evaluate the reliability of fair valued assets?
NOTES
1. Accounting analysis is sometimes also called “quality of earnings analysis.” We pre-
fer to use the term accounting analysis since we are discussing a broader concept
than merely a firm’s earnings quality.
2. These definitions paraphrase those of the Financial Accounting Standards Board
(FASB), Statement of Financial Accounting Concepts No. 6, “Elements of Financial
Statements” (1985). Our intent is to present the definitions at a conceptual, not tech-
nical, level. For a more complete discussion of these and related concepts, see the
FASB’s Statements of Financial Accounting Concepts (http://www.fasb.org).
3. SEC rules state that these criteria are satisfied when (i) there is persuasive evidence
that an arrangement exists, (ii) delivery has occurred or services have been rendered,
(iii) the selling price is fixed or determinable, and (iv) collectibility is reasonably
assured (see SAB 104).
4. Strictly speaking, the comprehensive net income of a firm also includes gains and
losses from increases and decreases in equity from non-operating activities or
extraordinary items.
5. Background information on the history of U.S. GAAP / IFRS convergence from
Financial Accounting Standards Board, “International Convergence of Accounting
Standards—A Brief History,” Financial Accounting Standards Board website, http://
www.fasb.org/jsp/FASB/Page/SectionPage&cid=1176156304264, accessed February
2011.
6. IFRS Foundation website, http://www.ifrs.org/Home.htm, accessed January 2011.
7. WhoWeAreandWhatWeDo, the IASB and IFRS Foundation brochure, January
2011, http://www.ifrs.org/NR/rdonlyres/9D0DE08C-C584-46EB-B36E-C4B9A8CB6A02/
0/WhoWeAreJanuary2011English.pdf, accessed February 2011.
8. “FACTBOX-Auditor lawsuits in wake of credit crisis,” January 21, 2011, Reuters,
http://www.reuters.com/assets/print?aid=USN2122314420110121, accessed February
2011.
9. “Judge OKs $125 mln New Century lawsuit settlement,” August 11, 2010, Reuters,
http://www.reuters.com/article/2010/08/11/newcentury-settlement-idUSN101829882
0100811, accessed February 2011.
10. Thus, although accrual accounting is theoretically superior to cash accounting in
measuring a firm’s periodic performance, the distortions it introduces can make
accounting data less valuable to users. If these distortions are large enough, current
cash flows may measure a firm’s periodic performance better than accounting prof-
its. The relative usefulness of cash flows and accounting profits in measuring perfor-
mance, therefore, varies from firm to firm. For empirical evidence on this issue, see
Overview of Accounting Analysis 3-17
Copyright 2012 Cengage Learning. All Rights Reserved. May not be copied, scanned, or duplicated, in whole or in part. Due to electronic rights, some third party content may be suppressed from the eBook and/or eChapter(s).
Editorial review has deemed that any suppressed content does not materially affect the overall learning experience. Cengage Learning reserves the right to remove additional content at any time if subsequent rights restrictions require it.
P. Dechow, “Accounting Earnings and Cash Flows as Measures of Firm Perfor-
mance: The Role of Accounting Accruals,” Journal of Accounting and Economics 18
(July 1994): 3–42.
11. For example, Abraham Briloff wrote a series of accounting analyses of public com-
panies in Barron’s over several years. On average, the stock prices of the analyzed
companies changed by about 8 percent on the day these articles were published,
indicating the potential value of performing such analysis. For a more complete dis-
cussion of this evidence, see G. Foster, “Briloff and the Capital Market,” Journal of
Accounting Research 17 (Spring 1979): 262–74.
12. For a complete discussion of these motivations, see Positive Accounting Theory,by
R. Watts and J. Zimmerman, (Englewood Cliffs, NJ: Prentice-Hall, 1986). A sum-
mary of this research is provided by T. Fields, T. Lys, and L. Vincent in “Empirical
Research on Accounting Choice,” Journal of Accounting and Economics 31 (Septem-
ber 2001): 255–307.
13. The most convincing evidence supporting the covenant hypothesis is reported in a
study of the accounting decisions by firms in financial distress: A. Sweeney, “Debt-
Covenant Violations and Managers’ Accounting Responses,” Journal of Accounting
and Economics 17 (May 1994): 281–308.
14. Studies that examine the bonus hypothesis generally report evidence supporting the
view that managers’ accounting decisions are influenced by compensation considera-
tions. See, for example, P. Healy, “The Effect of Bonus Schemes on Accounting
Decisions,” Journal of Accounting and Economics 7 (April 1985): 85–107; R.
Holthausen, D. Larcker, and R. Sloan, “ Annual Bonus Schemes and the Manipula-
tion of Earnings,” Journal of Accounting and Economics 19 (February 1995): 29–74;
and F. Guidry, A. Leone, and S. Rock, “Earnings-Based Bonus Plans and Earnings
Management by Business Unit Managers,” Journal of Accounting and Economics 26
(January 1999): 113–42.
15. For empirical evidence that CEOs of firms with scheduled awards make opportunis-
tic voluntary disclosures to maximize stock award compensation, see D. Aboody and
R. Kasznik, “CEO Stock Option Awards and the Timing of Corporate Voluntary
Disclosures, Journal of Accounting and Economics 29 (February 2000): 73–100.
16. L. DeAngelo, “Managerial Competition, Information Costs, and Corporate Gover-
nance: The Use of Accounting Performance Measures in Proxy Contests,” Journal
of Accounting and Economics 10 (January 1988): 3–36.
17. The trade-off between taxes and financial reporting in the context of manager’s
accounting decisions is discussed in detail in Taxes and Business Strategy by M.
Scholes and M. Wolfson (Englewood Cliffs, NJ: Prentice-Hall, 1992). Many empiri-
cal studies have examined firm’s LIFO/FIFO choices.
18. Several researchers have documented that firms affected by such situations have a
motivation to influence regulators’ perceptions through accounting decisions. For
example, J. Jones documents that firms seeking import protections make income-
decreasing accounting decisions in “Earnings Management During Import Relief
Investigations,” Journal of Accounting Research 29, no. 2 (Autumn 1991): 193–228.
A number of studies find that banks that are close to minimum capital require-
ments overstate loan loss provisions, understate loan write-offs, and recognize
abnormal realized gains on securities portfolios. See S. Moyer, “Capital Adequacy
Ratio Regulations and Accounting Choices in Commercial Banks,” Journal of
Accounting and Economics 12 (July 1990): 123–54; M. Scholes, G. P. Wilson, and
M. Wolfson, “Tax Planning, Regulatory Capital Planning, and Financial Reporting
Strategy for Commercial Banks,” Review of Financial Studies 3 (1990): 625–50; A.
Beatty, S. Chamberlain, and J. Magliolo, “Managing Financial Reports of
3-18
PART 2 • Business Analysis and Valuation Tools
Copyright 2012 Cengage Learning. All Rights Reserved. May not be copied, scanned, or duplicated, in whole or in part. Due to electronic rights, some third party content may be suppressed from the eBook and/or eChapter(s).
Editorial review has deemed that any suppressed content does not materially affect the overall learning experience. Cengage Learning reserves the right to remove additional content at any time if subsequent rights restrictions require it.
Commercial Banks: The Influence of Taxes, Regulatory Capital and Earnings,” Jour-
nal of Accounting Research 33, no. 2 (1995): 231–61; and J. Collins, D. Shackelford,
and J. Wahlen, “Bank Differences in the Coordination of Regulatory Capital, Earn-
ings and Taxes,” Journal of Accounting Research 33, no. 2 (Autumn 1995): 263–91.
Finally, Kathy Petroni finds that financially weak property-casualty insurers that risk
regulatory attention understate claim loss reserves: K. Petroni, “Optimistic Reporting
in the Property Casualty Insurance Industry,” Journal of Accounting and Economics
15 (December 1992): 485–508.
19. P. Healy and K. Palepu, “The Effect of Firms’ Financial Disclosure Strategies on
Stock Prices,” Accounting Horizons 7 (March 1993): 1–11. For a summary of the
empirical evidence, see P. Healy and J. Wahlen, “A Review of the Earnings Manage-
ment Literature and Its Implications for Standard Setting,” Accounting Horizons 13
(December 1999): 365–84.
20. R. Bowen, L. DuCharme, and D. Shores, in “Stakeholders’ Implicit Claims and
Accounting Method Choice,” Journal of Accounting and Economics 20 (December
1995): 255–295, argue that, based on theory and anecdotal evidence, managers
choose long-run income-increasing accounting methods as a result of ongoing
implicit claims between a firm and its customers, suppliers, employees, and short-
term creditors.
21. Financial analysts pay close attention to managers’ disclosure strategies; the Associa-
tion for Investment Management and Research publishes an annual report evaluat-
ing them for U.S. firms. For a discussion of these ratings, see M. Lang and R.
Lundholm, “Cross-sectional Determinants of Analysts’ Ratings of Corporate Disclo-
sures,” Journal of Accounting Research 31 (Autumn 1993): 246 –71.
22. See Lehman Brothers Holding Inc. Chapter 11 Proceedings Examiners Report, Vol-
ume 3-Section III.A.4: Repo 105.)
23. Securities and Exchange Commission, “Summary by the Division of Corporation
Finance of Significant Issues Addressed in the Review of the Periodic Reports of
the Fortune 500 Companies,” SEC website (accessed May 8, 2006).
24. For a detailed analysis of a company that made such changes, see “Anatomy of an
Accounting Change” by K. Palepu in Accounting & Management: Field Study Per-
spectives, edited by W. Bruns, Jr., and R. Kaplan (Boston: Harvard Business School
Press, 1987).
25. An example of this type of behavior is documented by John Hand in his study, “Did
Firms Undertake Debt-Equity Swaps for an Accounting Paper Profit or True Finan-
cial Gain?” The Accounting Review 64 (October 1989): 587–623.
26. For an empirical analysis of inventory build-ups, see V. Bernard and J. Noel, “ Do
Inventory Disclosures Predict Sales and Earnings?” Journal of Accounting, Auditing,
and Finance (Fall 1991).
27. This is true by and large in the United States and in several other countries. How-
ever, in some countries such as Germany and Japan, tax accounting and financial
reporting have historically been closely tied together, so this particular red flag has
not been very meaningful. With the adoption of international accounting standards
and the development of public capital markets, financial reporting and tax account-
ing in these countries have begun to diverge.
28. For research on accounting and economic incentives in the formation of R&D partner-
ships, see A. Beatty, P. Berger, and J. Magliolo, “Motives for Forming Research and
Development Financing Organizations,” Journal of Accounting and Economics 19
(April 1995): 411–42. An overview of Enron’s use of special purpose entities to manage
earnings and window-dress its balance sheet is provided by P. Healy and K. Palepu, “The
Fall of Enron,” Journal of Economic Perspectives 17, no. 2 (Spring 2003): 3–26.
Overview of Accounting Analysis 3-19
Copyright 2012 Cengage Learning. All Rights Reserved. May not be copied, scanned, or duplicated, in whole or in part. Due to electronic rights, some third party content may be suppressed from the eBook and/or eChapter(s).
Editorial review has deemed that any suppressed content does not materially affect the overall learning experience. Cengage Learning reserves the right to remove additional content at any time if subsequent rights restrictions require it.
29. For an empirical examination of asset write-offs, see J. Elliott and W. Shaw, “Write-
offs as Accounting Procedures to Manage Perceptions,” Journal of Accounting
Research 26, 1988: 91–119.
30. R. Mendenhall and W. Nichols report evidence consistent with managers taking
advantage of their discretion to postpone reporting bad news until the fourth quar-
ter. See R. Mendenhall and W. Nichols, “Bad News and Differential Market Reac-
tions to Announcements of Earlier-Quarter versus Fourth-Quarter Earnings, ”
Journal of Accounting Research, Supplement (1988): 63–86.
31. The role of insider transactions in the collapse of Enron is discussed by P. Healy and
K. Palepu, “The Fall of Enron,” Journal of Economic Perspectives 17, no. 2 (Spring
2003): 3–26.
32. This type of analysis is presented in the context of provisions for bad debts by M.
McNichols and P. Wilson in their study, “Evidence of Earnings Management from
the Provisions for Bad Debts,” Journal of Accounting Research, Supplement (1988):
1–31.
33. This point has been made by several accounting researchers. For a summary of
research on earnings management, see K. Schipper, “Earnings Management,”
Accounting Horizons (December 1989): 91–102.
34. See J. Chang, “The Decline in Value Relevance of Earnings and Book Values” (dis-
sertation, Harvard University, 1998). Evidence is also reported by J. Francis and K.
Schipper, “Have Financial Statements Lost Their Relevance?” Journal of Accounting
Research 37, no. 2 (Autumn 1999): 319–52, and W. E. Collins, E. Maydew, and I.
Weiss, “ Changes in the Value-Relevance of Earnings and Book Value over the Past
Forty Years,” Journal of Accounting and Economics 24 (1997): 39–67.
35. See G. Foster, “Briloff and the Capital Market,” Journal of Accounting Research 17,
no. 1 (Spring 1979): 262–74.
36. See S. H. Teoh, I. Welch, and T. J. Wong, “Earnings Management and the Long-Run
Market Performance of Initial Public Offerings,” Journal of Finance 53 (December
1998): 1935–74; S. H. Teoh, I. Welch, and T. J. Wong, “Earnings Management and
the Post-Issue Underperformance of Seasoned Equity Offerings,” Journal of Finan-
cial Economics 50 (October 1998): 63–99; and S. Teoh, T. Wong, and G. Rao, “Are
Accruals During Initial Public Offerings Opportunistic?” Review of Accounting Stud-
ies 3, nos. 1–2 (1998): 175–208.
37. See P. Dechow, R. Sloan, and A. Sweeney, “Causes and Consequences of Earnings
Manipulation: An Analysis of Firms Subject to Enforcement Actions by the SEC,”
Contemporary Accounting Research 13, no. 1 (1996): 1–36, and M. D. Beneish,
“Detecting GAAP Violation: Implications for Assessing Earnings Management
among Firms with Extreme Financial Performance,” Journal of Accounting and Pub-
lic Policy 16 (1997): 271–309.
3-20
PART 2 • Business Analysis and Valuation Tools
Copyright 2012 Cengage Learning. All Rights Reserved. May not be copied, scanned, or duplicated, in whole or in part. Due to electronic rights, some third party content may be suppressed from the eBook and/or eChapter(s).
Editorial review has deemed that any suppressed content does not materially affect the overall learning experience. Cengage Learning reserves the right to remove additional content at any time if subsequent rights restrictions require it.

Chapter
4
IMPLEMENTING
ACCOUNTING ANALYSIS
W
e learned in Chapter 3 that accounting analysis requires the analyst to
adjust a firm’s accounting numbers using cash flow and footnote
information to “undo” any accounting distortions. This entails recasting a
firm’s financial statements using standard reporting nomenclature and formats. Firms
frequently use somewhat different formats and terminology for presenting their
financial results. Recasting the financial statements using a standard template, therefore,
helps ensure that performance metrics used for financial analysis are calculated using
comparable definitions across companies and over time.
Once the financial statements have been standardized, the analyst is ready to identify
any distortions in financial statements. The analyst’s primary focus should be on those
accounting estimates and methods that the firm uses to measure its key success factors
and risks. If there are differences in estimates and methods between firms or for the
same firm over time, the analyst’s job is to assess whether they reflect legitimate
business differences or differences in managerial judgment or bias. Differences arising
from managerial bias will require adjustment. In addition, even if accounting rules are
adhered to consistently, accounting distortions can arise because the rules themselves
do a poor job of capturing firm economics, creating opportunities for the analyst to
adjust a firm’s financials in a way that presents a more realistic picture of its
performance.
In addition, in today’s global business world, competitors frequently come from a
diverse set of countries and report using different accounting standards, making it
challenging for analysts to compare their financial performance. The two most widely
used standards are U.S. GAAP and International Financial Reporting Standards (IFRS).
In situations when these reporting differences are significant, the analyst can adjust the
financials of the firms to put them on a level playing field.
This chapter begins by showing how to recast the firm’s financial statements into a
template that uses standard terminology and classifications. Next, we use discussion
and examples to illustrate the most common types of accounting distortions that can
arise and show how to make adjustments to the standardized financial statements to
undo these distortions. We then identify some of the significant remaining differences
between U.S. GAAP and IFRS and show how to adjust for these differences. Finally, we
return to our TJX and Nordstrom comparison (first introduced in Chapter 2) in order to
illustrate the adjustments we would make to more appropriately compare these two
companies.
4-1
Copyright 2012 Cengage Learning. All Rights Reserved. May not be copied, scanned, or duplicated, in whole or in part. Due to electronic rights, some third party content may be suppressed from the eBook and/or eChapter(s).
Editorial review has deemed that any suppressed content does not materially affect the overall learning experience. Cengage Learning reserves the right to remove additional content at any time if subsequent rights restrictions require it.

An analysis of the balance sheet is used to identify whether there have been any
distortions to assets, liabilities, or owners’ equity. Once an asset and liability
misstatement has been identified, the analyst can make adjustments to the balance sheet
at the beginning and/or end of the current year, as well as any needed adjustments to
revenues and expenses in the latest income statement. This approach ensures that the
financial ratios used to evaluate a firm’s most recent results and forecast its future
performance are based on financial data that appropriately reflect its business economics.
In some instances, information taken from a firm’s footnotes and cash flow statement
enables the analyst to make a precise adjustment for an accounting distortion. However,
for many types of accounting adjustments, the company does not disclose all of the
information needed to perfectly undo the distortion, requiring the analyst to make an
approximate adjustment to the financial statements.
RECASTI NG FINANCI AL STATEMENTS
Firms sometimes use different nomenclature and formats to present their financial
results. For example, the asset goodwill can be reported separately using such titles as
Goodwill, Excess of Cost Over Net Assets of Acquired Companies, and Cost in Excess
of Fair Value, or it can be included in the line item Other Intangible Assets. Interest
Income can be reported either as a subcategory of Revenues, shown lower down the
income statement as part of Other Income and Expenses, or sometimes as Interest
Expense, Net of Interest Income.
These differences in financial statement terminology, classifications, and formats can
make it difficult to compare performance across firms, and sometimes to compare per-
formance for the same firm over time. The first task for the analyst in accounting analy-
sis is, therefore, to recast the financial statements into a common format. This involves
designing a template for the income statement, balance sheet, and cash flow statement
that can be used to standardize financial statements for any company. Tables 4-1, 4-2,
and 4-3 present the format used throughout the book to standardize the income state-
ment, balance sheet, and cash flow statement, respectively.
TABL E 4 -1 Standardized Income Statement Format
Standard Income
Statement Accounts
Sample Line Items
in Reported Accounts
....................................................................................................................................................
Sales Revenues
Net sales
Turnover
Other non-interest income
Other revenue
Royalties and franchise-related fees
Membership and service fees
Services
Commissions
Licenses
....................................................................................................................................................
Cost of Sales Cost of goods sold
Cost of merchandise sold
Cost of products sold
Cost of revenues
Cost of services
(continued)
4-2 PART 2 • Business Analysis and Valuation Tools
Copyright 2012 Cengage Learning. All Rights Reserved. May not be copied, scanned, or duplicated, in whole or in part. Due to electronic rights, some third party content may be suppressed from the eBook and/or eChapter(s).
Editorial review has deemed that any suppressed content does not materially affect the overall learning experience. Cengage Learning reserves the right to remove additional content at any time if subsequent rights restrictions require it.
Standard Income
Statement Accounts
Sample Line Items
in Reported Accounts
....................................................................................................................................................
Financial services costs
Depreciation on manufacturing facilities
....................................................................................................................................................
SG&A General and administrative
Sales and marketing
Salaries and benefits
Servicing and maintenance
Depreciation on selling and administrative facilities
....................................................................................................................................................
Other Operating Expense Amortization of intangibles
Product development
Research and development
Provision for losses on credit sales
Pre-opening costs
Special charges
....................................................................................................................................................
Investment Income Equity income (from associates)
Dividend income
Rental income
1
....................................................................................................................................................
Other Income Gains on sale of investments / long-term assets
Foreign exchange gains
Pre-tax gains from accounting changes
....................................................................................................................................................
Other Expense Losses on sale of investments / long-term assets
Foreign exchange losses
Pre-tax losses from accounting changes
Restructuring charges
Merger expenses
Asset impairments
....................................................................................................................................................
Interest Income Interest income
....................................................................................................................................................
Interest Expense Interest on long-term debt
Interest on short-term debt
....................................................................................................................................................
Minority Interest Minority interest
....................................................................................................................................................
Tax Expense Tax Expense
Provision for taxes
....................................................................................................................................................
Unusual Gains, Net of Unusual
Losses
Any gains or losses reported on an after-tax basis,
such as:
Extraordinary items
Non-recurring charges
Effect of accounting changes
....................................................................................................................................................
Preferred Dividends Preferred dividends
....................................................................................................................................................
Common Shares Outstanding Common Shares Outstanding
....................................................................................................................................................
Source: © Cengage Learning
Implementing Accounting Analysis 4-3
Copyright 2012 Cengage Learning. All Rights Reserved. May not be copied, scanned, or duplicated, in whole or in part. Due to electronic rights, some third party content may be suppressed from the eBook and/or eChapter(s).
Editorial review has deemed that any suppressed content does not materially affect the overall learning experience. Cengage Learning reserves the right to remove additional content at any time if subsequent rights restrictions require it.

TABL E 4 -2 Standardized Balance Sheet Format
Standard Balance
Sheet Accounts
Sample Line Items
in Reported Accounts
Standard Balance
Sheet Accounts
Sample Line Items
in Reported Accounts
.........................................................................................................................................................................................................................................................
Assets Liabilities and Equity
Cash and Marketable
Securities
Cash
Cash and cash equivalents
Short-term investments
Time deposits
Short-Term Debt Short-term debt
Notes payable (bank)
Bank overdraft
Current portion of long-term debt
Current portion of capital lease obligation
.........................................................................................................................................................................................................................................................
Accounts Receivable Accounts/trade receivables (net)
Trade debtors
Accounts Payable Accounts/trade payables
Trade creditors
Notes payable (trade)
.........................................................................................................................................................................................................................................................
Inventory Inventory
Finished goods
Raw materials
Work-in-process
Stocks
Other Current Liabilities Accrued expenses
Accrued liabilities
Taxes payable
Dividends payable
Deferred (unearned) revenue
Customer advances
.........................................................................................................................................................................................................................................................
Other Current Assets Prepaid expenses
Taxes refundable
Current assets of discontinued operations
Due from affiliates
Due from employees
Prepaid income taxes
Long-Term Debt Long-term debt
Senior term notes
Subordinated debt
Capital lease obligations
Convertible debt
Pension/post-retirement benefit obligation
.........................................................................................................................................................................................................................................................
(continued)
4-4 PART 2 • Business Analysis and Valuation Tools
Copyright 2012 Cengage Learning. All Rights Reserved. May not be copied, scanned, or duplicated, in whole or in part. Due to electronic rights, some third party content may be suppressed from the eBook and/or eChapter(s).
Editorial review has deemed that any suppressed content does not materially affect the overall learning experience. Cengage Learning reserves the right to remove additional content at any time if subsequent rights restrictions require it.

Standard Balance
Sheet Accounts
Sample Line Items
in Reported Accounts
Standard Balance
Sheet Accounts
Sample Line Items
in Reported Accounts
.........................................................................................................................................................................................................................................................
Long-Term Tangible Assets Plant, property, and equipment
Land
Non-current assets of discontinued
operations
Deferred Taxes Deferred income taxes
.........................................................................................................................................................................................................................................................
Long-Term Intangible Assets Goodwill
Software development costs
Deferred financing costs
Deferred subscriber acquisition costs
Deferred charges
Trademarks
License rights
Other Long-Term Liabilities Non-current deferred (unearned) revenues
Other non-current liabilities
.........................................................................................................................................................................................................................................................
Other Long-Term Assets Long-term investments
Long-term receivables
Investment in sales-type or direct-financing
leases
Minority Interest Minority interest
.........................................................................................................................................................................................................................................................
Preferred Stock Preferred stock
Preferred convertible stock
.........................................................................................................................................................................................................................................................
Common Shareholders’ Equity Common stock
Additional paid-in capital
Capital in excess of par
Treasury stock
Retained earnings
Cumulative foreign currency gains and losses
Accumulated other comprehensive income
.........................................................................................................................................................................................................................................................
Source: © Cengage Learning
Implementing Accounting Analysis 4-5
Copyright 2012 Cengage Learning. All Rights Reserved. May not be copied, scanned, or duplicated, in whole or in part. Due to electronic rights, some third party content may be suppressed from the eBook and/or eChapter(s).
Editorial review has deemed that any suppressed content does not materially affect the overall learning experience. Cengage Learning reserves the right to remove additional content at any time if subsequent rights restrictions require it.

TABL E 4 -3 Standardized Cash Flow Statement Format
Standard Cash Flow
Statement Accounts
Sample Line Items
in Reported Accounts
.....................................................................................................................................................
Net Income Net Income
.....................................................................................................................................................
After-tax interest expense
(income)
Interest on long-term debt (calculated net of tax)
Interest on short-term debt (calculated net of tax)
.....................................................................................................................................................
Non-operating Gains (Losses) Gain (loss) on sale of investments / non-current assets
Cumulative effect of accounting changes
Gain (loss) on foreign exchange
Extraordinary gains (losses)
.....................................................................................................................................................
Long-Term Operating Accruals —
Depreciation and
Amortization
Depreciation and amortization
Amortization of subscriber acquisition costs
Amortization of cost in excess of fair value of net assets
acquired
.....................................................................................................................................................
Long-Term Operating Accruals —
Other
Deferred revenues / costs
Deferred income taxes
Impairment of non-current assets
Other non-cash charges to operations
Equity earnings of affiliates / unconsolidated subs, net
of cash received
Minority interest
Stock bonus awards
.....................................................................................................................................................
Net (Investments in) or
Liquidation of Operating
Working Capital
Changes in:
Trade accounts receivable
Other receivables
Prepaid expenses
Trade accounts payable
Accrued expenses (liabilities)
Due from affiliates
Accounts payable and accrued expenses
Refundable / payable income taxes
Inventories
Provision for doubtful accounts and bad debts
Other current liabilities
Other current assets
.....................................................................................................................................................
Net (Investment in) or
Liquidation of Operating
Long-Term Assets
Purchase / sale of non-current assets
Acquisition of research and development
Acquisition / sale of business
Capital expenditures
Equity investments
Acquisition of subsidiary stock
Capitalization of computer software development costs
Cost in excess of the fair value of net assets acquired
Investment in sales-type and direct financing leases
.....................................................................................................................................................
(continued)
4-6 PART 2 • Business Analysis and Valuation Tools
Copyright 2012 Cengage Learning. All Rights Reserved. May not be copied, scanned, or duplicated, in whole or in part. Due to electronic rights, some third party content may be suppressed from the eBook and/or eChapter(s).
Editorial review has deemed that any suppressed content does not materially affect the overall learning experience. Cengage Learning reserves the right to remove additional content at any time if subsequent rights restrictions require it.
To create standardized financials for a particular company, the analyst classifies each
line item in that firm’s financial statements using the appropriate account name from the
above templates. This may require using information from the footnotes to ensure that
accounts are classified appropriately. An example, applying the above template to
standardize the financial statements for the year ending January 2011 for The TJX
Companies, Inc., is shown in Appendix A at the end of this chapter.
MAKING ACCOUNTING ADJUSTMENTS
Once the financials have been standardized, the analyst can evaluate whether accounting
adjustments are needed to correct any distortions in assets, liabilities, or equity, as dis-
cussed below.
Asset Distortions
Accountants define assets as resources that a firm owns or controls as a result of past
business transactions, and which are expected to produce future economic benefits that
can be measured with a reasonable degree of certainty. Assets can take a variety of forms,
including cash, marketable securities, receivables from customers, inventory, fixed assets,
long-term investments in other companies, and intangibles.
Distortions in asset values generally arise because there is ambiguity about whether
• The firm owns or controls the economic resources in question,
• The economic resources are likely to provide future economic benefits that can be
measured with reasonable certainty, or
• The fair values of assets are lower or higher than their book values.
Who Owns or Controls Resources?
For most resources used by a firm, ownership or control is relatively straightforward—
the firm using the resource owns the asset. However, some types of transactions make it
Standard Cash Flow
Statement Accounts
Sample Line Items
in Reported Accounts
.....................................................................................................................................................
Net Debt (Repayment) or
Issuance
Principal payments on debt
Borrowings (repayments) under credit facility
Issuance (repayment) of long-term debt
Net increase (decrease) in short-term borrowings
Notes payable
.....................................................................................................................................................
Dividend (Payments) Cash dividends paid on common stock
Cash dividends paid on preferred stock
Distributions
.....................................................................................................................................................
Net Stock (Repurchase) or
Issuance
Proceeds from issuance of common stock
Issue of common stock for services
Issue (redemption) of preferred securities
Issue of subsidiary equity
Purchase (issue) of treasury stock
.....................................................................................................................................................
Source: © Cengage Learning
Implementing Accounting Analysis 4-7
Copyright 2012 Cengage Learning. All Rights Reserved. May not be copied, scanned, or duplicated, in whole or in part. Due to electronic rights, some third party content may be suppressed from the eBook and/or eChapter(s).
Editorial review has deemed that any suppressed content does not materially affect the overall learning experience. Cengage Learning reserves the right to remove additional content at any time if subsequent rights restrictions require it.
difficult to assess who owns a resource. For example, does the lessor or the lessee own or
control a resource that has been leased? Or consider a firm that discounts a customer
receivable with a bank. If the bank has recourse against the firm should the customer
default, is the real owner of the receivable the bank or the company?
Given the subjectivity of identifying when a company has control over an asset,
accountants fre quently use mechanical rules to define control. These rules make i t
easy for accountants to implement accounting standards, but they can result in differ-
ences in standards across countr ies. They also permit managers to “groom” transac-
tions to satisfy their own financial reporting objectives. For exam ple, both U.S. GAAP
and IFRS currently permit lease transactions to be structured in such a way that the
leased asset can be reported on the balance sheet of the lessee, the lessor, or on neither
party’s balance sheet.
2
Accounting analysis, therefore, involves assessing whether a
firm’s reported assets adequately ref lect the key resources that are under its control,
and whether adjustments are required to compare its performance with that of
competitors.
Asset ownership issues also arise indirectly from the application of rules for revenue
recognition. Firms are permitted to recognize revenues only when their product has been
shipped or their service has been provided to the customer. Revenues are then consid-
ered “earned,” and the customer has a legal commitment to pay for the product or ser-
vice. As a result, for the seller, recognition of revenue frequently coincides with
“ownership” of a receivable that is shown as an asset on its balance sheet. Therefore,
accounting analysis that raises questions about whether or not revenues have been
earned often affects the valuation of assets.
Ambiguity over whether a company owns an asset creates a number of opportunities
for accounting analysis:
• Despite management’s best intentions, financial statements sometimes do a poor
job of reflecting the firm’s economic assets since it is difficult for accounting rules
to capture all of the subtleties associated with ownership and control.
• Because accounting rules on ownership and control permit managers to groom
transactions such that essentially similar transactions are reported in very different
ways, important assets may be omitted from the balance sheet even though the
firm bears many of the economic risks of ownership.
• There may be legitimate differences in opinion between managers and analysts
over residual ownership risks borne by the company, leading to differences in
opinion over reporting for these assets.
• Aggressive revenue recognition, which boosts reported earnings, is likely to affect
asset values.
Can Future Economic Benefits Be Measured
with Reasonable Certainty?
It is almost always difficult to accurately forecast the future benefits associated with cap-
ital outlays because the world is uncertain. A company does not know whether a com-
petitor will offer a new product or service that makes its own offering obsolete. It does
not know whether the products manufactured at a new plant will be the type that custo-
mers want to buy. A company does not know whether changes in oil prices will make
the oil drilling equipment that it manufactures less valuable.
Accounting rules deal with these challenges by stipulating the types of resources that
can be recorded as assets and those that cannot. The judgment involved in creating these
rules, however, can lead to reporting differences across firms and countries. For example,
4-8
PART 2 • Business Analysis and Valuation Tools
Copyright 2012 Cengage Learning. All Rights Reserved. May not be copied, scanned, or duplicated, in whole or in part. Due to electronic rights, some third party content may be suppressed from the eBook and/or eChapter(s).
Editorial review has deemed that any suppressed content does not materially affect the overall learning experience. Cengage Learning reserves the right to remove additional content at any time if subsequent rights restrictions require it.
consider the treatment of the economic benefits from research and development (R&D),
which is generally considered highly uncertain. Research projects may never deliver
promised new products, the products they generate may not be economically viable, or
products may be made obsolete by competitors’ research. Under U.S. GAAP, R&D out-
lays are expensed, except for software development costs on products that satisfy techno-
logical feasibility standards (see SFAS 86). IFRS requires all research costs to be expensed
but permits firms to capitalize development costs once standards of technical and market
feasibility are satisfied (IAS 38).
Rules that require the immediate expensing of outlays for some key resources may be
good accounting, but they create a challenge for the analyst—they make it more difficult
to infer financial performance from the financial statements. If all U.S. firms expense
R&D, financial statements will reflect differences in R&D success only when new pro-
ducts are commercialized rather than during the development process. Differences in
R&D expensing for firms using U.S. GAAP and IFRS will also make it challenging for
the analyst to assess how much of any differences in reported performance are due to
reporting standards rather than economic performance. One way the analyst can attempt
to correct for these distortions is by capitalizing key R&D outlays and adjusting the value
of the intangible asset based on R&D updates.
3
Have Fair Values of Assets Declined Below Book Value?
An asset is impaired when its fair value falls below its book value. Of course, markets for
many long-term operating assets are illiquid and incomplete, making it highly subjective
to infer their fair values. As the 2008 financial crisis demonstrated, asset valuation can
also be subjective in markets that are typically highly liquid but which have temporarily
frozen. Consequently, considerable management judgment is involved in deciding
whether an asset is impaired and determining the value of any impairment loss.
For the analyst, this raises the possibility that asset values are misstated. In most
countries, accounting standards require that a loss be recorded for permanent
asset impairments. Once again, however, the specific rules differ across countries. For
example, U.S. rules (SFAS 144) permit a certain amount of asset overstatement since
the test for asset impairment compares the asset’s book value to the expected value of
undiscounted (rather than discounted) future cash flows expected to be generated from
future use and sale of the asset. This can create situations where no financial statement
loss is reported for an asset that is economically impaired. In contrast, IFRS requires the
asset impairment test to be based on discounted (rather than undiscounted) cash flows.
The task of determining whether there has been an asset impairment and valuing the
impairment is delegated to management with oversight by the firm’s auditors. This
leaves opportunities for potential management bias in valuing assets and for legitimate
differences in opinion between managers and analysts over asset valuations. In most
cases, management bias will lead to overstated assets since managers will prefer not to
recognize an impairment. However, managers can also bias asset values downward by
overstating the current level of impairment, thereby reducing future expenses and
increasing future earnings.
Opportunities for accounting adjustments can therefore arise in the situations dis-
cussed above if
• Accounting rules do not do a good job of capturing the firm’s economics,
• Managers use their discretion to distort the firm’s performance, or
• There are legitimate differences in opinion between managers and analysts about
economic uncertainties facing the firm that are reflected in asset values.
Implementing Accounting Analysis 4-9
Copyright 2012 Cengage Learning. All Rights Reserved. May not be copied, scanned, or duplicated, in whole or in part. Due to electronic rights, some third party content may be suppressed from the eBook and/or eChapter(s).
Editorial review has deemed that any suppressed content does not materially affect the overall learning experience. Cengage Learning reserves the right to remove additional content at any time if subsequent rights restrictions require it.
Overstated Assets
Asset overstatements are likely to arise when managers have incentives to increase
reported earnings. Thus, adjustments to assets also typically require adjustments to the
income statement in the form of either increased expenses or reduced revenues. The
most common forms of asset (and earnings) overstatement are the following:
1. Delayed asset write-downs. If assets become impaired—that is, their realizable
values fall below their book values—accounting rules generally require that they
be written down to their fair values. Asset impairments affect earnings since
write-downs are charged directly to earnings. Asset write-downs also increase a
firm’s leverage, potentially limiting its ability to access capital markets. However,
determining an asset’s fair value involves considerable judgment, potentially pro-
viding managers with an opportunity to defer asset impairments as a way to
boost reported profits and to enhance their firms’ financial position.
4
Analysts that cover firms where management of inventories and receivables is a
key success factor (e.g., the fashion retail and consumer electronics industries) need
to be particularly cognizant of this form of earnings management and its impact
on assets. For example, if managers over-buy or over-produce in the current
period, they are likely to have to offer customers discounts or attractive credit
terms to get rid of surplus inventories. Significant customer discounts negatively
impact earnings, while providing customers with credit carries the risk of default.
Warning signs for delays in this type of asset write-down include growing inven-
tory and receivables, write-downs of similar products by competitors, and business
downturns for a firm’s major customer.
Deteriorating industry or firm economic conditions can also affect the value
of long-term non-financial assets (such as plant and equipment) or intangible
assets (such as goodwill). Although firms are required to recognize impairments
in the values of these assets when they arise, second-hand markets for these asset
types are often illiquid, incomplete, or nonexistent, making estimates of asset
valuations and impairments inherently subjective. As a result, managers can use
their reporting judgment to d elay write-downs on the balance sheet and avoid
showing impairment charges in the income statement.
5
This issue is p articularly
relevant for asset-intensive firms in volatile markets (e.g., airlines) or for firms
that follow a strategy of aggressive growth through acquisitions (and thus have
large amounts of goodwill on their balance sheet).
6
Warningsignsfordelaysin
impairments in long-term non-financial assets include declining long-term asset
turnover, declines in return on assets to below the cost of capital for the firm,
write-downs by other firms in the same industry that have also suffered deterio-
rating asset use, and overpayment for or unsuccessful integration of key
acquisitions.
2. Underestimated reserves (e.g., allowances for bad debts or loan losses). Managers
make estimates of expected customer defaults on accounts receivable and loans
and create reserves to cover these anticipated costs. If managers underestimate
the value of these reserves, assets and earnings will be overstated. Warning signs
of inadequate allowances include growing receivables, business downturns for a
firm’s major clients, and growing loan delinquencies.
3. Accelerated recognition of revenues (increasing receivables). Managers typically have
the best information on the uncertainties governing revenue recognition—whether
a product or service has been provided to customers and whether cash collection is
4-10
PART 2 • Business Analysis and Valuation Tools
Copyright 2012 Cengage Learning. All Rights Reserved. May not be copied, scanned, or duplicated, in whole or in part. Due to electronic rights, some third party content may be suppressed from the eBook and/or eChapter(s).
Editorial review has deemed that any suppressed content does not materially affect the overall learning experience. Cengage Learning reserves the right to remove additional content at any time if subsequent rights restrictions require it.

reasonably likely. However, managers may also have incentives to accelerate the rec-
ognition of revenues, boosting reported earnings for the period. Accounts receivable
and earnings will then be overstated. Aggressive revenue recognition is one of the
most popular forms of earnings management cited by the SEC. Warning signs
include receivables growth outpacing sales growth, and increasing days’ receivable.
4. Understated depreciation/amortization on long-term assets. Managers make esti-
mates of asset lives, salvage values, and amortization schedules for depreciable
long-term assets. If these estimates are optimistic, long-term assets and earnings
will be overstated. This issue is likely to be most pertinent for firms in asset-
intensive businesses (e.g., airlines, utilities). A comparison of the firm’s policies to
those of its industry competitors with a similar asset base and strategy will help an
analyst identify potential overstatements.
EXAMPLES OF HOW TO CORRECT FOR ASSET OVERSTATEMENT
The following examples illustrate some of the distortions that lead to overstated assets
and the types of corrections that an analyst can make to reduce bias in the financial
statements.
Delayed Write-Downs of Assets
In recent years, the portable MP3 player dominated the music delivery industry, influ-
encing everything from format to record label strategy to how artists market and release
their music. Apple has dominated the market with its iPod player—building a U.S. mar-
ket share of over 75 percent since its introduction in 2001. Rivals such as Creative Tech-
nology, Sony, Microsoft, and Samsung have competed aggressively in an attempt to grab
a share of this rapidly growing market. Key risks facing these firms include rapid
changes in MP3 player technology and inventory management in the face of both relent-
less competition and potential technological obsolescence.
Singapore-based Creative Technology posted impressive revenue growth from the sec-
ond half of 2003 through the first quarter of 2005, with predictable spikes in holiday
season sales in both 2003 and 2004. However, gross margins steadily declined from
35 percent to 23 percent over this period. A more worrying trend was the firm’s inven-
tory management. Growth in inventory far outpaced growth in sales, leading to a 58 per-
cent increase in days’ inventory, from 100 days for the quarter ending September 30,
2003, to 158 days for the quarter ending March 31, 2005. Inventory at the end of
March 2006 was valued at $451.2 million, up from $183.9 million nine months prior.
This increase raises questions for analysts about Creative Technology’s inventory value
and potential obsolescence.
An analyst can assess whether inventory is impaired by talking with suppliers and
customers, observing the speed of new product launches for MP3 players, benchmarking
against the performance of other firms in the industry, and understanding the general
sentiment about expected market growth. Based on this research, an analyst can judge
whether Creative Technology’s slowdown in inventory turnover is likely to persist,
whether there are serious technological risks for the current inventory, and, if so, whether
and how large an impairment charge is appropriate. Prior to the release of earnings for
the June 31, 2005, quarter, several analysts raised questions about the growth in Creative
Technology’s inventory and anticipated that the company would be forced to record
future inventory impairment charges.
Implementing Accounting Analysis 4-11
Copyright 2012 Cengage Learning. All Rights Reserved. May not be copied, scanned, or duplicated, in whole or in part. Due to electronic rights, some third party content may be suppressed from the eBook and/or eChapter(s).
Editorial review has deemed that any suppressed content does not materially affect the overall learning experience. Cengage Learning reserves the right to remove additional content at any time if subsequent rights restrictions require it.

Once an analyst concludes that inventory is overstated, the challenge is to
estimate the magnitude of the write-down. For Creative Technology, this depends on
the price discounts that are required to move slow-moving products. The after-tax cost
of the impairment will reduce current and ret ained earnings. In addition, the tax effect
of the impairment will lower the Tax Expense and reduce the Deferred Tax Liability
since the inventory write-down is not recorded for tax pur poses until the i nventory is
subsequently sold. Creative Technology enjoys a special status in Singapore that
exempts certain elements of revenues from income tax. However, for illustrative pur-
poses, using the local statutory tax rate of 20 percent, the financ ial statemen ts could be
modified as follows for an assumed inventory overstatement of $25 million:
Adjustment
...................................................................
($ Millions) Assets
Liabilities &
Equity
......................................................................................................................................
Balance Sheet
Inventory −25.0
Deferred Tax Liability −8.8
Common Shareholders’ Equity −16.2
......................................................................................................................................
Income Statement
Cost of Sales þ25.0
Tax Expense
−8.8
Net Income −16.2
.......................................................................................................................................
In August 2005, Creative Technology announced that it would take a $20 million
charge against inventory to reflect a decline in prices of certain components used to
manufacture MP3 players. In the quarter ending March 31, 2006, the company took
another inventory write-down due to a steep drop in the price of components such as
flash memory and hard drives. Not surprisingly, Creative Technology’s share price tum-
bled in response to news of the write-downs—from a high of close to $17 per share in
early 2005, the stock traded at less than $5 per share in mid-2006.
Underestimated Reserves
In late 2006, Community Health Systems (CHS) was the leading operator of general and
acute care hospitals in non-urban communities in the United States. The company
owned 77 hospitals in 22 states, had a dominant market share in more than 85 percent
of the markets it served, and in fiscal 2005 generated $3.7 billion in revenues.
CHS received payments for its services from governmental agencies, private insurers,
and directly from the patients it served. Medicare was the single largest revenue provider,
accounting for approximately 33 percent of net operating revenue in the quarter ended
June 30, 2006. Managed care provided a further 25 percent of revenues, 10 percent came
from Medicaid, and 13 percent was from self-pay sources (uninsured patients, patient
deductibles, co-insurance payments not covered by the insurer, and patients whose
insurance providers had failed to pay).
Prior to 2006, CHS estimated its allowance for doubtful accounts by reserving an
amount equal to all receivables aged over 150 days, regardless of patient class. Based on
this approach, CHS’s quarterly filing for the quarter ended June 30, 2006, showed allow-
ance for doubtful accounts at 32.5 percent of gross receivables. However, this approach
did not differentiate among the risk characteristics of different classes of patients. In par-
ticular, it failed to recognize that collection rates were lowest for self-pay accounts and
4-12 PART 2 • Business Analysis and Valuation Tools
Copyright 2012 Cengage Learning. All Rights Reserved. May not be copied, scanned, or duplicated, in whole or in part. Due to electronic rights, some third party content may be suppressed from the eBook and/or eChapter(s).
Editorial review has deemed that any suppressed content does not materially affect the overall learning experience. Cengage Learning reserves the right to remove additional content at any time if subsequent rights restrictions require it.

that there had been an increase in the proportion of revenues and receivables from these
patients during the quarter.
An analyst who recognized the importance of the increase in the proportion of receiv-
ables from self-pay customers might decide that the June 2006 receivable allowances were
understated, and that balance sheet adjustments needed to be made to Accounts Receiv-
able (for the gross change in reserve), to the Deferred Tax Liability (for the tax impact of
the increased expense), and to Retained Earnings (for the net effect). For example, if the
analyst decided that allowances for doubtful accounts for CHS should be 36 percent rather
than 32.5 percent of Accounts Receivable, to reflect the change in patient mix, Accounts
Receivable would have to be reduced by $37.8 million (given the June 2006 Accounts
Receivable balance of $1.08 billion and allowance for doubtful accounts of $351 million).
Given the company’s effective tax rate of 39 percent, this would reduce earnings and
equity by $23.1 million and the Deferred Tax Liability by $14.7 million. The adjustment
to the June 30, 2006, financial statements would, therefore, be as follows:
Adjustment
...................................................................
($ Millions) Assets
Liabilities &
Equity
......................................................................................................................................
Balance Sheet
Accounts Receivable −37.8
Deferred Tax Liability −14.7
Common Shareholders’ Equity −23.1
......................................................................................................................................
Income Statement
Provision for Doubtful Accounts þ37.8
Tax Expense
−14.7
Net Income −23.1
.......................................................................................................................................
At the end of October 2006, CHS announced that it would change its methodology for
estimating the allowance for doubtful accounts for the quarter ending September 30. Under
the new method, the company estimated separate default rates for self-pay and other
accounts receivable to reflect the differences in collection history. As a result, an incremental
$65 million bad debt expense was recorded for the quarter and the estimate increased to
38 percent of gross receivables. Further allowance increases occurred in 2008 and 2009,
to 40 percent and 42 percent of receivables respectively. CHS explained that the decline in
collectability was primarily the result of the weak economy that had increased the number
of patients qualifying for charity care, reduced enrollment in certain state Medicaid pro-
grams, and increased the number of non-resident aliens seeking indigent care.
Accelerated Recognition of Revenues
In 2006, the SEC announced an informal inquiry into the financials of Diebold Inc., a
U.S. maker of voting equipment, automated teller machines, and bank security systems.
In May 2007, Diebold announced that it had received a subpoena from the SEC seeking
documents related to its revenue recognition practices. At issue was the recognition of
certain North American revenues on “bill and hold” transactions, where the company
billed its customers for sales and held the merchandise until later delivery. Under U.S.
GAAP, these transactions could be recorded as revenue provided the customer requested
that the seller hold the merchandise for legitimate business purposes, there was an
agreed delivery schedule, the products were ready for shipment, and the seller did not
have any future performance obligations.
Implementing Accounting Analysis 4-13
Copyright 2012 Cengage Learning. All Rights Reserved. May not be copied, scanned, or duplicated, in whole or in part. Due to electronic rights, some third party content may be suppressed from the eBook and/or eChapter(s).
Editorial review has deemed that any suppressed content does not materially affect the overall learning experience. Cengage Learning reserves the right to remove additional content at any time if subsequent rights restrictions require it.

From 2002 to 2003, Diebold’s days’ receivable had increased from 76 to 97 days—an
increase of 28 percent. Upon investigation, the SEC detected a number of improper rev-
enue transactions, including shipments from the factory to the warehouse that had been
recorded as “bill and hold” sales. An analyst who had observed the increased days’
receivable and the SEC interest in Diebold, and wanted to adjust the company’s revenues
could estimate the impact of the increase on sales and profits. To reduce days’ receivable
by 21 days, revenues and accounts receivable for 2003 would have to decline by $150
million, requiring the following changes to Diebold’s 2003 financial reports:
1. Sales and Accounts Receivable would both decline by $150 million.
2. Cost of Sales would decline and Inventory would increase to reflect the reduction
in sales. The value of the Cost of Sales / Inventory adjustment can be estimated by
multiplying the sales adjustment by the ratio of cost of sales to sales (67 percent
for Diebold in 2003), or $100.5 million (67 percent of $150 million).
3. The decline in pretax income would result in a lower Tax Expense in the com-
pany’s financial reporting books (but presumably not in its tax books). Conse-
quently, the Deferred Tax Liability would have to be reduced. Diebold’s marginal
tax rate was 35 percent, implying that the decline in the Tax Expense and Deferred
Tax Liability would be $17.3 million [($150 $100.5) .35].
The full effect of the adjustment on the 2003 financial statements would therefore be
as follows:
Adjustment
...................................................................
($ Millions) Assets
Liabilities &
Equity
......................................................................................................................................
Balance Sheet
Accounts Receivable −150.0
Inventory þ100.5
Deferred Tax Liability −17.3
Common Shareholders’ Equity −32.2
......................................................................................................................................
Income Statement
Sales −150.0
Cost of Sales −100.5
Tax Expense
−17.3
Net Income −32.2
.......................................................................................................................................
As a result of the SEC inquiry, Diebold launched an internal review of its accounting
practices and in September of 2008 announced that it was restating its financial state-
ments for the fiscal years 2003–2006 as well as the quarter ended March 31, 2007. In
June 2010 the company agreed to pay a $25 million civil penalty to settle an SEC suit.
Understate d Assets
Asset understatements typically arise when managers have incentives to deflate reported
earnings. This may occur when the firm is performing exceptionally well and managers
decide to store away some of the current strong earnings for a rainy day. Income
smoothing, as it has come to be known, can be implemented by over-stating current
4-14
PART 2 • Business Analysis and Valuation Tools
Source: © Cengage Learning
Copyright 2012 Cengage Learning. All Rights Reserved. May not be copied, scanned, or duplicated, in whole or in part. Due to electronic rights, some third party content may be suppressed from the eBook and/or eChapter(s).
Editorial review has deemed that any suppressed content does not materially affect the overall learning experience. Cengage Learning reserves the right to remove additional content at any time if subsequent rights restrictions require it.
period expenses (and understating the value of assets) during good times. Asset (and
expense) understatements can also arise in a particularly bad year, when managers
decide to “take a bath” by understating current period earnings to create the appearance
of a turnaround in following years. Accounting analysis involves judging whether man-
agers have understated assets (and also income) and, if necessary, adjusting the balance
sheet and income statement accordingly.
Asset understatements can also arise because of accounting rules themselves. In many
countries, accounting standards require firms to expense outlays for R&D and advertis-
ing because, even though they may create future value for owners, their outcomes are
highly uncertain. Asset understatements can also arise when managers have incentives
to understate liabilities. For example, if a firm records lease transactions as operating
leases or if it discounts receivables with recourse, neither the assets nor the accompa-
nying obligations are shown on its balance sheet. Yet, in some instances, this accounting
treatment does not reflect the underlying economics of the transactions—the lessee may
effectively own the leased assets, and the firm that sells receivables may still bear all of
the risks associated with ownership. The analyst will then want to adjust the balance
sheet (and also the income statement) for these effects.
The most common forms of asset (and earnings) understatement arise when there are
the following:
1. Overstated asset write-downs. Managers potentially have an incentive to overstate
asset write-downs either during years of exceptionally strong performance, or
when the firm is financially distressed. By overstating asset impairments and over-
stating expenses in the current period, managers can show lower future expenses,
boosting earnings in years of sub-par performance or when a turnaround is
needed. Overstated asset write-downs can also arise when managers are less opti-
mistic about the firm’s future prospects than the analyst.
2. Overestimated reserves (e.g., allowances for bad debts or loan losses). If managers
overestimate reserves for bad debts or loan losses, accounts receivable and loans
will be understated.
3. Overstated depreciation/amortization on long-term assets. Firms that use tax depre-
ciation estimates of asset lives, salvage values, or amortization rates are likely to
amortize assets more rapidly than justifiable given the assets’ economic usefulness,
leading to long-term asset understatements.
4. Lease assets off balance sheet. Assessing whether a lease arrangement should be
considered a rental contract (and he nce recorded using the operating method)
or equivalent to a purchase (and hence shown as a capital lease) is subjective. It
depends on whe ther the lessee has effe ctively accepted most of the risks of own-
ership, such as obsolescence and physical deterioration. To standardize the
reporting of lease transactions, accounting standards have created criteria for dis-
tinguishing between the two types. In the United States, SFAS 13 requires a lease
transaction to be equivalent to an asset purchase if any of the following condi-
tions hold: (1) ownership of the asset is transferred to the lessee at the end of
the lease term, (2) the lessee has the option to purchase the asset for a bargain
price at the end of the lease term, (3) the lease term is 75 percent or more of
the asset’s expected useful life, and (4) the present value of the lease payments
is 90 percent or more of the fair value of the asset. Given these objective criteria,
managers reporting under U.S. GAAP can structure lease contracts to circumve nt
the spirit of the distinction between capital and operating leases, potentially lead-
ing to the understatement of lease assets.
7
This is likely to be an im portant issue
for the analysis of asset-intensive industries where there are options for leasing
Implementing Accounting Analysis 4-15
Copyright 2012 Cengage Learning. All Rights Reserved. May not be copied, scanned, or duplicated, in whole or in part. Due to electronic rights, some third party content may be suppressed from the eBook and/or eChapter(s).
Editorial review has deemed that any suppressed content does not materially affect the overall learning experience. Cengage Learning reserves the right to remove additional content at any time if subsequent rights restrictions require it.

(e.g., airline s and retail chains).
8
In contrast, IFRS standard IAS 17 focuses on
transfer of risk and reward to indicate transfer of ownership rather than man-
dated numerical thresholds.
5. Key intangible assets, such as R&D and trademarked brands, not reported on the
balance sheet. Some firms’ most important assets are excluded from the balance
sheet. Examples include investments in R&D, software development outlays, and
brands and membership bases that are created through advertising and promo-
tions. U.S. GAAP prohibits the capitalization of R&D outlays and membership
acquisition costs (with an exception for certain software development costs),
while countries reporting under IFRS are generally required to expense these costs
as well (with some additional limited latitude in the area of development costs)—
primarily because it is believed that the benefits associated with such outlays are
too uncertain. New products may never reach the market due to technological
infeasibility or to the introduction of superior products by competitors; and new
members that sign up for a service as a result of a promotions campaign may sub-
sequently quit. Expensing the cost of intangibles has two implications for analysts.
First, the omission of intangible assets from the balance sheet inflates measured rates
of return on capital (either return on assets or return on equity).
9
For firms with key
omitted intangible assets, this omission has important implications for forecasting
long-term performance; unlike firms with no intangibles, competitive forces will
not cause their rates of return to fully revert to the cost of capital over time. For
example, pharmaceutical firms have shown very high rates of return over many dec-
ades in part because of the impact of R&D accounting. A second effect of expensing
outlays for intangibles is that it makes it more difficult for the analyst to assess
whether the firm’s business model works. Under the matching concept, operating
profit is a meaningful indicator of the success of a firm’s business model since it
compares revenues and the expenses required to generate them. Immediately
expensing outlays for intangible assets runs counter to matching and, therefore,
makes it more difficult to judge a firm’s operating performance. Consistent with
this, research shows that investors view R&D and advertising outlays as assets rather
than expenses.
10
Understated intangible assets are likely to be important for firms in
pharmaceutical, software, branded consumer products, and subscription businesses.
EXAMPLES OF HOW TO CORRECT FOR ASSET UNDERSTATEMENT
The following examples illustrate some of the types of distortions that understate assets
and show corrections that an analyst can make to ensure that assets are reflected
appropriately.
Overstated Depreciation for Long-Term Assets
In 2009 Lufthansa, the German national airline, reported that it depreciated its aircraft
over 12 years on a straight-line basis, with an estimated residual value of 15 percent of
initial cost. Air France-KLM, an airline formed in 2004 by the merger of the French air-
line Air France and the Dutch airline KLM, is one of Lufthansa’s main competitors. In
contrast to Lufthansa, Air France-KLM reported that its aircraft depreciation was also
estimated using the straight-line method but assuming an average life of 20 years and
no residual value.
11
For the analyst, these differences raise several questions. Do Lufthansa and Air
France-KLM fly different types of routes, potentially explaining the differences in their
4-16
PART 2 • Business Analysis and Valuation Tools
Copyright 2012 Cengage Learning. All Rights Reserved. May not be copied, scanned, or duplicated, in whole or in part. Due to electronic rights, some third party content may be suppressed from the eBook and/or eChapter(s).
Editorial review has deemed that any suppressed content does not materially affect the overall learning experience. Cengage Learning reserves the right to remove additional content at any time if subsequent rights restrictions require it.

depreciation policies? Alternatively, do they have different asset management strategies?
For example, does Lufthansa use newer planes to attract more business travellers, to
lower maintenance costs, or to lower fuel costs? If there do not appear to be operating
differences that explain the differences in the two firms’ depreciation rates, the analyst
may well decide that it is necessary to adjust the depreciation rates for one or both
firms to ensure that their performance is comparable.
To adjust for this effect, the analyst could choose to decrease Lufthansa’s depreciation
rates to match those of Air France-KLM. The following financial statement adjustments
would then be required in Lufthansa’s financial statements:
1. Increase the book value of the fleet at the beginning of the year to adjust for the
relatively high depreciation rates that had been used in the past. This will also
require an offsetting increase in equity (retained earnings) and in the deferred tax
liability.
2. Reduce the depreciation expense (and increase the book value of the fleet) to
reflect the lower depreciation for the current year, and increase the tax expense
(in 2009, Lufthansa’s tax rate was 25 percent). On the balance sheet, show an
increase in equity and deferred tax liability.
Note that these changes are designed to show Lufthansa ’s results as if it had always used
the same depreciation assumptions as Air France-KLM rather than to reflect a change in
the assumptions for the current year going forward. This enables the analyst to compare
ratios that use assets (e.g., return on assets) for the two companies.
Lufthansa reported in its 2009 Annual Report the total cost of its aircraft at the begin-
ning of 2009 as €17,918 m, and that accumulated depreciation was €10,547 m. This
implies that the average life of Lufthansa’s fleet was 8.32 years, calculated as follows:
€ Millions (unless otherwise noted)
.........................................................................................................................................
Aircraft cost, 01/01/09 17,918 Reported
Depreciable cost 15,230 Cost (1 .15)
Accumulated depreciation, 01/01/09 10,547 Reported
Accumulated depreciation / Depreciable
cost
69.3%
Depreciable life
12 years Reported
Average age of aircraft 8.32 12 .693 years
..........................................................................................................................................
If Lufthansa used the same useful life and salvage estimates as Air France-KLM, Accu-
mulated Depreciation would have been only €7,454 m, thereby increasing the company’s
Long-term Tangible Assets by €3,093 m and Common Shareholders’ Equity by €2,320 m,
while also increasing the Deferred Tax Liability by €773 m:
€ Millions (unless otherwise noted)
.........................................................................................................................................
Aircraft cost at 01/01/09 17,918 Reported
Depreciable cost 17,918 No residual value
Depreciable life 20 years Air France-KLM
Accumulated depreciation, 01/01/09 7,454 Over 8.32 years
.........................................................................................................................................
Increase in Long-Term Tangible Assets 3,093
Marginal Tax Rate 25.0% Reported
Increase in Deferred Tax Liability 773
Increase in Common Shareholders Equity 2,320
..........................................................................................................................................
Implementing Accounting Analysis 4-17
Copyright 2012 Cengage Learning. All Rights Reserved. May not be copied, scanned, or duplicated, in whole or in part. Due to electronic rights, some third party content may be suppressed from the eBook and/or eChapter(s).
Editorial review has deemed that any suppressed content does not materially affect the overall learning experience. Cengage Learning reserves the right to remove additional content at any time if subsequent rights restrictions require it.

Given its net investment in new aircraft of €2,055 m in 2009, Lufthansa’s depreciation
expense for 2009 (included in Cost of Sales) using the same useful life and salvage esti-
mates as Air France-KLM, would have been €947 m [(17,918 þ 2,055/2)/20] versus the
€1,185 m reported by the company.
12
Thus, Cost of Sales would decline by €238 m,
increasing the Tax Expense for the year by €60 m. On the balance sheet, these changes
would increase Long-Term Tangible Assets by €238 m, increase Deferred Tax Liability
by €60 m, and increase Common Shareholders’ Equity by €178 m.
In summary, if Lufthansa were using the same depreciation method as Air France-
KLM, its financial statements for the years ended December 31, 2009 and 2008, would
have to be modified as follows:
Adjustment
December 31, 2009
...........................................................
Adjustment
December 31, 2008
...................................................
(€ Millions) Assets
Liabilities &
Equity Assets
Liabilities &
Equity
.....................................................................................................................................................
Balance Sheet
Long-Term Tangible
Assets
þ3,093
þ238
þ3,093
Deferred Tax Liability þ773 þ 60 þ773
Shareholders’
Equity
þ2,320 þ 178 þ2,320
Total Impact þ3,331 þ3,331 þ3,093 þ3,093
Income Statement
Cost of Sales −238
Tax Expense þ60
Net Income þ178
......................................................................................................................................................
Sales turnover (sales to average assets) comparisons for the two companies using
reported data show that Lufthansa has higher turnover than Air France-KLM (0.91 ver-
sus 0.81). However, analysts that make the above adjustment would observe that the full
amount of this difference is attributable to the different depreciation assumptions. After
adjustment, Lufthansa’s sales turnover declines to 0.81, identical to that of Air France-KLM.
Key Intangible Assets Off Balance Sheet
How should the analyst approach the omission of intangibles? One way is to leave the
accounting as is but to recognize that forecasts of long-term rates of return will have to
reflect the inherent biases that arise from this accounting method. A second approach is
to capitalize intangibles and amortize them over their expected lives.
For example, consider the case of Microsoft, the largest software company in the
world. Microsoft expenses its software R&D costs, arguing that all material research
and development costs are incurred before technological feasibility is reached (U.S.
GAAP allows capitalization of development costs once technical feasibility is established
until the product is released to the market). What adjustment would be required if the
analyst decided to capitalize Microsoft’s software R&D and to amortize the intangible
asset using the straight-line method over the expected life of software (approximately
three years)? Assume that R&D spending occurs evenly throughout the year and that
only half a year’s amortization is taken on the latest year’s spending. Given R&D outlays
4-18 PART 2 • Business Analysis and Valuation Tools
Copyright 2012 Cengage Learning. All Rights Reserved. May not be copied, scanned, or duplicated, in whole or in part. Due to electronic rights, some third party content may be suppressed from the eBook and/or eChapter(s).
Editorial review has deemed that any suppressed content does not materially affect the overall learning experience. Cengage Learning reserves the right to remove additional content at any time if subsequent rights restrictions require it.

for the years 2007 to 2010, the R&D asset at the end of the 2010 fiscal year (06/30/10) is
$13.2 billion, calculated as follows:
Year
R&D Outlay
($billions)
Proportion
Capitalized
06/30/10
($ billions)
Asset
06/30/10
($ billions)
Proportion
Capitalized
06/30/09
($ billions)
Asset
06/30/09
($ billions)
....................................................................................................................................................
2010 $8.7 (1 .33/2) $7.3
2009 9.0 (1 .33/2 .33) 4.5 (1 .33/2) $7.5
2008 8.2 (1 .33/2 .67) 1.4 (1 .33/2 .33) 4.1
2007 7.1
(1 .33/2 .67) 1.2
Total $13.2 $12.8
......................................................................................................................................................
The R&D amortization expenses (included in Other Operating Expenses) for 2009 and
2010 are $7.6 billion and $8.3 billion, respectively, and are calculated as follows:
Year
R&D Outlay
($billions)
Proportion
Capitalized
06/30/10
($ billions)
Expense
06/30/10
($ billions)
Proportion
Capitalized
06/30/09
($ billions)
Expense
06/30/09
($ billions)
....................................................................................................................................................
2010 $8.7 .33/2 $1.4
2009 9.0 .33 3.0 .33/2 $1.5
2008 8.2 .33 2.7 .33 2.7
2007 7.1 .33/2 1.2 .33 2.3
2006 6.6
.33/2 1.1
Total $8.3 $7.6
......................................................................................................................................................
Since Microsoft will continue to expense software R&D immediately for tax purposes,
the change in reporting method will give rise to a Deferred Tax Liability. Given a mar-
ginal tax rate of 35 percent, this liability will equal 35 percent of the value of the Long-
Term Intangible Assets reported, with the balance increasing Common Shareholders’
Equity.
In summary, the adjustments required to capitalize software R&D for Microsoft for
the years 2010 and 2009 are as follows:
Adjustment June 30, 2010
.......................................................
Adjustment June 30, 2009
....................................................
($ Billions) Assets
Liabilities &
Equity Assets
Liabilities &
Equity
..................................................................................................................................................
Balance Sheet
Long-Term Intangible
Assets
þ13.2 þ12.8
Deferred Tax Liability þ4.6 þ4.5
Common Shareholders’
Equity
þ8.6 þ8.3
Income Statement
Research and
Development
−8.7 −9.0
þ8.3 þ7.6
Tax Expense þ0.1 þ0.5
Total Expenses
−0.3 −0.9
Net Income þ0.3 þ0.9
...................................................................................................................................................
Implementing Accounting Analysis 4-19
Copyright 2012 Cengage Learning. All Rights Reserved. May not be copied, scanned, or duplicated, in whole or in part. Due to electronic rights, some third party content may be suppressed from the eBook and/or eChapter(s).
Editorial review has deemed that any suppressed content does not materially affect the overall learning experience. Cengage Learning reserves the right to remove additional content at any time if subsequent rights restrictions require it.

Adjusting R&D in this way increases Microsoft’s assets by 15 percent and lowers its return
on average assets in 2010 from 18.8 percent to 16.4 percent, enabling analysts to understand
the impact of the economic resources required to generate its earnings. Such adjustments can
also allow analysts to compare the performance of companies that follow different R&D
reporting standards or make different judgements on the treatment of these costs.
Liability Distortions
Liabilities are defined as economic obligations arising from benefits received in the past,
and for which the amount and timing is known with reasonable certainty. Liabilities
include obligations to customers that have paid in advance for products or services; com-
mitments to public and private providers of debt financing; obligations to federal and
local governments for taxes; commitments to employees for unpaid wages, pensions,
and other retirement benefits; and obligations from court or government fines or envi-
ronmental cleanup orders.
Distortions in liabilities generally arise because there is ambiguity about whether
(1) an obligation has really been incurred and/or (2) the obligation can be measured.
Has an Obligation Been Incurred?
For most liabilities there is little ambiguity about whether an obligation has been
incurred. For example, when a firm buys supplies on credit, it has incurred an obligation
to the supplier. However, for some transactions it is more difficult to decide whether
there is any such obligation. For example, if a firm announces a plan to restructure its
business by laying off employees, has it made a commitment that would justify recording
a liability? Or, if a software firm receives cash from its customers for a five-year software
license, should the firm report the full cash inflow as revenues, or should some of it
represent the ongoing commitment to the customer for servicing and supporting the
license agreement?
Can the Obligation be Measured?
Many liabilities specify the amount and timing of obligations precisely. For example, a
20-year, $100 million bond issue with an 8 percent coupon payable semi-annually specifies
that the issuer will pay the holders $100 million in 20 years, and it will pay out interest of
$4 million every six months for the duration of the loan. However, for some liabilities it is
difficult to estimate the amount of the obligation. For example, a firm that is responsible
for an environmental cleanup clearly has incurred an obligation, but the amount is highly
uncertain.
13
Similarly, firms that provide pension and post-retirement benefits for employ-
ees have incurred commitments that depend on uncertain future events, such as employee
mortality rates and future inflation rates, making valuation of the obligation subjective.
Future warranty and insurance claim obligations fall into the same category—the commit-
ment is clear but the amount depends on uncertain future events.
Accounting rules frequently specify when a commitment has been incurred and how to
measure the amount of the commitment. However, as discussed earlier, accounting rules
are imperfect—they cannot cover all contractual possibilities and reflect all of the complex-
ities of a firm’s business relationships. They also require managers to make subjective esti-
mates of future events to value the firm’s commitments. Thus the analyst may decide that
some important obligations are omitted from the financial statements or, if included, are
understated, either because of management bias or because there are legitimate differences
4-20
PART 2 • Business Analysis and Valuation Tools
Source: © Cengage Learning
Copyright 2012 Cengage Learning. All Rights Reserved. May not be copied, scanned, or duplicated, in whole or in part. Due to electronic rights, some third party content may be suppressed from the eBook and/or eChapter(s).
Editorial review has deemed that any suppressed content does not materially affect the overall learning experience. Cengage Learning reserves the right to remove additional content at any time if subsequent rights restrictions require it.
in opinion between managers and analysts over future risks and commitments. As a result,
analysis of liabilities is usually with an eye to assessing whether the firm’s financial com-
mitments and risks are understated and/or its earnings overstated.
Understated Liabi lities
Liabilities are likely to be understated when the firm has key commitments that are diffi-
cult to value and therefore not considered liabilities for financial reporting purposes.
Understatements are also likely to occur when managers have strong incentives to over-
state the soundness of the firm’s financial position or to boost reported earnings. By
understating leverage, managers present investors with a rosy picture of the firm’s finan-
cial risks. Earnings management also understates liabilities (namely deferred or unearned
revenues) when revenues are recognized upon receipt of cash, even though not all ser-
vices have been provided.
The most common forms of liabilities understatements arise when the following con-
ditions exist:
1. Unearned revenues are understated through aggressive revenue recognition. If cash
has already been received but the product or service has yet to be provided,
unearned or deferred revenues are created. This liability reflects the company’s
commitment to provide the service or product to the customer and is extinguished
once that is accomplished. Firms that recognize revenues prematurely—after the
receipt of cash but prior to fulfilling their product or service commitments to
customers—understate deferred revenue liabilities and overstate earnings. Firms
that bundle service contracts with the sale of a product are particularly prone to
deferred revenue liability understatement since separating the price of the product
from the price of the service is subjective.
2. Loans from discounted receivables are off balance sheet. As discussed earlier, receiv-
ables that are discounted with a financial institution are considered “sold” if the
“seller” cedes control over the receivables to the financier. Yet if the sale permits
the buyer to have recourse against the seller in the event of default, the seller con-
tinues to face collection risk. Given the management judgment involved in fore-
casting default and refinancing costs, as well as the incentives faced by managers
to keep debt off the balance sheet, it is important for the analyst to evaluate the
firm’s estimates for default as well as the inherent commitments that it has for dis-
counted receivables. Are the firm’s estimates reasonable? Is it straightforward to
forecast the costs of the default and prepayment risks? If not, does the analyst
need to increase the value of the recourse liability? Or, in the extreme, does the
analyst need to undo the sale and recognize a loan from the financial institution
for the discounted value of the receivables?
3. Long-term liabilities for leases are off balance sheet. As discussed earlier in the
chapter, key lease assets and liabilities can be excluded from the balance sheet if
the company structures lease transactions to fit the accounting definition of an
operating lease. Firms that groom transactions to avoid showing lease assets and
obligations will have very different balance sheets from firms with virtually identi-
cal economics but which either use capital leases or borrow from the bank to actu-
ally purchase the equivalent resources. For firms that choose to structure lease
transactions to fit the definition of an operating lease, the analyst can restate the
leases as capital leases, as discussed in the Asset Understatement section. This will
ensure that the firm’ s true financial commitments and risks will be reflected on its
balance sheet, enabling comparison with peer firms.
Implementing Accounting Analysis 4-21
Copyright 2012 Cengage Learning. All Rights Reserved. May not be copied, scanned, or duplicated, in whole or in part. Due to electronic rights, some third party content may be suppressed from the eBook and/or eChapter(s).
Editorial review has deemed that any suppressed content does not materially affect the overall learning experience. Cengage Learning reserves the right to remove additional content at any time if subsequent rights restrictions require it.

EXAMPLES OF HOW TO CORRECT FOR LIABILITY UNDERSTATEMENT
The following examples illustrate some of these types of liability understatements and
the corrections that an analyst can make to reduce bias in the financial statements.
Unearned Revenues Understated
Hansen Medical, Inc., is a U.S. provider of advanced medical robotics. Its Sensei Robotic
Catheter System was designed to allow physicians to accurately position, manipulate, and
control catheters, and had gained acceptance in hospitals globally. Typically, ownership
of the Sensei system passed to customers upon shipment, at which point revenues were
recognized. However, a large percentage of the sales contracts for systems included
installation and training. In such instances, since these services were significant, Hansen
deferred all system revenues until training and installation were completed.
The company went public in 2006 and raised funds through subsequent public offerings
in 2008, 2009, and 2010. During this period it also formed key partnership agreements with
larger medical device companies such as Philips Healthcare and GE Healthcare. However,
following its IPO, Hansen consistently missed analyst expectations and generated losses.
In October 2009, a whistleblower alleged that Hansen had recognized revenues from
the sale of some of its Sensei systems upon shipment, prior to completion of the system
installation, setup, and training. After an investigation, the company determined that it
would have to restate its financial results for 2007, 2008, and the first part of 2009, reduc-
ing revenues for these periods by $7.4 million, $6.8 million for 2008 alone. The adjustment
required to correct Hansen’s 2008 financials (as reported in its 10-K) would be as follows:
1. Sales would decline and unearned revenues (included in Other Current Liabilities)
would increase by $6.8 million.
2. Cost of Sales would decline and Deferred Cost of Sales (included in Other Current
Assets) would increase by $2.4 million to reflect the lower sales.
3. Since Hansen had reported losses since its inception, the restatement would not affect
its tax position, requiring no adjustment to Tax Expense or to Deferred Taxes.
The full effect of the adjustment on the 2008 financial statements would therefore be
as follows:
Adjustment
.........................................................................
($ millions) Assets Liabilities & Equity
..............................................................................................................................
Balance Sheet
Other Current Assets þ2.4
Other Current Liabilities þ6.8
Common Shareholders’ Equity −4.4
..............................................................................................................................
Income Statement
Sales −6.8
Cost of Sales −2.4
Net Income −4.4
...............................................................................................................................
The restatement reduced Hansen’s previously reported revenues for 2008 by 22 per-
cent and was accompanied by a drop in the firm’s stock price of 9 percent on the
announcement date, and 22 percent for the month (versus a 1 percent increase for the
S&P 500 during that same period).
Source: © Cengage Learning
4-22 PART 2 • Business Analysis and Valuation Tools
Copyright 2012 Cengage Learning. All Rights Reserved. May not be copied, scanned, or duplicated, in whole or in part. Due to electronic rights, some third party content may be suppressed from the eBook and/or eChapter(s).
Editorial review has deemed that any suppressed content does not materially affect the overall learning experience. Cengage Learning reserves the right to remove additional content at any time if subsequent rights restrictions require it.

Equity Distortions
Accounting treats stockholders’ equity as a residual claim on the firm’s assets after pay-
ing off the other claimholders. Consequently, equity distortions arise primarily from dis-
tortions in assets and liabilities. For example, distortions in assets or liabilities that affect
earnings also lead to distortions in equity. However, equity distortions can also arise that
are not captured in an asset and liability analysis. One such distortion is for hybrid
securities.
Hybrid securities include convertible debt and debt with warrants attached. These
securities are partially pure debt and partially equity. Current U.S. accounting rules do
not separate these components, typically implying that the balance sheet overstates firm
debt and understates its equity. Without adjusting for this distortion, it can be difficult
to understand the real financial risks and returns for firms with different types of
hybrids. New accounting rules being considered in a joint FASB/IASB project are likely
to address this issue by requiring securities such as convertible debt to be separated into
two components on the balance sheet, a debt component and an equity component.
Each would be valued at its fair value at the date of issue. This approach could be
adopted by the analyst.
EXAMPLE OF HOW TO CORRECT FOR EQUITY DISTORTIONS
We illustrate the equity distortion arising from the issuance of hybrid securities and the
corrections that the analyst can make to reduce bias in the financial statements.
Hybrid Securities
On October 27, 2009, Navistar International Corp. completed an offering of $550 million
of 3.0 percent Convertible Senior Subordinated Notes due in 2014. At the same time,
the company also issued $1.0 billion in Senior Unsecured Notes with an annual interest
rate of 8.25 percent. The premium for conversion rights was therefore significant.
The net present value of the $550 million convertible issue at an 8.25 percent discount
rate is $434 million, implying that the convertibility premium was worth roughly $116 mil-
lion. One way to adjust for this effect is to record the debt component at $434 million and
to show the $116 million conversion premium as part of Common Shareholders’ Equity.
Interest on the debt would then be based on the 8.25 percent coupon rate of the straight
note rather than the 3.0 percent (which reflects the conversion premium).
The effect of this adjustment on Navistar’s financial statements at December 31, 2009,
would be as follows:
Adjustment for December 31, 2009
............................................................................
($ millions) Assets Liabilities & Equity
................................................................................................................................
Balance Sheet
Long-Term Debt −116
Common Shareholders’ Equity þ116
.................................................................................................................................
Given Navistar’s high leverage, this change generates only a modest increase in its
long-term debt to total capital ratio, from 107 percent to 110 percent.
Source: © Cengage Learning
Implementing Accounting Analysis 4-23
Copyright 2012 Cengage Learning. All Rights Reserved. May not be copied, scanned, or duplicated, in whole or in part. Due to electronic rights, some third party content may be suppressed from the eBook and/or eChapter(s).
Editorial review has deemed that any suppressed content does not materially affect the overall learning experience. Cengage Learning reserves the right to remove additional content at any time if subsequent rights restrictions require it.

COMPARING COMPANIES USING U.S. GAAP AND IFRS
In Chapter 3 we discussed the joint convergence project being undertaken by FASB and
the IASB that has succeeded in reducing many of the differences between U.S. GAAP
and IFRS. Many of the remaining differences are likely to have relatively minor effects
on financial statement comparability, making it easier for analysts to compare the perfor-
mance of companies using different standards.
Nonetheless, a few important differences remain. Some of these arise from differences
in the way that U.S. and international standard setters have opted to trade-off the rele-
vance and reliability of financial information. For example, in an effort to increase the
relevance of financial information, IFRS permits companies to revalue long-term non-
financial assets that have appreciated in value. In contrast, U.S. GAAP places a stronger
weight on the reliability of financial information and precludes such upward revalua-
tions. Differences can also reflect tax factors. For example, U.S. GAAP requires that
firms that use the LIFO inventory valuation method for tax purposes follow the same
method for financial reporting. LIFO is not used widely for tax purposes outside the
United States and is not permitted under IFRS.
Table 4-4 shows some of the remaining important differences between U.S. GAAP
and IFRS. The table also discusses the types of adjustments that analysts could make
to ensure that performance comparisons of companies using the two standards are
meaningful. This adjustment exercise can be challenging, particularly if information
on the accounting effects is not disclosed. The adjustments we recommend take
TABL E 4 -4 Adjusting for Key Differences between U.S. GAAP and IFRS
Financial Statement Topic Reporting Difference Adjustment
..............................................................................................................................................................................................
Revenue Recognition
Contracts with contingent pay-
ments (e.g., research contracts
where payments are contingent on
reaching milestones)
Under U.S. GAAP revenue cannot be
recognized until the contingency is
resolved; IFRS allows recognition when
resolution of contingency is probable.
For IFRS firm, eliminate revenues
and receivables recognized prior to
the resolution of the contingency.
Also adjust cost of sales/inventory
and tax expense / deferred taxes.
..............................................................................................................................................................................................
Extraordinary Items Can be reported separately under U.S.
GAAP but not under IFRS, potentially
affecting operating income.
Either (a) separate extraordinary
items from operating income for
IFRS firms, or (b) include extraordi-
nary items in operating expenses for
U.S. firms.
..............................................................................................................................................................................................
Receivables
Factored (discounted) receivables
with recourse
Under U.S. GAAP, factored receivables
with recourse are recorded as a sale
provided control over the receivables has
been ceded to the financier and the
seller has experience estimating the value
of the recourse liability. IFRS typically
does not permit factored receivables
with recourse to be reported as a sale.
Either: (a) eliminate the gross value
of factored receivables and loans on
the balance sheet of IFRS firm and
show the bad debt allowance as a
recourse liability; or (b) add back
the receivables and loans to the U.S.
firm’s balance sheet.
..............................................................................................................................................................................................
(continued)
4-24 PART 2 • Business Analysis and Valuation Tools
Copyright 2012 Cengage Learning. All Rights Reserved. May not be copied, scanned, or duplicated, in whole or in part. Due to electronic rights, some third party content may be suppressed from the eBook and/or eChapter(s).
Editorial review has deemed that any suppressed content does not materially affect the overall learning experience. Cengage Learning reserves the right to remove additional content at any time if subsequent rights restrictions require it.
Financial Statement Topic Reporting Difference Adjustment
..............................................................................................................................................................................................
Contracts where cash receipts are
deferred
IFRS requires deferred receipts to be
discounted to their present value; U.S.
GAAP typically does not require deferred
receipts to be discounted.
For short-term receivables, this effect
should be modest. For long-term
receivables, adjust financials of IFRS
firm by (a) adding back discount to
receivables and to revenues in year of
sale; and (b) eliminating subsequent
interest income and reducing
receivables.
..............................................................................................................................................................................................
Inventory
Inventory valuation method IFRS does not permit use of LIFO as an
inventory valuation method, which is
permitted under U.S. GAAP.
Adjust U.S. company inventory bal-
ance to FIFO using LIFO reserve
data. Adjust COGS for change in
LIFO reserve. Also adjust for tax
impact (tax expense and deferred
taxes).
..............................................................................................................................................................................................
Reversal of impairments Reversals of inventory impairments are
allowed under IFRS, but are not per-
mitted under U.S. GAAP.
Eliminate inventory reversal effect for
IFRS company by deducting gain
and reducing value of inventory.
..............................................................................................................................................................................................
Long-Lived Assets
Plant, Property, and Equipment
(PPE) Valuation
IFRS allows PPE to be valued at either
historical cost or fair value; U.S. GAAP
requires measurement at historical cost.
Eliminate asset revaluations for IFRS
firms using revaluation reserve.
..............................................................................................................................................................................................
Impairment of long-lived tangible &
finite lived intangible assets
Under U.S. GAAP, an impairment
charge for the excess of carrying value
over fair value is recorded when carrying
value is greater than the value of
undiscounted cash flows. IFRS records the
impairment charge when the excess of
carrying value exceeds the fair or realiz-
able value.
Difficult to adjust.
..............................................................................................................................................................................................
Reversal of long-lived asset
impairments
U.S. GAAP does not allow reversal of
impairment; IFRS allows impairment
reversals for assets other than goodwill.
Eliminate asset reversal effect for
IFRS firms.
..............................................................................................................................................................................................
Capitalization of development
costs
U.S. GAAP requires development costs
to be expensed (except for software
development costs); IFRS allows devel-
opment costs to be capitalized if they
meet specific criteria.
Either (a) expense development
costs capitalized for IFRS firm, or
(b) capitalize all R&D costs, with
amortization over useful life for both
U.S. and IFRS firms as illustrated
earlier in this chapter.
..............................................................................................................................................................................................
Capitalization of direct response
advertising costs
U.S. GAAP requires certain direct
response advertising costs to be capi-
talized and amortized; all such costs are
expensed immediately under IFRS.
Either (a) expense direct response
advertising costs for U.S. firm, or (b)
capitalize costs for IFRS firm with
amortization over useful life.
..............................................................................................................................................................................................
(continued)
Implementing Accounting Analysis 4-25
Copyright 2012 Cengage Learning. All Rights Reserved. May not be copied, scanned, or duplicated, in whole or in part. Due to electronic rights, some third party content may be suppressed from the eBook and/or eChapter(s).
Editorial review has deemed that any suppressed content does not materially affect the overall learning experience. Cengage Learning reserves the right to remove additional content at any time if subsequent rights restrictions require it.

advantage of information that is likely to be publicly available, such as the asset re-
valuation reserve or the LIFO reserve, so that the financials of IFRS and U.S. GAAP
firms are comparable.
EXAMPLES OF ADJUSTING FOR DIFFERENCES IN
U.S. GAAP AND IFRS
The following illustrates some of the differences and the adjustments that an analyst can
make to enhance the comparability of financial statements for firms using the competing
standards.
Long-Term Asset Impairment Reversals
Consider the case of OZ Minerals, the third largest diversified mining company in Aus-
tralia, the world’s second largest producer of zinc, and a significant producer of copper,
lead, gold, and silver. OZ Minerals reports under Australian Accounting Standards,
which closely follow IFRS. In 2010 the firm announced that as a result of an improved
outlook for the global economy, record copper prices, and the strong production of its
Prominent Hill mine, it would increase pretax earnings by 201.1 million Australian dol-
lars (approximately 172 million U.S. dollars) with the reversal of a 2008 impairment of
the Prominent Hill PP&E asset. This impairment reversal increased pre-tax earnings for
OZ Minerals by 44 percent for the year.
As shown in Table 4-4, reversals of impairments are permitted by IFRS but not by
U.S. GAAP. An analyst comparing OZ Minerals’ performance with that of U.S.-based
mining companies such as Freeport-McMoRan Copper & Gold Inc., a major copper pro-
ducer that also took a significant impairment charge in 2008, could therefore add back
the reversal to OZ Minerals’ earnings (with an adjustment for tax effects) as follows:
Millions of Australian Dollars Assets Liabilities & Equity
..............................................................................................................................
Balance sheet
Long-Term Tangible Assets 201.1
Deferred Tax Liability 60.0
Common Shareholders’ Equity 141.1
Income Statement
Impairment reversal 201.1
Tax Expense (reported by OZ) 60.0
Net Income 141.1
...............................................................................................................................
Financial Statement Topic Reporting Difference Adjustment
..............................................................................................................................................................................................
Debt and Equity
Classification of compound
instruments
U.S. GAAP generally requires compound
instruments such as convertible bonds
to be classified as liabilities. IFRS
requires such instruments to be sepa-
rated into debt and equity components.
Either (a) reclassify entire instrument
as equity for IFRS firm, or (b) sepa-
rate out the two components for
U.S. firm.
..............................................................................................................................................................................................
Source: © Cengage Learning 2013
4-26 PART 2 • Business Analysis and Valuation Tools
Copyright 2012 Cengage Learning. All Rights Reserved. May not be copied, scanned, or duplicated, in whole or in part. Due to electronic rights, some third party content may be suppressed from the eBook and/or eChapter(s).
Editorial review has deemed that any suppressed content does not materially affect the overall learning experience. Cengage Learning reserves the right to remove additional content at any time if subsequent rights restrictions require it.

The add back of the impairment reversal reduces OZ Minerals’ return on equity
(ROE) from 18.4 percent to 13.9 percent.
LIFO Inventory Valuation
Caterpillar, Inc., is the world’s leading manufacturer of construction and mining
machines and related equipment. In 2010, Caterpillar used the last-in, first-out (LIFO)
valuation method for approximately 70 percent of its inventories. An analyst wanting
to compare Caterpillar with the European competitor CNH Global N.V. (which reports
using IFRS) could adjust Caterpillar’s inventory to approximate cost using the first-in,
first-out (FIFO) method, since IFRS does not permit the use of LIFO. Caterpillar reports
its LIFO reserve (the excess of estimated current costs over LIFO carrying value) as
$2,575 million in 2010 and $3,022 million in 2009. The following adjustments to Cater-
pillar’s financials reflect the cumulative effect of using LIFO at the end of FY 2009 and
the incremental impact for FY 2010:
1) Add Caterpillar’s LIFO reserve at the end of FY 2009, $3,022 million, to its inven-
tory balance at the end of 2009, to revalue inventory to FIFO.
2) The cumulative inventory adjustment also increases equity at the end of FY 2009
and will require an adjustment to the Deferred Tax Liability. Given Caterpillar’s
tax rate of 35 percent, this effect is $1,058 million.
3) To make the incremental adjustment for FY 2010, the analyst will lower inventory by
$447 million to reflect the decline in the LIFO reserve for the year ($2,575 million
$3,022 million) and increase cost of goods sold. This increase in expenses will be offset
by a decline in the tax expense for $156 million ($447 million the tax rate of
35 percent) and a decline in Deferred Tax Liability. The impact on net income and
equity is therefore $291 million ($447 million þ $156 million).
A summary of these entries is as follows:
December 31, 2010 December 31, 2009
....................................................................................................................................................
Fiscal Year Ending
($ in millions) Assets
Liabilities &
Equity Assets
Liabilities &
Equity
....................................................................................................................................................
Balance Sheet
Inventory −447 þ3,022
Deferred Tax Liability −156 þ1,058
Common Shareholders’ Equity −291 þ1,964
....................................................................................................................................................
Income Statement
Cost of Goods Sold þ447
Tax Expense −156
Total expense þ291
Net Income −291
......................................................................................................................................................
Caterpillar reports inventory turnover (cost of goods sold to average inventory) of 3.8 for
2010, the same as reported by its competitor CNH. However, after restating Caterpillar’s
financials to FIFO, its turnover declines to 2.9, indicating that it actually underperforms
its rival.
Off Balance Sheet Discounted Receivab les with Recourse
Tecumseh Products Company is a global manufacturer of compressors for residential
and commercial air conditioning and refrigeration applications. It has manufacturing
Implementing Accounting Analysis 4-27
Copyright 2012 Cengage Learning. All Rights Reserved. May not be copied, scanned, or duplicated, in whole or in part. Due to electronic rights, some third party content may be suppressed from the eBook and/or eChapter(s).
Editorial review has deemed that any suppressed content does not materially affect the overall learning experience. Cengage Learning reserves the right to remove additional content at any time if subsequent rights restrictions require it.

and assembly plants in the United States, Brazil, France, India, Canada, Mexico, Malay-
sia, and China. The company’s Brazilian and Indian subsidiaries periodically factor their
accounts receivables to financial institutions, both with and without recourse. The sale of
receivables with recourse creates a contingent liability. Tecumseh reported that in 2010
receivables sold with “limited recourse liability” amounted to $19.4 million, 15 percent of
reported receivables.
Since Tecumseh is a U.S. company, it will show the receivables factored with recourse as
sold. The financing will therefore not appear on its balance sheet as a loan, and its receivables
will be excluded from current assets. In contrast, other firms in the industry that use IFRS,
such as Ingersoll-Rand PLC, a company headquartered in Ireland, and Sandvik AB from
Sweden, show factored receivables and loans on their balance sheets. An analyst comparing
Tecumseh with either of these competitors could therefore decide to restate Tecumseh’s
financials to add back the recourse receivables sold to Tecumseh’s balance sheet as follows:
Adjustment for December 31, 2010
.......................................................................
($ millions) Assets Liabilities & Equity
......................................................................................................................
Balance Sheet
Other Current Assets þ19.4
Short-Term Debt þ19.4
.......................................................................................................................
On an unadjusted basis, Tecumseh appears to manage its receivables more closely
than its European competitors, with days’ receivable of 50.0, compared to 56.3 for Sand-
vik and 60.8 for Ingersoll-Rand. However, when factored receivables are added back to
Tecumseh’s ending 2010 accounts receivables, days’ receivable increase to 57.5, compara-
ble to its peers.
APPLICATION TO TJX AND NORDSTROM
Let us return to the TJX and Nordstrom comparison discussed in Chapter 2. Are any of
the accounting adjustments discussed in this chapter relevant to understanding the rela-
tive performance of TJX and Nordstrom? Would it make sense for an analyst covering
the two companies to make any of the adjustments?
One potentially important accounting difference is that TJX Companies, Inc.
leases virtually all of its stores using operating leases, whereas a significant portion
of Nordstrom’s stores are owned or leased under capital leases. As a result, TJX
omits many more of its critical assets and lease obligations from its balance sheet
than Nordstrom, making it challenging to compare the two f irms asset intensity
and financial leverage.
To evaluate how the difference in store ownership/leasing affects the financial perfor-
mance of TJX and Nordstrom, the analyst can use information on lease commitments
presented in the financial statement footnotes to estimate the value of the assets and lia-
bilities that are omitted from the balance sheet. The leased property is subsequently
depreciated over the life of the lease, and the lease payments are treated as interest and
debt repayment. We show these computations for TJX below and present comparable
adjustments for Nordstrom’s operating leases in Appendix B.
To estimate the value of the operating lease assets and liabilities, we use information
on the future minimum operating lease payments provided by TJX in its financial
4-28
PART 2 • Business Analysis and Valuation Tools
Source: © Cengage Learning 2013
Copyright 2012 Cengage Learning. All Rights Reserved. May not be copied, scanned, or duplicated, in whole or in part. Due to electronic rights, some third party content may be suppressed from the eBook and/or eChapter(s).
Editorial review has deemed that any suppressed content does not materially affect the overall learning experience. Cengage Learning reserves the right to remove additional content at any time if subsequent rights restrictions require it.

statement footnotes. For the years ending January 29, 2011, and January 30, 2010, these
amounts were as follows:
Year Ended (in thousands) January 29, 2011 January 30, 2010
..........................................................................................................................
Less than 1 year $1,092,709 $1,005,366
1-3 years 1,938,020 1,771,055
3-5 years 1,464,690 1,307,773
More than 5 years
2,304,674 1,610,867
Total $6,800,093 $5,695,061
...........................................................................................................................
TJX estimated the net present value of its minimum future lease obligations was
$5,572.6 million on January 29, 2011, and $4,450.2 million on January 30, 2010. In addi-
tion, it reported that the average interest rate on its long-term debt was 5.5 percent.
Based on the data on general lease terms given in the financial statements, we assume
that the average lease term is 15 years. Given this information, the analyst can make
the following adjustments to TJX’s beginning and ending balance sheets, and to its
income statement for the year ended January 29, 2011:
1. Capitalize the net present value of the minimum lease obligations as of January 30,
2010, increasing Long-Term Tangible Assets and Long-Term Debt by $4,450.2
million.
14
2. Calculate the value of any change in lease assets and lease liabilities during the year
from new lease transactions or terminations. On January 30, 2010, TJX’s liability for
operating lease commitments in 2011 and beyond was $4,450.2 million. During
2010, the company expected to repay $1,005.4 million (as per the schedule above),
comprising $244.8 million of interest (5.5 percent of $4,450.2 million) and the
remaining $760.6 million as retirement of the lease liability. If there had been no
new lease commitments added during the year, the operating lease liability on Janu-
ary 29, 2011, would therefore have been $3,689.6 million ($4,450.2 million $760.6
million). Yet TJX’s actual lease commitment on January 29, 2011, was $5,572.6 mil-
lion, indicating that it increased its leased store capacity by $1,883.0 million. TJX’s
Long-Term Tangible Assets and Long-Term Debt therefore increased by $1,883.0
million during 2010 as a result of net new lease commitments.
3. Record the change in lease asset value and expense from depreciation during the
year. Using a fifteen-year life and straight-line depreciation, the depreciation expense
for 2010 (included in Cost of Sales) is $359.4 m {[$4450.2 m þ ($1,883.0 m/2)]/15}.
4. Add back the lease expense in the income statement, included in Cost of Sales, and
apportion the payment between Interest Expense and repayment of Long-Term
Debt. As previously mentioned, the lease expense is $1,005.4 million. As noted
above, this reflects $244.8 million ($4,450.2 m 5.5 percent) that is shown as
Interest Expense and the remaining $760.6 million is allocated toward retiring the
total operating lease liability.
5. Make changes to the Deferred Tax Liability to reflect differences in earnings under
the capital and operating methods. If it capitalizes operating leases, TJX’s expenses
are $604.2 million ($359.4 million depreciation expense plus $244.8 million interest
expense) versus $1,005.4 million under the operating method, a difference of
$401.2 million. TJX will not change its tax books, but for financial reporting pur-
poses it will show higher earnings before tax and thus a higher Tax Expense
through deferred taxes. Given a corporate tax rate of 35 percent, Tax Expense will
increase by $140.4 million ($401.2 million x .35) and the Deferred Tax Liability
will increase by the same amount for the year ended January 29, 2011.
Implementing Accounting Analysis 4-29
Copyright 2012 Cengage Learning. All Rights Reserved. May not be copied, scanned, or duplicated, in whole or in part. Due to electronic rights, some third party content may be suppressed from the eBook and/or eChapter(s).
Editorial review has deemed that any suppressed content does not materially affect the overall learning experience. Cengage Learning reserves the right to remove additional content at any time if subsequent rights restrictions require it.

In summary, the adjustments to TJX’s financial statements on January 30, 2010, and
January 29, 2011, are as follows:
Adjustment January 29, 2011 Adjustment January 30, 2010
.....................................................................................................................................................
($ Billions) Assets
Liabilities &
Equity Assets
Liabilities &
Equity
.....................................................................................................................................................
Balance Sheet
Long-term tangible
assets
(1) þ4,450.2
(2) þ1,883.0
(3) −359.4
(1) þ4,450.2
Long-term debt (1) þ4,450.2
(2) þ1,883.0
(4) −760.6
(1) þ4,450.2
Deferred taxes (5) þ140.4
Shareholders’ equity þ260.8
.....................................................................................................................................................
Income Statement
Cost of sales (3) þ359.4
(4) −1005.4
Net interest expense (4) þ244.8
Tax expense (5) þ
140.4
Total increase in
expense
−260.8
Net Income þ260.8
......................................................................................................................................................
The increase in both TJX’s long term asset and liability balances and related income
statement impact resulting from the above adjustment significantly alters many of the
financial ratios that an analyst uses to understand and categorize a firm’s performance.
In the next chapter we will look at these ratios in detail, comparing TJX and Nordstrom
on both an unadjusted and adjusted basis.
SUMMARY
To implement accounting analysis, the analyst must first recast the financial statements
into a common format so that financial statement terminology and formatting is compa-
rable between firms and across time. A standard template for recasting the financials,
presented in this chapter, is used throughout the remainder of the book.
Once the financial statements are standardized, the analyst can determine what
accounting distortions exist in the firm’s assets, liabilities, and equity. Common distor-
tions that overstate assets include delays in recognizing asset impairments, underesti-
mated reserves, aggressive revenue recognition leading to overstated receivables, and
optimistic assumptions on long-term asset depreciation. Asset understatements can
arise if managers overstate asset write-offs, use operating leases to keep assets off the bal-
ance sheet, or make conservative assumptions for asset depreciation. They can also arise
because accounting rules require outlays for key assets (e.g., R&D and brands) to be
immediately expensed. For liabilities, the primary concern for the analyst is whether the
firm understates its real commitments. This can arise from off-balance liabilities (e.g.,
operating lease obligations), and from aggressive revenue recognition that understates
unearned revenue obligations. Equity distortions frequently arise when there are distor-
tions in assets and liabilities. However, they can also arise if firms issue hybrid securities.
4-30 PART 2 • Business Analysis and Valuation Tools
Copyright 2012 Cengage Learning. All Rights Reserved. May not be copied, scanned, or duplicated, in whole or in part. Due to electronic rights, some third party content may be suppressed from the eBook and/or eChapter(s).
Editorial review has deemed that any suppressed content does not materially affect the overall learning experience. Cengage Learning reserves the right to remove additional content at any time if subsequent rights restrictions require it.

Adjustments for distortions can, therefore, arise because accounting standards,
although applied appropriately, do not reflect a firm’s economic reality. They can also
arise if the analyst has a different point of view from management about the estimates
and assumptions made in preparing the financial statements. Finally, adjustments may
be necessary for the analyst seeking to compare companies reporting under different
accounting standards (broadly represented as U.S. GAAP and IFRS) in order to ensure
that the data to be analyzed are comparable.
Once distortions have been identified, the analyst can use footnote and cash flow
statement information to make adjustments to the balance sheet at the beginning and/
or end of the current year, as well as any needed adjustments to revenues and expenses
in the latest income statement. This ensures that the most recent financial ratios used to
evaluate a firm’s performance and to forecast its future results are based on financial data
that appropriately reflect its business economics.
Several points are worth remembering when doing accounting analysis. First, the bulk of
the analyst’s time and energy should be focused on evaluating and adjusting accounting pol-
icies and estimates that describe the firm’s key strategic value drivers. Of course, this does
not mean that management bias is not reflected in other accounting estimates and policies,
and the analyst should certainly examine these. But given the importance of evaluating how
the firm is managing its key success factors and risks, the bulk of the accounting analysis
should be spent examining those policies that represent these key factors and risks.
It is also important to recognize that many accounting adjustments can only be
approximations rather than precise calculations since much of the information necessary
for making precise adjustments is not disclosed. The analyst should therefore try to avoid
worrying about being overly precise in making accounting adjustments. By making even
crude adjustments, it is usually possible to mitigate some of the limitations of accounting
standards and problems of management bias in financial reporting.
DISCUSSION QUESTIONS
1. Use the templates shown in Tables 4-1, 4-2, and 4-3 to recast the following financial
statements for Nordstrom, Inc.
Nordstrom, Inc. Consolidated Balance Sheets
(in millions)
January 29, 2011 January 30, 2010
..............................................................................................................................................
Assets
Current assets:
Cash and cash equivalents $ 1,506 $795
Accounts receivable, net 2,026 2,035
Merchandise inventories 977 898
Current deferred tax assets, net 236 238
Prepaid expenses and other 79 88
Total current assets 4,824 4,054
Land, buildings and equipment
(net of accumulated depreciation
of $3,520 and $3,316)
2,318 2,242
Goodwill 53 53
Other assets 267 230
Total assets $ 7,462 $ 6,579
...............................................................................................................................................
Implementing Accounting Analysis 4-31
Copyright 2012 Cengage Learning. All Rights Reserved. May not be copied, scanned, or duplicated, in whole or in part. Due to electronic rights, some third party content may be suppressed from the eBook and/or eChapter(s).
Editorial review has deemed that any suppressed content does not materially affect the overall learning experience. Cengage Learning reserves the right to remove additional content at any time if subsequent rights restrictions require it.
Nordstrom, Inc. Consolidated Balance Sheets
(in millions)
January 29, 2011 January 30, 2010
..............................................................................................................................................
Liabilities and Shareholders’ Equity
Current liabilities:
Accounts payable $ 846 $ 726
Accrued salaries, wages and
related benefits
375 336
Other current liabilities 652 596
Current portion of long-term
debt
6 356
Total current liabilities 1,879 2,014
Long-term debt, net 2,775 2,257
Deferred property incentives, net 495 469
Other liabilities 292 267
Commitments and contingencies
Shareholders’ equity:
Common stock, no par value:
1,000 shares authorized; 218.0
and 217.7 share issued and
outstanding
1,168 1,066
Retained earnings 882 525
Accumulated other comprehen-
sive loss
(29) (19)
Total shareholders’ equity 2,021 1,572
Total liabilities and shareholders’
equity
$ 7,462 $ 6,579
...............................................................................................................................................
Source: Nordstrom, Inc. SEC 10-K filed March 18, 2011.
Nordstrom, Inc. Consolidated Statements of Earnings
(in millions)
Fiscal Year 2010 2009 2008
....................................................................................................................................................
Net sales $ 9,310 $ 8,258 $ 8,272
Credit card revenues 390 369 301
Total revenues 9,700 8,627 8,573
Cost of sales and related buying
and occupancy costs
(5,897) (5,328) (5,417)
Selling, general and administra-
tive expenses:
Retail (2,412) (2,109) (2,103)
Credit (273) (356) (274)
Earnings before interest and in-
come taxes
1,118 834 779
Interest expense, net (127) (138) (131)
Earnings before income taxes 991 696 648
Income tax expense (378) (255) (247)
Net earnings $ 613 $ 441 $ 401
......................................................................................................................................................
Source: Nordstrom, Inc. SEC 10-K filed March 18, 2011.
4-32 PART 2 • Business Analysis and Valuation Tools
Copyright 2012 Cengage Learning. All Rights Reserved. May not be copied, scanned, or duplicated, in whole or in part. Due to electronic rights, some third party content may be suppressed from the eBook and/or eChapter(s).
Editorial review has deemed that any suppressed content does not materially affect the overall learning experience. Cengage Learning reserves the right to remove additional content at any time if subsequent rights restrictions require it.
Nordstrom, Inc. Consolidated Statements of Cash Flows
(in millions)
Fiscal Year 2010 2009 2008
....................................................................................................................................................
Operating Activities
Net earnings $ 613 $ 441 $ 401
Adjustments to reconcile net earnings to net cash
provided by operating activities:
Depreciation and amortization of buildings and
equipment
327 313 302
Amortization of deferred property incentives and
other, net
(54) (42) (21)
Deferred income taxes, net 2 (58) (36)
Stock-based compensation expense 42 32 28
Tax benefit from stock-based compensation 15 6 3
Excess tax benefit from stock-based compensation (16) (7) (4)
Provision for bad debt expense 149 251 173
Change in operating assets and liabilities:
Accounts receivable (74) (159) (93)
Merchandise inventories (80) (1) 53
Prepaid expenses and other assets 1 (38) 38
Accounts payable 72 168 16
Accrued salaries, wages and related benefits 37 120 (54)
Other current liabilities 42 81 (48)
Deferred property incentives 95 96 119
Other liabilities 6 48 (29)
Net cash provided by operating activities 1,177 1,251 848
Investing activities
Capital expenditures (399) (360) (563)
Change in credit card receivables originated at
third parties
(66) (182) (232)
Other, net 3 1 3
Net cash used in investing activities (462) (541) (792)
Financing activities
(Repayments) proceeds from commercial paper
borrowings
– (275) 275
Proceeds from long-term borrowings, net of
discounts
498 399 150
Principal payments on long-term borrowings (356) (25) (410)
Increase in cash book overdrafts 37 9 20
Cash dividends paid (167) (139) (138)
Repurchase of common stock (84) – (264)
Proceeds from exercise of stock options 35 21 13
Proceeds from employee stock purchase plan 13 13 17
Excess tax benefit from stock-based compensation 16 7 4
Other, net 4 3 (9)
Net cash (used in) provided by financing activities (4) 13 (342)
Net increase (decrease) in cash and cash equivalents 711 723 (286)
Cash and cash equivalents at beginning of year 795 72 358
Cash and cash equivalents at end of year $1,506 $ 795 $ 72
......................................................................................................................................................
Source: Nordstrom, Inc. SEC 10-K filed March 18, 2011.
Implementing Accounting Analysis 4-33
Copyright 2012 Cengage Learning. All Rights Reserved. May not be copied, scanned, or duplicated, in whole or in part. Due to electronic rights, some third party content may be suppressed from the eBook and/or eChapter(s).
Editorial review has deemed that any suppressed content does not materially affect the overall learning experience. Cengage Learning reserves the right to remove additional content at any time if subsequent rights restrictions require it.
2. Refer to the Creative Technology example on delaying write-downs of current assets.
How much excess inventory do you estimate Creative Technology is holding in
March 2005 if the firm’s optimal days’ inventory is 100 days? Calculate the inven-
tory impairment charge for Creative Technology if 50 percent of this excess inven-
tory is deemed worthless? Record the changes to Creative Technology’s financial
statements from adjusting for this impairment.
3. U.S.-based American International Group, Inc. (AIG) is one of the world’s largest
insurance companies, offering property, casualty, life insurance, and retirement ser-
vices to customers in more than 130 countries. In its 2010 10-K report to the SEC, it
discloses the following information on the loss reserves created for claims originat-
ing in 2000:
(in millions)
...................................................................................................
Net reserves held in 2000: $ 26,971
...................................................................................................
Cumulative net liability paid as of:
One year later $ 9,709
Two years later 17,149
Three years later 21,930
Four years later 26,090
Five years later 29,473
Six years later 32,421
Seven years later 34,660
Eight years later 36,497
Nine years later 38,943
Ten years later 40,153
Net reserves for 2000 re-estimated as of:
...................................................................................................
One year later $26,979
Two years later 30,696
Three years later 32,732
Four years later 36,210
Five years later 41,699
Six years later 43,543
Seven years later 44,475
Eight years later 45,767
Nine years later 47,682
Ten years later 50,422
Net redundancy (deficiency) $(23,451)
....................................................................................................
Was the initial estimate for loss reserves originating in 2000 too low or too high?
How has the firm updated its estimate of this obligation over time? What percentage
of the original liability remains outstanding for 2000 claims at the end of 2010? As a
financial analyst, what questions would you have for the CFO on its 2000 liability?
4. AMR, the parent of American Airlines, provides the following footnote information
on its capital and operating leases:
AMR’s subsidiaries lease various types of equipment and property, primarily
aircraft and airport facilities. The future minimum lease payments required
under capital leases, together with the present value of such payments, and
4-34
PART 2 • Business Analysis and Valuation Tools
Copyright 2012 Cengage Learning. All Rights Reserved. May not be copied, scanned, or duplicated, in whole or in part. Due to electronic rights, some third party content may be suppressed from the eBook and/or eChapter(s).
Editorial review has deemed that any suppressed content does not materially affect the overall learning experience. Cengage Learning reserves the right to remove additional content at any time if subsequent rights restrictions require it.

future minimum lease payments required under operating leases that have ini-
tial or remaining non-cancellable lease terms in excess of one year as of
December 31, 2010, were (in millions):
Year Ending December 31 Capital Leases Operating Leases
........................................................................................................................................
2011 $186 $1,254
2012 136 1,068
2013 120 973
2014 98 831
2015 87 672
2016 and thereafter
349 6,006
$976 $10,804
Less amount representing interest
Present value of net minimum lease payments
$372
$604
........................................................................................................................................
AMR further disclosed that “lease terms vary but are generally six to 25 years for
aircraft and seven to 40 years for other leased property and equipment.” Assuming
that all leases are for aircraft with an average lease term of 15 years, what interest
rate does AMR use to capitalize its capital leases? Use this rate to capitalize AMR’s
operating leases at December 31, 2010. Record the adjustment to AMR’s balance
sheet to reflect the capitalization of operating leases. How would this reporting
change affect AMR’s Income Statement in 2011?
5. In 2011, Tata became the first Indian brand to be named in the top 50 global brands
in Brand Finance’s 2011 Global 500 report, which assigned the Tata brand a value of
$15.8 billion. What approaches would you use to estimate the value of brands? What
assumptions underlie these approaches? As a financial analyst, what would you use
to assess whether the brand value assigned by Brand Finance was a reasonable
reflection of the future benefits from this brand? What questions would you raise
with the firm’s CFO about the firm’s brand assets?
6. As the C FO of a company, what indicat ors would you look at to assess whether
your firm’s long-term assets were impaired? What approaches could be used,
either by management or an independent valuation firm, to asses s the dollar
value of any asset impairment? As a financial analyst, what indicators would you
look at to asses s whether a firm’s long-term assets were im paired? What questions
would you raise with the firm’sCFOaboutanychargestakenforasset
impairment?
7. The cigarette industry is subject to litigation for health hazards posed by its pro-
ducts. The industry has been in an ongoing process of negotiating a settlement of
these claims with state and federal governments. As the CFO for Altria Group, the
parent company of Philip Morris, one of the larger firms in the industry, what infor-
mation would you report to investors in the annual report on the firm’s litigation
risks? How would you assess whether the firm should record a liability for this
risk, and if so, what approach would you use to assess the value of this liability? As
a financial analyst following Altria, what questions would you raise with the CEO
over the firm’s litigation liability?
8. Refer to the Lufthansa example on asset depreciation estimates. What adjustments
would be required if Lufthansa’s aircraft depreciation were computed using an aver-
age life of 25 years and salvage value of 5 percent (instead of the reported values of
12 years and 15 percent)? Show the adjustments to the 2008 and 2009 balance
sheets, and to the 2009 income statement.
Implementing Accounting Analysis 4-35
Copyright 2012 Cengage Learning. All Rights Reserved. May not be copied, scanned, or duplicated, in whole or in part. Due to electronic rights, some third party content may be suppressed from the eBook and/or eChapter(s).
Editorial review has deemed that any suppressed content does not materially affect the overall learning experience. Cengage Learning reserves the right to remove additional content at any time if subsequent rights restrictions require it.

9. In early 2003, Bristol-Myers Squibb announced that it would have to restate its
financial statements as a result of stuffing as much as $3.35 billion worth of pro-
ducts into wholesalers’ warehouses from 1999 through 2001. The company’s sales
and cost of sales during this period was as follows:
($ millions) 2001 2000 1999
....................................................................................................................................
Net sales $18,139 $17,695 $16,502
Cost of products sold 5,454 4,729 4,458
.....................................................................................................................................
The company’s marginal tax rate during the three years was 35 percent. What adjust-
ments are required to correct Bristol-Myers Squibb’s balance sheet for December 31,
2001? What assumptions underlie your adjustments? How would you expect the
adjustments to affect Bristol-Myers Squibb’s performance in the coming few years?
NOTES
1. If a firm ’s primary business income is from rentals, rental income will be classified
as Sales, rather than Investment Income.
2. The IASB and FASB are currently considering a proposal for all lease commitments
to be capitalized and shown as an asset and liability on the lessee’s balance sheet.
3. See P. Healy, S. Myers, and C. Howe, “R&D Accounting and the Tradeoff Between
Relevance and Objectivity,” Journal of Accounting Research 40 (June 2002): 677–711,
for an analysis of the value of capitalizing R&D and then annually assessing
impairment.
4. J. Elliott and D. Hanna find that the market anticipates large write-downs by about
one quarter, consistent with managers’ reluctance to take write-downs on a timely
basis. See “Repeated Accounting Write-Offs and the Information Content of
Earnings,” Journal of Accounting Research 34, Supplement, 1996.
5. J. Francis, D. Hanna, and L. Vincent find that management is more likely to exercise
judgment in its self-interest for goodwill write-offs and restructuring charges than
for inventory or PP&E write-offs. See “Causes and Effects of Discretionary Asset
Write-Offs,” Journal of Accounting Research 34, Supplement, 1996.
6. P. Healy, K. Palepu, and R. Ruback find that acquisitions added value for only one-
third of the 50 largest acquisitions during the early 1980s, suggesting that acquirers
frequently do not recover goodwill. See “Which Takeovers Are Profitable—Strategic
or Financial?” Sloan Management Review, Summer 1997.
7. Managers can avoid capitalizing leases by assuming long asset lives (that get around
the 75 percent of asset life rule) and high discount rates (to avoid violating the
90 percent of present value rule). Research indicates that some firms responded to
the adoption of SFAS 13, which changed the rules for lease capitalization, by groom-
ing transactions to avoid having to capitalize leases. See E. Imhoff and J. Thomas,
“Economic Consequences of Accounting Standards: The Lease Disclosure Rule
Change,” Journal of Accounting & Economics 10 (December 1988): 277–311, and
S. El-Gazzar, S. Lilien, and V. Pastena, “Accounting for Leases by Lessees,” Journal
of Accounting & Economics 8 (October 1986): 217 –238. FASB has responded by
issuing ten standards on leases, five interpretations, ten technical bulletins, and
27 EITFs, many designed to reduce managers’ ability to avoid capitalizing leases.
4-36
PART 2 • Business Analysis and Valuation Tools
Copyright 2012 Cengage Learning. All Rights Reserved. May not be copied, scanned, or duplicated, in whole or in part. Due to electronic rights, some third party content may be suppressed from the eBook and/or eChapter(s).
Editorial review has deemed that any suppressed content does not materially affect the overall learning experience. Cengage Learning reserves the right to remove additional content at any time if subsequent rights restrictions require it.

8. E. Imhoff, R. Lipe, and D. Wright show that adjustments to capitalize operating
leases have a significant impact on leverage and other key financial ratios.
See “Operating Leases: Impact of Constructive Capitalization,” Accounting Horizons
5 (March 1991): 51–64.
9. P. Healy, S. Myers, and C. Howe, “R&D Accounting and the Tradeoff Between Rel-
evance and Objectivity,” Journal of Accounting Research 40 (June 2002): 677–711,
show that the magnitude of this bias is sizable.
10. See B. Bublitz and M. Ettredge, “The Information in Discretionary Outlays: Adver-
tising, Research and Development,” The Accounting Review 64 (1989): 108–124;
S. Chan, J. Martin, and J. Kensinger, “Corporate Research and Development Expen-
ditures and Share Value,” Journal of Financial Economics 26 (1990): 255–276;
R. Dukes,” An Investigation of the Effects of Expensing Research and Development
Costs on Security Prices,” in proceedings of the conference on topical research in
accounting (New York University, 1976); J. Elliott, G. Richardson, T. Dyckman, and
R. Dukes,” The Impact of SFAS No. 2 on Firm Expenditures on Research and Devel-
opment: Replications and Extensions,” Journal of Accounting 22 (1984): 85–102;
M. Hirschey and J. Weygandt,” Amortization Policy for Advertising and Research
and Development Expenditures,” Journal of Accounting Research 23 (1985): 326–335;
C. Wasley and T. Linsmeier, “A Further Examination of the Economic Consequences
of SFAS No. 2,” Journal of Accounting Research 30 (1992): 156–164; E. Eccher, “Dis-
cussion of the Value Relevance of Intangibles: The Case of Software Capitalization,”
Journal of Accounting Research 36 (1998): 193–198; B. Lev and T. Sougiannis, “The
Capitalization, Amortization, and Value-Relevance of R&D,” Journal of Accounting
and Economics 21 (1996): 107–138; and D. Aboody and B. Lev, “The Value-
Relevance of Intangibles: The Case of Software Capitalization” (working paper,
University of California, 1998).
11. See Lufthansa, Annual Report 2009 (Cologne, Germany: Deutsche Lufthansa AG,
2010) and Air France-KLM 2009–10 Reference Document (Paris, France: Air
France-KLM, 2010).
12. Lufthansa, Annual Report 2009 (Cologne, Germany: Deutsche Lufthansa AG, 2010).
13. M. Barth and M. McNichols discuss ways for investors to estimate the value of environ-
mental liabilities. See “Estimation and Market Valuation of Environmental Liabilities
Relating to Superfund Sites,” Journal of Accounting Research 32, Supplement, 1994.
14. When a firm records a capital lease, the Long-Term Tangible Asset equals the
Long-Term Debt only at inception. Thereafter, the two numbers are unequal because
the asset is reduced by depreciation expense while the debt is reduced by the lease pay-
ment net of interest expense. For most companies it is not possible to learn the book
value of the asset, requiring the analyst to record the asset at the same value as the debt.
APPENDIX A Recasting Financial Statements into Standardized Templates
The following tables show the financial statements for The TJX Companies, Inc. for the
year ended January 2011, both as reported by the company and as standardized using
the classifications discussed in this chapter. The first column in each reported financial
statement presents the classifications that are used for each line item to standardize the
statements. Note that the classifications are not applied to subtotal lines such as Total cur-
rent assets or Net income. The recast financial statements for TJX are prepared by simply
Implementing Accounting Analysis 4-37
Copyright 2012 Cengage Learning. All Rights Reserved. May not be copied, scanned, or duplicated, in whole or in part. Due to electronic rights, some third party content may be suppressed from the eBook and/or eChapter(s).
Editorial review has deemed that any suppressed content does not materially affect the overall learning experience. Cengage Learning reserves the right to remove additional content at any time if subsequent rights restrictions require it.

totalling the balances of line items with the same standard classifications. For example, on
the balance sheet there are two line items classified as Other Current Assets – Prepaid
expenses and other current assets and Current deferred income taxes, net.
The TJX Companies, Inc. Reported Consolidated Balance Sheet
(In thousands)
Fiscal Year Ended
January 29,
2011
January 30,
2010
.....................................................................................................................................................
Classifications: Assets
Current assets:
Cash and Marketable
Securities
Cash and cash equivalents $1,741,751 $1,614,607
Cash and Marketable
Securities
Short-term investments 76,261 130,636
Accounts Receivable Accounts receivable, net 200,147 148,126
Inventory Merchandise inventories 2,765,464 2,532,318
Other Current Assets Prepaid expenses and other
current assets
249,832 255,707
Other Current Assets Current deferred income
taxes, net
66,072 122,462
Total current assets
5,099,527 4,803,856
Property at cost:
Long-Term Tangible
Assets
Land and buildings 320,633 281,527
Long-Term Tangible
Assets
Leasehold costs and
improvements
2,112,151 1,930,977
Long-Term Tangible
Assets
Furniture, fixtures and
equipment
3,256,446 3,087,419
Total property at cost
5,689,230 5,299,923
Long-Term Tangible
Assets
Less accumulated deprecia-
tion and amortization
3,239,429 3,026,041
Net property at cost
2,449,801 2,273,882
Long-Term Tangible
Assets
Property under capital lease,
net of accumulated amorti-
zation of $21,591 and
$19,357, respectively
10,981 13,215
Other Long-Term Assets Other assets 231,518 193,230
Long-Term Intangible
Assets
Goodwill and trademark,
net of amortization
179,936 179,794
Total assets
$ 7,971,763 $ 7,463,977
Liabilities
Current liabilities:
Short-Term Debt Obligation under capital
lease due within one year
$ 2,727 $ 2,355
Accounts Payable Accounts payable 1,683,929 1,507,892
Other Current Liabilities Accrued expenses and other
current liabilities
1,347,951 1,248,002
Other Current Liabilities Federal, foreign, and state
income taxes payable
98,514 136,737
Total current liabilities
3,133,121 2,894,986
Other Long-Term
Liabilities
Other long-term liabilities 709,321 697,099
(continued)
4-38 PART 2 • Business Analysis and Valuation Tools
Copyright 2012 Cengage Learning. All Rights Reserved. May not be copied, scanned, or duplicated, in whole or in part. Due to electronic rights, some third party content may be suppressed from the eBook and/or eChapter(s).
Editorial review has deemed that any suppressed content does not materially affect the overall learning experience. Cengage Learning reserves the right to remove additional content at any time if subsequent rights restrictions require it.

Fiscal Year Ended
January 29,
2011
January 30,
2010
.....................................................................................................................................................
Deferred Taxes Non-current deferred income
taxes, net
241,905 192,447
Long-Term Debt Obligation under capital lease,
less portion due within one
year
13,117 15,844
Long-Term Debt Long-term debt, exclusive
of current installments
774,400 774,325
Other Long-Term
Liabilities
Commitments and
contingencies
––
Shareholders’ equity
Common Shareholders’
Equity
Common stock, authorized
1,200,000,000 shares, par
value $1, issued and out-
standing 389, 657, 340, and
409,386,126 respectively
389,657 409,386
Common Shareholders’
Equity
Additional paid in capital ––
Common Shareholders’
Equity
Accumulated other compre-
hensive income (loss)
(91,755) (134,124)
Common Shareholders’
Equity
Retained earnings 2,801,997 2,614,014
Total shareholders’ equity
3,099,899 2,889,276
Total liabilities and
shareholders’ equity
$ 7,971,763 $ 7,463,977
......................................................................................................................................................
Source: The TJX Companies, Inc. SEC 10-K filed March 30, 2011.
The TJX Companies, Inc. Reported Consolidated Statements of Income
(in thousands)
Fiscal Year Ended
January 29,
2011
January 30,
2010
January 31,
2009
......................................................................................................................................................
Classifications:
(53 weeks)
Sales Net sales $ 21,942,193 $ 20,288,444 $ 18,999,505
Cost of Sales Cost of sales,
including buying
and
occupancy costs
16,040,461 14,968,429 14,429,185
SG&A Selling, general and
administrative
expenses
3,710,053 3,328,944 3,135,589
Other Operating
Expense
Provision (credit) for
computer intru-
sion related costs
(11,550) – (30,500)
(continued)
Implementing Accounting Analysis 4-39
Copyright 2012 Cengage Learning. All Rights Reserved. May not be copied, scanned, or duplicated, in whole or in part. Due to electronic rights, some third party content may be suppressed from the eBook and/or eChapter(s).
Editorial review has deemed that any suppressed content does not materially affect the overall learning experience. Cengage Learning reserves the right to remove additional content at any time if subsequent rights restrictions require it.

The TJX Companies, Inc. Reported Consolidated Statements of Income
(in thousands)
Fiscal Year Ended
January 29,
2011
January 30,
2010
January 31,
2009
....................................................................................................................................................
Net Interest
Expense
(Income)
Interest expense, net 39,137 39,509 14,291
Income from
continuing
Operations before
provision for
income taxes
2,164,092 1,951,562 1,450,940
Tax Expense Provision for income
taxes
824,562 737,990 536,054
Income from
continuing
Operations
1,339,530 1,213,572 914,886
Unusual Gains,
Net of Unusual
Losses
Gain (loss) from
discontinued
operations, net
of income taxes
3,611 – (34,269)
Net income
$ 1,343,141 $ 1,213,572 $ 880,617
......................................................................................................................................................
Source: The TJX Companies, Inc. SEC 10-K filed March 30, 2011.
The TJX Companies, Inc. Reported Consolidated Statements of Cash Flows
(in thousands)
Fiscal Year Ended
January 29,
2011
January 30,
2010
January 31,
2009
.....................................................................................................................................................
Classifications:
Cash flows from
operating
activities:
Net Income Net income $1,343,141 $1,213,572 $880,617
Adjustments to
reconcile net
income to net
cash provided
by operating
activities:
Long-Term
Operating
Accruals –
Depreciation and
Amortization
Depreciation and
amortization
458,052 435,218 401,707
Long-Term Operat-
ing Accruals –
Other
Assets of discontin-
ued operations
sold
––31,328
Long-Term Operat-
ing Accruals –
Other
Loss on property
disposals and im-
pairment charges
96,073 10,270 23,903
(continued)
4-40 PART 2 • Business Analysis and Valuation Tools
Copyright 2012 Cengage Learning. All Rights Reserved. May not be copied, scanned, or duplicated, in whole or in part. Due to electronic rights, some third party content may be suppressed from the eBook and/or eChapter(s).
Editorial review has deemed that any suppressed content does not materially affect the overall learning experience. Cengage Learning reserves the right to remove additional content at any time if subsequent rights restrictions require it.

Fiscal Year Ended
January 29,
2011
January 30,
2010
January 31,
2009
.....................................................................................................................................................
Long-Term Operat-
ing Accruals –
Other
Deferred income tax
Provision
50,641 53,155 132,480
Long-Term Operat-
ing Accruals –
Other
Share-based
compensation
58,804 55,145 51,229
Long-Term Operat-
ing Accruals –
Other
Excess tax benefits
from share-based
compensation
(28,095) (17,494) (18,879)
Changes in assets
and liabilities:
Net (Investments in)
or Liquidation of
Operating Work-
ing Capital
(Increase) in
accounts
Receivable
(23,587) (1,862) (8,245)
Net (Investments in)
or Liquidation of
Operating Work-
ing Capital
Decrease (increase)
in Merchandise
inventories
(211,823) 147,805 (68,489)
Net (Investments in)
or Liquidation of
Operating Work-
ing Capital
Decrease (increase)
in prepaid ex-
penses and other
current assets
495 21,219 (118,830)
Net (Investments in)
or Liquidation of
Operating Work-
ing Capital
Increase (decrease)
in accounts
payable
163,823 197,496 (141,580)
Net (Investments in)
or Liquidation of
Operating Work-
ing Capital
Increase (decrease)
in accrued ex-
penses and other
liabilities
77,846 31,046 (34,525)
Net (Investments in)
or Liquidation of
Operating Work-
ing Capital
(Decrease) increase
in income taxes
payable
(11,801) 152,851 (10,488)
Long-Term Operat-
ing Accruals –
Other
Other 2,912 (26,495) 34,344
Net cash provided
by operating
activities
$ 1,976,481 $ 2,271,926 $ 1,154,572
Cash flow from in-
vesting activities:
Net (Investments in)
or Liquidation of
Operating Long-
Term Assets
Property additions (707,134) (429,282) (582,932)
(continued)
Implementing Accounting Analysis 4-41
Copyright 2012 Cengage Learning. All Rights Reserved. May not be copied, scanned, or duplicated, in whole or in part. Due to electronic rights, some third party content may be suppressed from the eBook and/or eChapter(s).
Editorial review has deemed that any suppressed content does not materially affect the overall learning experience. Cengage Learning reserves the right to remove additional content at any time if subsequent rights restrictions require it.

The TJX Companies, Inc. Reported Consolidated Statements of Cash Flows
(in thousands)
Fiscal Year Ended
January 29,
2011
January 30,
2010
January 31,
2009
.....................................................................................................................................................
Net (Investments in)
or Liquidation of
Operating Long-
Term Assets
Proceeds to settle
net investment
hedges
––14,379
Net (Investments in)
or Liquidation of
Operating Long-
Term Assets
Purchase of short-
term investments
(119,530) (278,692) –
Net (Investments in)
or Liquidation of
Operating Long-
Term Assets
Sales and maturities
of short-term
investments
180,116 153,275 –
Net (Investments in)
or Liquidation of
Operating Long-
Term Assets
Other (1,065) (5,578) (34)
Net cash (used in)
investing activities
$ (647,613) $ (560,277) $ (568,587)
Cash flows from fi-
nancing activities:
Net Debt
(Repayment)
or Issuance
Proceeds from issu-
ance of long-term
debt
– 774,263 –
Net Debt
(Repayment)
or Issuance
Principal payments
on current portion
of long-term debt
– (393,573) –
Net Debt
(Repayment)
or Issuance
Cash payments for
debt issuance
expenses
(3,118) (7,202) –
Net Debt
(Repayment)
or Issuance
Payments on capital
lease obligation
(2,355) (2,174) (2,008)
Net Stock
(Repurchase)
or Issuance
Cash payments for
repurchase of
common stock
(1,193,380) (944,762) (751,097)
Net Stock
(Repurchase)
or Issuance
Proceeds from issu-
ance of common
stock
176,159 169,862 142,154
Net Stock
(Repurchase)
or Issuance
Excess tax benefits
from share-based
compensation
28,095 17,494 18,879
Dividend
(payments)
Cash dividends paid (229,329) (197,662) (176,749)
Net cash (used in)
financing
activities
$ (1,223,928) $ (583,754) $ (768,821)
Non-operating
Losses (Gains)
Effect of exchange
rate changes on
cash
22,204 33,185 (96,249)
(continued)
4-42 PART 2 • Business Analysis and Valuation Tools
Copyright 2012 Cengage Learning. All Rights Reserved. May not be copied, scanned, or duplicated, in whole or in part. Due to electronic rights, some third party content may be suppressed from the eBook and/or eChapter(s).
Editorial review has deemed that any suppressed content does not materially affect the overall learning experience. Cengage Learning reserves the right to remove additional content at any time if subsequent rights restrictions require it.

Fiscal Year Ended
January 29,
2011
January 30,
2010
January 31,
2009
.....................................................................................................................................................
Net increase
(decrease) in cash
and cash
equivalents
127,144 1,161,080 (279,085)
Cash and cash
equivalents at be-
ginning of year
1,614,607 453,527 732,612
Cash and cash
equivalents at end
of year
$ 1,741,751 $ 1,614,607 $ 453,527
......................................................................................................................................................
Source: The TJX Companies, Inc. SEC 10-K filed March 30, 2011.
TJX Standardized Consolidated Balance Sheet
(in thousands)
Fiscal Year Ended January 29, 2011 January 30, 2010
..................................................................................................................................................
ASSETS
Cash and Marketable Securities $1,818,012 $1,745,243
Accounts Receivable 200,147 148,126
Inventory 2,765,464 2,532,318
Other Current Assets 315,904 378,169
Total Current Assets
5,099,527 4,803,856
Long-Term Tangible Assets 2,460,782 2,287,097
Long-Term Intangible Assets 179,936 179,794
Other Long-Term Assets 231,518 193,230
Total Long-Term Assets 2,872,236 2,660,121
Total Assets
$ 7,971,763 $ 7,463,977
LIABILITIES
Accounts Payable $1,683,929 $1,507,892
Short-Term Debt 2,727 2,355
Other Current Liabilities 1,446,465 1,384,739
Total Current Liabilities
3,133,121 2,894,986
Long-Term Debt 787,517 790,169
Deferred Taxes 241,905 192,447
Other Long-Term Liabilities 709,321 697,099
Total Long-Term Liabilities 1,738,743 1,679,715
Total Liabilities
$ 4,871,864 $ 4,574,701
Minority Interest ––
SHAREHOLDER’S EQUITY
Preferred Stock ––
Common Shareholder’s Equity 3,099,899 2,889,276
Total Shareholders’ Equity
3,099,899 2,889,276
Total Liabilities and Shareholders’ Equity
$ 7,971,763 $ 7,463,977
...................................................................................................................................................
Implementing Accounting Analysis 4-43
Copyright 2012 Cengage Learning. All Rights Reserved. May not be copied, scanned, or duplicated, in whole or in part. Due to electronic rights, some third party content may be suppressed from the eBook and/or eChapter(s).
Editorial review has deemed that any suppressed content does not materially affect the overall learning experience. Cengage Learning reserves the right to remove additional content at any time if subsequent rights restrictions require it.

TJX Standardized Consolidated Statements of Income
(In thousands)
Fiscal Year Ended January 29, 2011 January 30, 2010 January 31, 2009
.....................................................................................................................................................
Sales $21,942,193 $20,288,444 $18,999,505
Cost of sales 16,040,461 14,968,429 14,429,185
Gross profit
5,901,732 5,320,015 4,570,320
SG&A 3,710,053 3,328,944 3,135,589
Other operating expense (11,550) – (30,500)
Operating income
2,203,229 1,991,071 1,465,231
Net interest expense (income) 39,137 39,509 14,291
Pre-tax income
2,164,092 1,951,562 1,450,940
Tax expense 824,562 737,990 536,054
Unusual gains, net of unusual
losses
3,611 – (34,269)
Net income
$ 1,343,141 $ 1,213,572 $ 880,617
......................................................................................................................................................
TJX Standardized Consolidated Statements of Cash Flows
(In thousands)
Fiscal Year Ended
January 29,
2011
January 30,
2010
January 31,
2009
.....................................................................................................................................
Cash Flows from Operating
Activities
Net Income $1,343,141 $1,213,572 $880,617
After-tax interest expense
(income)
24,200 26,120 9,020
Non-operating Losses (Gains) 22,204 33,185 (96,249)
Long-term operating accruals 638,387 509,799 656,112
Depreciation and Amortization 458,052 435,218 401,707
Other 180,335 74,581 254,405
Operating cash flow before
working capital investments
2,027,932 1,782,676 1,449,500
Net (Investments in) or
Liquidation of Operating
Working Capital
(5,047) 548,555 (382,157)
Operating cash flow before in-
vestment in long-term assets
2,022,885 2,331,231 1,067,343
Cash Flows Used for Investing
Activities
Net (Investments in) or
Liquidation of Operating
Long-term Assets
(647,613) (560,277) (568,587)
Free cash flow available to debt
and equity
1,375,272 1,770,954 498,756
Cash Flows from (used for)
Financing Activities
After-tax net interest (expense)
income
(24,200) (26,120) (9,020)
(continued)
4-44 PART 2 • Business Analysis and Valuation Tools
Copyright 2012 Cengage Learning. All Rights Reserved. May not be copied, scanned, or duplicated, in whole or in part. Due to electronic rights, some third party content may be suppressed from the eBook and/or eChapter(s).
Editorial review has deemed that any suppressed content does not materially affect the overall learning experience. Cengage Learning reserves the right to remove additional content at any time if subsequent rights restrictions require it.

Fiscal Year Ended
January 29,
2011
January 30,
2010
January 31,
2009
.....................................................................................................................................
Net Debt (Repayment) or
Issuance
(5,473) 371,314 (2,008)
Free cash flow available to
equity
1,345,599 2,116,148 487,728
Dividend (payments) (229,329) (197,662) (176,749)
Net Stock (Repurchase) or
Issuance
(989,126) (757,406) (590,064)
Net increase (decrease) in cash 127,144 1,161,080 (279,085)
......................................................................................................................................
Note: The cash flow statement shows the cash flows from operating activities attributable to all
capital providers (debt and equity). Consequently, Net after-tax interest expense (income) is added
back to Net Income in the Operating cash flow segment and reported in the Financing segment.
Net after-tax interest expense (income) is Net interest expense (income) (1 Average tax rate).
APPENDIX B Nordstrom, Inc. Operating Lease Adjustment
To estimate the value of Nordstrom’s operating lease assets and liabilities, we use foot-
note information on the future minimum operating lease payments provided by Nord-
strom in the financial statement footnotes included in its 2010 10-K. For the years
ending January 29, 2011, and January 30, 2010, these amounts were as follows:
Year ended (in thousands) January 29, 2011 January 30, 2010
..................................................................................................................................................
Less than 1 year $ 111 $ 98
1-2 years 108 101
2-3 years 100 89
3-4 years 96 82
4-5 years 92 78
More than 5 years 524 406
Total
$ 1,031 $ 854
...................................................................................................................................................
Whereas in the TJX adjustment shown earlier in the chapter TJX provides an estimate
of the net present value of its minimum future lease obligations, Nordstrom does not
provide such an estimate. However, using Nordstrom’s reported average interest rate on
its long-term debt of 6.3 percent, and estimating an average lease term of 18 years using
data on general lease terms given in the 10-K, we can estimate the present value of
Nordstrom’s minimum lease obligations for the year ended January 29, 2011, as $685
million and for the year ended January 30, 2010, as $578 million.
15
With those estimates,
we can now make the following adjustments to Nordstrom’s beginning and ending balance
sheets and to its income statement for the year ended January 29, 2011:
1. Capitalize the estimated net present value of the minimum lease obligations as of January
30, 2010, increasing Long-Term Tangible Assets and Long-Term Debt by $578 million.
2. Calculate the value of any change in lease assets and lease liabilities during the year
from new lease transactions or terminations. On January 30, 2010, the estimated
present value of Nordstrom’s liability for operating lease commitments in 2011
...................................................................................................................
15
The net present value of Nordstrom’s reported future operating lease obligation is calculated using 6.3 percent as
a discount rate, which represents the average of Nordstrom’s long-term debt at the time, and an 18 year assumed
average lease term. The first 5 years are discounted by year as reported, with the remaining obligation (reported as
a lump sum due beyond year 5) spread on a straight line basis across years 6–18 and discounted.
Implementing Accounting Analysis 4-45
Copyright 2012 Cengage Learning. All Rights Reserved. May not be copied, scanned, or duplicated, in whole or in part. Due to electronic rights, some third party content may be suppressed from the eBook and/or eChapter(s).
Editorial review has deemed that any suppressed content does not materially affect the overall learning experience. Cengage Learning reserves the right to remove additional content at any time if subsequent rights restrictions require it.

and beyond was $578 million. During 2010, the company expected to repay
$98 million (as per the schedule above), comprising $36.4 million of interest (6.3 per-
cent of $578 million) and the remaining $61.6 million as retirement of the lease liabil-
ity. If there had been no new lease commitments added during the year, the operating
lease liability on January 29, 2011, would therefore have been $516.4 million ($578
million − $61.6 million). Yet Nordstrom’s actual lease commitment on January 29,
2011, was $685 million, indicating that it increased its leased store capacity by $168.6
million. Nordstrom’s Long-Term Tangible Assets and Long-Term Debt therefore
increased by $168.6 million during 2010 as a result of net new lease commitments.
3. Record the change in lease asset value and expense from depreciation during the year.
Using an eighteen-year life and straight-line depreciation, the depreciation expense for
2010 (included in Cost of Sales) is $36.8 million {[$578 m þ ($168.6 m/2)]/18}.
4. Add back the lease expense in the income statement, included in Cost of Sales, and
apportion the payment between Interest Expense and repayment of Long-Term Debt.
As previously mentioned, the lease expense is $98 million. As noted above, this reflects
$36.4 million ($578 m 6.3 percent) that is shown as Interest Expense and the
remaining $61.6 million is allocated toward retiring the total operating lease liability.
5. Make changes to the Deferred Tax Liability to reflect differences in earnings under
the capital and operating methods. If it capitalizes operating leases, Nordstrom’s
expenses are $73.2 million ($36.8 million depreciation expense plus $36.4 million
interest expense) versus $98 million under the operating method, a difference of
$24.8 million. Nordstrom will not change its tax books, but for financial reporting
purposes it will show higher earnings before tax and thus a higher Tax Expense
through deferred taxes. Given a corporate tax rate of 35 percent, Tax Expense will
increase by $8.7 million ($24.8 million .35) and the Deferred Tax Liability will
increase by the same amount for the year ended January 29, 2011.
In summary, the adjustments to Nordstrom’s financial statements on January 30,
2010, and January 29, 2011, are as follows:
Adjustment
January 29, 2011
...............................................
Adjustment
January 30, 2010
...............................................
($ Billions) Assets
Liabilities &
Equity Assets
Liabilities &
Equity
.............................................................................................................................................
Balance Sheet
Long-term tangible assets (1) þ578.0
(2) þ168.6
(3) −36.8
(1) þ578.0
Long-term debt (1) þ578.0
(2) þ168.6
(4) −61.6
(1) þ578.0
Deferred taxes (5) þ8.7
Shareholders’ equity þ16.1
Income Statement
Cost of sales (3) þ36.8
(4) −98.0
Net interest expense (4) þ36.4
Tax expense (5) þ8.7
Total increase in expense −16.1
Net Income þ16.1
..............................................................................................................................................
As noted in the TJX example above, we will be examining the impact of these adjust-
ments in the next chapter.
4-46 PART 2 • Business Analysis and Valuation Tools
Copyright 2012 Cengage Learning. All Rights Reserved. May not be copied, scanned, or duplicated, in whole or in part. Due to electronic rights, some third party content may be suppressed from the eBook and/or eChapter(s).
Editorial review has deemed that any suppressed content does not materially affect the overall learning experience. Cengage Learning reserves the right to remove additional content at any time if subsequent rights restrictions require it.

Chapter
5
FINANCIAL ANALYSIS
T
he goal of financial analysis is to assess the performance of a firm in the context
of its stated goals and strategy. There are two principal tools of financial analysis:
ratio analysis and cash flow analysis. Ratio analysis involves an assessment of how
various line items in a firm’s financial statements relate to one another. Cash flow analysis
allows the analyst to examine the firm’s liquidity and to assess the management of
operating, investment, and financing cash flows.
Financial analysis is used in a variety of contexts. Ratio analysis that compares a
company’s present performance to its past performance and/or to the performance of
its peers provides the foundation for making forecasts of future performance. As we
will discuss in later chapters, financial forecasting is useful in company valuation, credit
evaluation, financial distress prediction, security analysis, and mergers and acquisitions
analysis.
RATIO ANALYSIS
The value of a firm is determined by its profitability and growth. As shown in Figure 5-1,
the firm’s growth and profitability are influenced by its product market and financial
market strategies. The product market strategy is implemented through the firm’s com-
petitive strategy, operating policies, and investment decisions. Financial market strategies
are implemented through financing and dividend policies.
Thus, the four levers managers can use to achieve their growth and profit targets are
(1) operating management, (2) investment management, (3) financing strategy, and
(4) dividend policy. The objective of ratio analysis is to evaluate the effectiveness of the
firm’s policies in each of these areas. Effective ratio analysis involves relating the finan-
cial numbers to the underlying business factors in as much detail as possible. While ratio
analysis may not give an analyst all the answers regarding the firm’s performance, it will
help the analyst frame questions for further probing.
In ratio analysis, the analyst can (1) compare ratios for a firm over several years
(a time-series comparison), (2) compare ratios for the firm and other firms in the indus-
try (cross-sectional comparison), and/or (3) compare ratios to some absolute benchmark.
In a time-series comparison, the analyst can hold firm-specific factors constant and
examine the effectiveness of a firm’s strategy over time. Cross-sectional comparison facil-
itates examining the relative performance of a firm within its industry, holding industry-
level factors constant. For most ratios there are no absolute benchmarks. The exceptions
5-1
Copyright 2012 Cengage Learning. All Rights Reserved. May not be copied, scanned, or duplicated, in whole or in part. Due to electronic rights, some third party content may be suppressed from the eBook and/or eChapter(s).
Editorial review has deemed that any suppressed content does not materially affect the overall learning experience. Cengage Learning reserves the right to remove additional content at any time if subsequent rights restrictions require it.

are measures of rates of return, which can be compared to the cost of the capital associ-
ated with the investment. For example, subject to distortions caused by accounting, the
rate of return on equity (ROE) can be compared to the cost of equity capital. In the
discussion below, we will illustrate two of these approaches using the examples of TJX
and Nordstrom, the retailers introduced in Chapter 2. As we discussed in Chapter 2,
TJX is an off-price competitor that pursues a cost-leadership strategy. Nordstrom has
established itself as a high-end competitor that pursues a differentiation strategy by pro-
viding superior customer service and broad, differentiated merchandise selection. Our
comparison will allow us to examine the impact of these two strategies on the financial
ratios of the companies.
In addition to pursuing different competitive strategies, TJX and Nordstrom also
follow very different strategies when it comes to financing their stores. TJX leases virtu-
ally all of its stores using off–balance sheet operating leases. In contrast, while Nord-
strom also utilizes operating leases to some extent, the company owns at least a portion
of more than two-thirds of its store square footage (land, buildings, or both), and
finances the owned portion with long term debt. These financing strategies impact
many of the ratios that we will calculate in this chapter.
In order to fully explore the above choices made by the two companies, we will focus in
on two types of cross-sectional comparison—comparing TJX and Nordstrom’s ratios for the
fiscal year ending January 29, 2011, both on an “As Reported” and “As Adjusted” basis, with
the adjustments in the second comparison taking into account the differing use of
off–balance sheet operating leases mentioned above. Comparison of TJX with Nordstrom
on an “As Reported” basis allows us to see the impact of the different strategic, financial,
and operational decisions on the financial ratios of the two companies. Comparison on an
“As Adjusted” basis removes the distortion caused by the differing magnitude of their oper-
ating lease usage so that we can more clearly compare their true operating performance.
FIGURE 5-1 Drivers of a Firm’s Profitability and Growth
Growth and
Protability
Product Market
Strategies
Operating
Management
Investment
Management
Financing
Decisions
Dividend
Policy
Financial Market
Policies
Managing
Revenue and
Expenses
Managing
Working
Capital and
Fixed Assets
Managing
Liabilities and
Equity
Managing
Payout
Source: © Cengage Learning
5-2 PART 2 • Business Analysis and Valuation Tools
Copyright 2012 Cengage Learning. All Rights Reserved. May not be copied, scanned, or duplicated, in whole or in part. Due to electronic rights, some third party content may be suppressed from the eBook and/or eChapter(s).
Editorial review has deemed that any suppressed content does not materially affect the overall learning experience. Cengage Learning reserves the right to remove additional content at any time if subsequent rights restrictions require it.

While in certain cases companies being compared will make differing strategic
choices that strongly impact their financial performance and ratios, the analyst will
not always choose to make adjustments to their financials in order to compare them.
In the comparison of TJX and Nordstrom, a major difference between the competitors
relates to how each executes its branded cre dit card offering. TJX has chosen to out-
source its credit card operations, giving up operational control and potential earnings
but also insulating itself from potential losses due to bad debt. Nordstrom, on the other
hand, views its in-house credit card operati ons as a strategic advantage and part of its
broader strategy of providing superior customer service. The result of these business
decisions is seen primarily in Nordstrom’smuchhigheraccountsreceivablesbalance
as compared to TJX, and impacts many of the ratio calculations that we will discuss
later i n this chapter. Given that Nordstrom views this segment as an integral part of
its operations, we choose not to remove it when comparing Nords trom to TJX. How-
ever, it pays to be aware of the choices being made here and to understand the resul-
tant impact on any comparative analysis, and as such we highlight this impact in the
ratio analysis where appropriate.
As a final consideration, it is important to ensure that the financial statements of
the company being analyzed do not include any additional data that will distort the
analysis. Since the purpose of financial statement analysis is to better understand the
performance of the firm as it relates to its strategy, care needs to be taken that any
operations and events that are extraneous to that strategy do not change the picture
that the analyst forms of the firm. The major categories of such distortions include
one-time write-offs of assets and results from discontinued operations, including the
gain or loss on the disposal of such operations. In such instances, it is useful to look
at financial results of the core operations of the firm by adjusting the presented finan-
cial stateme nts to exclude the impact of one-time effects. For example, TJX sold its
interest in Bob’s Stores i n 2008. As a result, its 2008 income statement contains a
$34 million loss on the discontinued operations. Without adjusting for this effect it
would have been difficult to meaningfully use TJX’s 2008 results as a benchmark for
performance in 2009 and beyond, or to compare it to a competitor such as Nordst rom.
For the same reason, we have excluded a $3.6 million gain due to discontinued
operations for TJX in 2010, with this adjustment being included in the “As Adjusted”
financial statements for TJX.
In order to facilitate replication of the ratio calculations presented below, we present
in the appendix to this chapter two versions of the 2010 financial statements of TJX and
Nordstrom.
1
The first set of financial statements is presented in the standardized format
described in Chapter 4. These “Standardized” financial statements put both companies’
reported financials in one standard format to facilitate direct comparison.
2
The second,
“Condensed” financial statements recast the standardized financial statements to facili-
tate the calculation of several ratios discussed in the chapter. We will discuss later in
the chapter how this recasting process works. These two statement formats are presented
on both an “As Reported” and “As Adjusted” basis as described above.
Measuring Overall Profitab ility
The starting point for a systematic analysis of a firm’s performance is its return on
equity (ROE), defined as
ROE ¼
Net income
shareholders’ equity
ROE is a comprehensive indicator of a firm’s performance because it provides an
indication of how well managers are employing the funds invested by the firm’s
Financial Analysis 5-3
Copyright 2012 Cengage Learning. All Rights Reserved. May not be copied, scanned, or duplicated, in whole or in part. Due to electronic rights, some third party content may be suppressed from the eBook and/or eChapter(s).
Editorial review has deemed that any suppressed content does not materially affect the overall learning experience. Cengage Learning reserves the right to remove additional content at any time if subsequent rights restrictions require it.

shareholders to generate returns. On average over the twenty-year period 1991–2010,
publicly traded firms in the United States generated ROEs of a little over 10 percent.
3
In the long run, the value of the firm’s equity is determined by the relationship
between its ROE and its cost of equity capital.
4
That is, those firms that are expected
over the long run to generate ROEs in excess of the cost of equity capital should have
market values in excess of book value, and vice versa. (We will return to this point in
more detail in Chapters 7 and 8.)
A comparison of ROE with the cost of capital is useful not only for analyzing the
value of the firm but also in considering the path of future profitability. The generation
of consistent supernormal profitability will, absent significant barriers to entry, attract
competition. For that reason ROEs tend over time to be driven by competitive forces
toward a “normal” level—the cost of equity capital. Thus, one can think of the cost of
equity capital as establishing a benchmark for the ROE that would be observed in a
long-run competitive equilibrium. Deviations from this level arise for two general rea-
sons. One is the industry conditions and competitive strategy that cause a firm to gener-
ate supernormal (or subnormal) economic profits, at least over the short run. The second
is distortions due to accounting.
Table 5-1 shows the ROE based on reported and adjusted earnings for TJX and
Nordstrom.
TJX outperformed Nordstrom in 2010, which on the surface is perhaps not surprising
given that the difficult financial climate at the time tended to favor discount retailers.
While Nordstrom’s unadjusted ROE of 39.0 percent trails the 46.5 percent earned by
TJX in 2010, the performance of both companies exceeded both historical trends of
ROE in the economy and reasonable estimates of the cost of equity capital for the
firms.
5
When ROE is calculated using adjusted financials the differential grows signifi-
cantly, reflecting the greater impact of the adjustment to TJX due to its much larger
use of operating leases. We will examine the drivers behind these adjustments as we
deconstruct ROE below.
TJX’s superior profitability performance relative to Nordstrom is reflected in the
difference between the market value of equity to book value ratios for the two firms.
As we will discuss in Chapter 7, ROE is a key determinant of a company’smarketto
book ratio. As of January 29, 2011, which represented the end of both companies’ fiscal
year 2010, TJX’s market to book ratio was 6.0 and Nordstrom’sratiowas4.4.This
differential in market valuation could be an indication that investors expected TJX to
continue to outperform Nordstrom in the coming years and to earn a superior return
for its shareholders.
Decomposing Profitability: Traditional Approach
A company’s ROE is affected by two factors: how profitably it employs its assets and
how big the firm’s asset base is relative to shareholders’ investment. To understand the
TABL E 5 -1 Return of Equity for TJX and Nordstrom
Year ended January 29, 2011 As Reported As Adjusted
.....................................................................................................................................................
TJX Nordstrom TJX Nordstrom
Return on Equity 46.5% 39.0% 55.4% 40.0%
.....................................................................................................................................................
Source: © Cengage Learning 2013
5-4 PART 2 • Business Analysis and Valuation Tools
Copyright 2012 Cengage Learning. All Rights Reserved. May not be copied, scanned, or duplicated, in whole or in part. Due to electronic rights, some third party content may be suppressed from the eBook and/or eChapter(s).
Editorial review has deemed that any suppressed content does not materially affect the overall learning experience. Cengage Learning reserves the right to remove additional content at any time if subsequent rights restrictions require it.

effect of these two factors, ROE can be decomposed into return on assets (ROA) and a
measure of financial leverage, as follows:
ROE ¼ ROA Financial leverage
¼
Net income
Assets
Assets
Shareholders’ equity
ROA tells us how much profit a company is able to generate for each dollar of assets
invested. Financial leverage indicates how many dollars of assets the firm is able to
deploy for each dollar invested by its shareholders.
The return on assets itself can be decomposed into a product of two factors:
ROA ¼
Net income
Sales
Sales
Assets
The ratio of net income to sales is called net profit margin or return on sales (ROS); the
ratio of sales to assets is known as asset turnover. The profit margin ratio indicates how
much the company is able to keep as profits for each dollar of sales it makes. Asset turnover
indicates how many sales dollars the firm is able to generate for each dollar of its assets.
Table 5-2 displays the three drivers of ROE for our retail firms: net profit margins,
asset turnover, and financial leverage. In comparing TJX to Nordstrom on an As
Reported basis, a significantly higher asset turnover is key to explaining how TJX, even
with a slightly lower net profit margin and a much lower financial leverage than
Nordstrom, was able to post an overall higher return on equity of 46.5 percent against
39.0 percent for Nordstrom in FY 2010.
This preliminary decomposition of ROE begins to show us how an examination of the
building blocks of these ratios can yield a deeper understanding of how strategic, invest-
ment, and financing decisions made by the firm affect its ratios. For instance, in noting
that higher asset turnover is a key driver of TJX’s higher ROE when compared to Nord-
strom, an analyst would recall TJX’s decision to outsource its credit card operations
(resulting in a much lower Accounts Receivable balance when compared to Nordstrom,
who maintains its credit card operations in house), and TJX’s more extensive use of
off–balance sheet operating leases to finance its stores (which reduces both overall reported
asset and debt level). While adjusting for the operating lease impact for both firms brings
the asset turnover of TJX closer to that of Nordstrom, the difference in credit card strate-
gies continues to drive a higher ROA for TJX. The greatly increased ROE for TJX of 55.4
percent on an As Adjusted basis is the result primarily of increased financial leverage
resulting from the addition of long-term debt to TJX’sbalancesheetaspartoftheoperat-
ing lease adjustment. Finally, the higher adjusted ROS for TJX is the result of lower current
expense incurred as a result of the operating lease adjustment.
TABL E 5 -2 Traditional Decomposition of ROE
Year ended January 29, 2011 As Reported As Adjusted
...................................................................................................................................................
TJX Nordstrom TJX Nordstrom
Net profit margin (ROS) 6.1% 6.3% 7.3% 6.5%
Asset turnover 2.94 1.47 1.84 1.36
¼ Return on assets (ROA) 18.0% 9.3% 13.4% 8.8%
Financial leverage 2.58 4.19 4.12 4.55
¼ Return on equity (ROE) 46.5% 39.0% 55.4% 40.0%
...................................................................................................................................................
Source: © Cengage Learning 2013
Financial Analysis 5-5
Copyright 2012 Cengage Learning. All Rights Reserved. May not be copied, scanned, or duplicated, in whole or in part. Due to electronic rights, some third party content may be suppressed from the eBook and/or eChapter(s).
Editorial review has deemed that any suppressed content does not materially affect the overall learning experience. Cengage Learning reserves the right to remove additional content at any time if subsequent rights restrictions require it.

Decomposing Profitability: Alternative Approach
Even though the above approach is popularly used to decompose a firm’s ROE, it has
several limitations. In the computation of ROA, the denominator includes the assets
claimed by all providers of capital to the firm, but the numerator includes only the earn-
ings available to equity holders. The assets themselves include both operating assets and
financial assets such as cash and short-term investments. Further, net income includes
income from operating activities as well as interest income and expense, which are con-
sequences of financing decisions. Often it is useful to distinguish between these two dri-
vers of performance. Finally, the financial leverage ratio used above does not recognize
the fact that a firm’s cash and short-term investments are in essence “negative debt”
because they can be used to pay down the debt on the company’s balance sheet.
6
These
issues are addressed by an alternative approach to decomposing ROE.
7
Before discussing this alternative ROE decomposition approach, we define in Table 5-3
some terminology used in this section as well as in the rest of this chapter.
We use the terms defined above to recast the financial statements of TJX and Nord-
strom. These recast financial statements, which are shown in the appendix as condensed
statements, are used to decompose ROE in the following manner:
ROE ¼
NOPAT
Equity
ðNet interest expense after taxÞ
Equity
¼
NOPAT
Net assets
Net assets
Equity
Net interest expense after tax
Net debt
Net debt
Equity
¼
NOPAT
Net assets
1 þ
Net debt
Equity
Net interest expense after tax
Net debt
Net debt
Equity
¼ Operating ROA þðOperating ROA Effective interest rate after taxÞ
Net financial leverage
¼ Operating ROA þ Spread Net financial leverage
Operating ROA is a measure of how profitably a company is able to deploy its operating
assets to generate operating profits. This would be a company’s ROE if it were financed
TABL E 5 -3 Definitions of Accounting Items Used in Ratio Analysis
Item Definition
....................................................................................................................................................
Net interest expense after tax (Interest expense Interest income) (1 Tax rate)
a
Net operating profit after
taxes (NOPAT)
Net income þ Net interest expense after tax
Operating working capital (Current assets Cash and marketable securities)
(Current liabilities Short-term debt and current
portion of long-term debt)
Net long-term assets Total long-term assets Non-interest-bearing long-term liabilities
Net debt Total interest-bearing liabilities Cash and marketable securities
Net assets Operating working capital þ Net long-term assets
Net capital Net debt þ Shareholders’ equity
....................................................................................................................................................
a
The calculation of net interest expense treats interest expense and interest income as absolute values,
independent of how these figures are reported in the income statement.
Source: © Cengage Learning 2013
5-6 PART 2 • Business Analysis and Valuation Tools
Copyright 2012 Cengage Learning. All Rights Reserved. May not be copied, scanned, or duplicated, in whole or in part. Due to electronic rights, some third party content may be suppressed from the eBook and/or eChapter(s).
Editorial review has deemed that any suppressed content does not materially affect the overall learning experience. Cengage Learning reserves the right to remove additional content at any time if subsequent rights restrictions require it.

entirely with equity. Spread is the incremental economic effect from introducing debt
into the capital structure. This economic effect of borrowing is positive as long as the
return on operating assets is greater than the cost of borrowing. Firms that do not earn
adequate operating returns to pay for interest cost reduce their ROE by borrowing. Both
the positive and negative effect is magnified by the extent to which a firm borrows rela-
tive to its equity base. The ratio of net debt to equity provides a measure of this net
financial leverage. A firm’s spread times its net financial leverage, therefore, provides a
measure of the financial leverage gain to the shareholders.
Operating ROA can be further decomposed into NOPAT margin and operating asset
turnover as follows:
Operating ROA ¼
NOPAT
Sales
Sales
Net assets
NOPAT margin is a measure of how profitable a company’s sales are from an operating
perspective. Operating asset turnover measures the extent to which a company is able to
use its operating assets to generate sales.
Table 5-4 presents the alternative decomposition of ROE for TJX and Nordstrom. The
ratios in this table show that on an As Reported basis TJX’s 2010 operating ROA was almost
four times higher than its traditional ROA, with 2010 operating ROA of 70.6 percent
compared to traditional ROA of 18.0 percent. The difference between TJX’s operating
ROA and traditional ROA is driven by a much higher net operating asset turnover (11.33
in 2010) when compared to its traditionally defined asset turnover (2.94 in 2010) shown in
Table 5-2—aresultofTJX’s large cash balance and use of non interest-bearing liabilities
(such as accounts payable) to finance a significant portion of its net operating assets.
Nordstrom also had a higher As Reported operating ROA than traditional ROA (20.4
percent compared to 9.3 percent). While a higher net operating asset turnover as com-
pared to traditional asset turnover (2.86 as compared to 1.47) was the primary driver of
Nordstrom’s higher operating ROA, a higher net operating profit margin as compared to
traditional net profit margin (7.1 percent as compared to 6.3 percent) also was a factor.
Comparing the two firms on an As Reported basis, TJX’s dramatically higher oper-
ating asset turnover as compared to Nordstrom’s is driven (as was asset turnover dis-
cussed previously) by its relatively low net assets that result from its strategy of
outsourcing its branded credit card (and thus not carrying a high accounts receivable
balance) and leasing virtually all of its stores (thus carrying low net long-term assets
relative to Nordstrom).
TABLE 5 -4 Distinguishing Operating and Financing Components
in ROE Decomposition
Year ended January 29, 2011 As Reported As Adjusted
....................................................................................................................................................
TJX Nordstrom TJX Nordstrom
Net operating profit margin 6.2% 7.1% 8.1% 7.5%
Net operating asset turnover 11.33 2.86 3.44 2.44
¼ Operating ROA 70.6% 20.4% 27.8% 18.4%
Spread 73.1% 16.1% 22.8% 14.2%
Net financial leverage 0.33 1.16 1.21 1.52
¼ Financial leverage gain 24.1% 18.6% 27.6% 21.6%
ROE ¼ Operating ROA þ
Financial leverage gain
46.5% 39.0% 55.4% 40.0%
...................................................................................................................................................
Source: © Cengage Learning 2013
Financial Analysis 5-7
Copyright 2012 Cengage Learning. All Rights Reserved. May not be copied, scanned, or duplicated, in whole or in part. Due to electronic rights, some third party content may be suppressed from the eBook and/or eChapter(s).
Editorial review has deemed that any suppressed content does not materially affect the overall learning experience. Cengage Learning reserves the right to remove additional content at any time if subsequent rights restrictions require it.
Continuing on an As Reported basis, Nordstrom is able to create shareholder value
through its financing strategy. In 2010, the spread between Nordstrom’s operating ROA
and its after-tax interest cost was 16.1 percent, and its net financial leverage (net debt as
a percentage of equity) was 116 percent. These factors combined to contribute a financial
leverage gain of 18.6 percent in 2010, which is the incremental difference between
Nordstrom’s operating ROA of 20.4 percent and its ROE of 39.0 percent.
TJX, on the other hand, while it had a 73.1 percent spread between operating ROA
and its after-tax interest cost (which actually calculates at a negative rate due to its nega-
tive net debt position; that is, the company had more cash than debt), had a negative
financial leverage gain resulting from that negative net debt position. As a result, its
operating ROA at 70.6 percent is actually higher than its ROE of 46.5 percent in 2010.
Remembering once more TJX’s use of off–balance sheet financing for its stores (which
results in TJX having artificially low reported financial leverage) will help the analyst
understand the impact of that decision on the financing component of its ROE.
As noted above, TJX shows an adjusted ROE of 55.4 percent—a significant increase over
its As Reported ROE of 46.5 percent, and well above Nordstrom’sAsAdjustedROEof
40.0 percent (Nordstrom as a whole generally sees minor impact from the operating lease
adjustment given its more limited use of operating leases). The impact of the operating
lease adjustment can be seen most strongly in net operating asset turnover for TJX, which
falls from 11.33 to 3.44 due to the greatly increased asset base, bringing operating ROA
down from 70.6 percent to 27.8 percent. This in turn reduces the spread between TJX’s oper-
ating ROA and after tax interest cost from 73.1 percent to 22.8 percent. Even so, the change
in net financial leverage from −0.33 on an As Reported basis to 1.21 on an As Adjusted basis
creates a positive financial leverage gain of 27.6 percent, as compared to a −24.1 percent
gain on an As Reported basis. What this says is that TJX’s use of additional leverage (as sim-
ulated with the adjustments made for the operating leases) has actually helped—through an
increase in net operating profit margin, but primarily by reversing a negative financial lever-
age gain, to create additional shareholder return as seen in the higher As Adjusted ROE.
The appropriate benchmark for evaluating operating ROA is the weighted average cost of
debt and equity capital, or WACC. In the long run, the value of a firm’s assets is determined
by how its operating ROA compares to this norm. Moreover, over the long run and absent
some barrier to competitive forces, operating ROA will tend to be pushed toward the
weighted average cost of capital. Since the WACC is typically lower than the cost of equity
capital, operating ROA over time tends to be pushed to a level lower than that to which ROE
tends. We will discuss further the use and calculation of the WACC in Chapter 8.
The average operating ROA for public firms in the United States in the twenty-year
period 1991–2010 was 9 percent.
8
In 2010 both TJX and Nordstrom significantly
exceeded this benchmark. The impressive operating performance of both firms would
have been obscured by using the simple ROA measure.
9
Assessing Operati ng Management: Decomposing
Net Profit Margins
A firm’s net profit margin, or return on sales (ROS), shows the profitability of the com-
pany’s operating activities. Further decomposition of a firm’s ROS allows an analyst to
assess the efficiency of the firm’s operating management. A popular tool used in this
analysis is the common-sized income statement in which all the line items are expressed
as a percentage of sales revenues.
Common-sized income statements make it possible to compare trends in income state-
ment relationships over time for the firm and trends across different firms in the industry.
To illustrate how the income statement analysis can be used, common-sized income
5-8
PART 2 • Business Analysis and Valuation Tools
Copyright 2012 Cengage Learning. All Rights Reserved. May not be copied, scanned, or duplicated, in whole or in part. Due to electronic rights, some third party content may be suppressed from the eBook and/or eChapter(s).
Editorial review has deemed that any suppressed content does not materially affect the overall learning experience. Cengage Learning reserves the right to remove additional content at any time if subsequent rights restrictions require it.

statements for TJX and Nordstrom are shown in Table 5-5. The table also shows some
commonly used profitability ratios. We will use the information in Table 5-5 to investigate
the drivers behind TJX and Nordstrom’s net income margins (ROS) in 2010.
In this section we focus primarily on an analysis of As Reported numbers. As can be
seen in Table 5-5, the operating lease adjustment results in revised As Adjusted numbers
for both companies, with TJX showing the larger change due to its greater use of operat-
ing leases. The impact of the adjustment is straightforward on the income statement, in
that both companies show an increase in profitability metrics (gross profit, EBITDA,
NOPAT, and ROS) due to a lower cost of goods sold (due to the depreciation compo-
nent of COGS being only a portion of the previously utilized lease expense), and show
increased interest expense (due to the added debt component) and tax expense (due to
higher net income). We will point out a few of the more interesting results of the adjust-
ment where warranted.
Gross Profit Margins
The difference between a firm’s sales and cost of sales is gross profit. Gross profit margin
is an indication of the extent to which revenues exceed direct costs associated with sales,
and it is computed as
Gross profit margin ¼
Sales Cost of sales
Sales
Gross margin is influenced by two factors: (1) the price premium that a firm’s
products or services command in the marketplace and (2) the efficiency of the firm’s
TABLE 5 -5 Common-Sized Income Statement and Profitability Ratios
Year ended January 29, 2011 As Reported As Adjusted
.....................................................................................................................................................
TJX Nordstrom TJX Nordstrom
Line Items as a Percent of Sales
Sales 100.0% 100.0% 100.0% 100.0%
Cost of Sales 71.0% 57.4% 68.1% 56.8%
SG&A 16.9% 27.7% 16.9% 27.7%
Other operating expense 2.1% 3.4% 2.1% 3.4%
Other income,netofother expense 0.0% 0.0% 0.0% 0.0%
Net interest expense (income) 0.2% 1.3% 1.3% 1.7%
Tax expense 3.8% 3.9% 4.4% 4.0%
Unusual gains, net of unusual
losses
0.0%
a
0.0% 0.0% 0.0%
Net income 6.1% 6.3% 7.3% 6.5%
Key Profitability Ratios
Gross profit margin 29.0% 42.6% 32.0% 43.2%
EBITDA margin 12.1% 14.9% 15.1% 15.5%
NOPAT margin 6.23% 7.13% 8.10% 7.53%
Recurring NOPAT margin 6.19% 7.13% 8.10% 7.53%
.....................................................................................................................................................
a
This figure is rounded to zero although there was actually a gain of $3.6 million here (which is reflected
in the difference in NOPAT and recurring NOPAT margin below).
Source: © Cengage Learning 2013
Financial Analysis 5-9
Copyright 2012 Cengage Learning. All Rights Reserved. May not be copied, scanned, or duplicated, in whole or in part. Due to electronic rights, some third party content may be suppressed from the eBook and/or eChapter(s).
Editorial review has deemed that any suppressed content does not materially affect the overall learning experience. Cengage Learning reserves the right to remove additional content at any time if subsequent rights restrictions require it.

procurement and production process. The price premium a firm’s products or services
can command is influenced by the degree of competition and the extent to which its
products are unique. The firm’s cost of sales can be low when it can purchase its inputs
at a lower cost than competitors and/or run its production processes more efficiently.
This is generally the case when a firm has a low-cost strategy.
Table 5-5 indicates that consistent with Nordstrom’s premium price strategy, its gross
margin on an As Reported basis of 42.6 percent in 2010 was significantly higher than
that of TJX.
Selling, General, an d Administrative Expenses
A company’s selling, general, and administrative (SG&A) expenses are influenced by the
operating activities it has to undertake to implement its competitive strategy. As dis-
cussed in Chapter 2, firms with differentiation strategies have to undertake activities to
achieve that differentiation. A company competing on the basis of quality and rapid
introduction of new products is likely to have higher R&D costs relative to a company
competing purely on a cost basis. Similarly, a company that attempts to build a brand
image, distribute its products through full-service retailers, and provide significant cus-
tomer service is likely to have higher selling and administration costs relative to a com-
pany that sells through warehouse retailers or direct mail and does not provide much
customer support.
A company’s SG&A expenses are also influenced by the efficiency with which it man-
ages its overhead activities. The control of operating expenses is likely to be especially
important for firms competing on the basis of low cost. However, even for differentia-
tors, it is important to assess whether the cost of differentiation is commensurate with
the price premium earned in the marketplace.
Several ratios in Table 5-5 allow us to evaluate the effectiveness with which TJX
and Nordstrom manage their SG&A expenses. First, the ratio of SG&A expense to
sales shows how much a company is spending to generate each sales dollar. We see
that TJX has a significantly lower ratio of SG&A to sales than does Nordstrom. This
should not be surprising given that TJX pursues a low-cost strategy whereas Nord-
strom pursues an intensively customer-service-focuse d strategy. Given that TJX and
Nordstrom are pursuing radically different pricing, merchandising, and service strat-
egies, it is not surprising that they have very different cost structures: TJX’slower
gross margins and lower SG&A to sales are reflective of its low cost strategy, while
Nordstrom’s higher margins and also higher S G&A expenses reflect its focus on
providing a high service, differentiated offering to more affluent customers. A key
question is, when both these costs are netted out, which company performed better?
Two ratios provide usefu l signals here: net operating profit marg in (NOPAT margin)
and EBITDA margin:
NOPAT margin ¼
NOPAT
Sales
EBITDA margin ¼
Earnings before interest, taxes, depreciation, and amortization
Sales
NOPAT margin provides a comprehens ive indication of the operating performance
of a company because it reflects all operating costs and eliminates the effects of debt
policy. EBITDA margin provides similar information , except that it excludes deprecia-
tion and amortization expense , a significant non-cash operating expens e. Some analysts
prefer to use EBITDA margin because they believe that it focuses on “cash” operating
5-10
PART 2 • Business Analysis and Valuation Tools
Copyright 2012 Cengage Learning. All Rights Reserved. May not be copied, scanned, or duplicated, in whole or in part. Due to electronic rights, some third party content may be suppressed from the eBook and/or eChapter(s).
Editorial review has deemed that any suppressed content does not materially affect the overall learning experience. Cengage Learning reserves the right to remove additional content at any time if subsequent rights restrictions require it.
items.Whilethisistosomeextenttrue,itcan be potentially misleading for two rea-
sons. EBITDA is not a strictly cash concept because sales, cost of sales, and SG&A
expenses often include non-cash items. Also, depreciation is a real operating expense,
and it reflects to some exten t the consumption of r esources. Therefore, ignoring it can
be misleading.
Table 5-5 shows that TJX was able to earn 6.2 cents in operating profits out of every
dollar of sales it generated, whereas Nordstrom earned 7.1 cents per sales dollar. It is
interesting to note that on an As Adjusted basis TJX actually earns a higher operating
profit to sales than Nordstrom.
Recall that in Table 5-3 we define NOPAT as n et income plus ne t interest expense
after tax. Therefore, NOPAT is influenced by any unusual or non- operating income
(expense) items included in net income. We can calculate a “recurring” NOPAT
margin by eliminating these items. Nordstrom’s recurring and traditional NOPAT
margins are the same, indicating no unusual or non-operating income or expense
items impacting n et income in 2010 . For TJX as well the major portion of its profits
came from its core business. TJX’s recurring NOPAT margin is slightly lower than its
traditional NOPAT margin in 2010 (6.19 percent compared to 6.23 percent) due to
the small gain on discontinued operations in 2010 (mentioned at the beginning of
the chapter) related to the reduction of a reserve related to settling lease-related obli-
gations of former businesses.
10
While in this particular example there was only a
minor difference between recurring and traditional NOPAT margin, in general, recur-
ring NOPAT may be a better benchmark to use when extrapolating current perfor-
mance i nto the future since it ref lects margins from the core business activities of a
firm, especially if in the particular years analyzed the firm generated significant
income from non-core or discontinued operations. The alternate approach that we
take, of course, is to adjust the financials to remove this non-recurring item entire ly
as we do in As Adjusted numbers.
Nordstrom also has a better EBITDA margin than TJX on an As Reported basis,
although the difference narrows when comparing As Adjusted numbers, since on an As
Reported basis TJX’s use of operating leases results in much higher leasing expense,
which is included in EBITDA, while Nordstrom’s higher depreciation expense resulting
from its store ownership strategy is excluded.
Tax Expense
Taxes are an important element of a firm’s total expenses. Through a wide variety of tax
planning techniques, firms can attempt to reduce their tax expenses.
11
There are two
measures one can use to evaluate a firm’s tax expense. One is the ratio of tax expense
to sales, and the other is the ratio of tax expense to earnings before taxes (also known
as the average tax rate). The firm’s tax footnote provides a detailed account of why its
average tax rate differs from the statutory tax rate.
Table 5-5 shows that Nordstrom had a slightly higher income tax expense as a
percent of sales than TJX. Given that the two companies had the same average tax
rate in 2010 at 38 per cent, this difference can b e at tributed to Nordstrom ’shigher
pretax profits as a percent of sales, although the situation is reversed on an As
Adjusted basis.
In summary, an examination of common-sized income statement ratios can illumi-
nate strategic and operational differences among competitors. While Nordstrom’s posi-
tioning as a high-end retailer allows it to earn a larger gross margin on sales than TJX,
it is a tight control over expenses that helps TJX to compensate for its lower gross mar-
gin and to ultimately earn a similar net income margin.
Financial Analysis 5-11
Copyright 2012 Cengage Learning. All Rights Reserved. May not be copied, scanned, or duplicated, in whole or in part. Due to electronic rights, some third party content may be suppressed from the eBook and/or eChapter(s).
Editorial review has deemed that any suppressed content does not materially affect the overall learning experience. Cengage Learning reserves the right to remove additional content at any time if subsequent rights restrictions require it.

Key Analysis Questions
A number of business questions will be useful to an analyst assessing the various
elements of operating management:
• Are the company’s margins consistent with its stated competitive strategy? For
example, a differentiation strategy should usually lead to higher gross margins
than a low-cost strategy.
• Are the company ’s margins changing? Why? What are the underlying business
causes—changes in competition, changes in input costs, or poor overhead cost
management?
• Is the company managing its overhead and administrative costs well? What are
the business activities driving these costs? Are these activities necessary?
• Are the company’s tax policies sustainable, or is the current tax rate influenced
by one-time tax credits?
• Do the firm’s tax planning strategies lead to other business costs? For example,
if the operations are located in tax havens, how does this affect the company’s
profit margins and asset utilization? Are the benefits of tax planning strategies
(reduced taxes) greater than the increased business costs?
Evaluating Investment Management: Decomposing Asset Turnover
Asset turnover is the second driver of a company’s return on equity. Since firms invest
considerable resources in their assets, using them productively is critical to overall prof-
itability. A detailed analysis of asset turnover allows the analyst to evaluate the effective-
ness of a firm’s investment management. There are two primary areas of investment
management: (1) working capital management and (2) management of long-term assets,
both of which are discussed in further detail below.
Working Capital Management
Working capital is defined as the difference between a firm’s current assets and
current liabilities. However, this definition does not distinguish between operating
components (such as accounts receivable, inventory, and accounts payable) and
financing components (such as cash, marketable securities, and notes payable). An
alternative measure that makes this distinction is operating working capital, defined
in Table 5-3 as
Operating working capital ¼ðCurrent assets cash and marketable securitiesÞ
ðCurrent liabilities Short-term and current portion of long-term debtÞ
The components of operating working capital that analysts primarily focus on are
accounts receivable, inventory, and accounts payable. A certain amount of investment
in working capital is generally necessary for the firm to run its normal operations. For
example, a firm’s credit policies and distribution policies determine its optimal level of
accounts receivable. The nature of the production process and the need for buffer stocks
determine the optimal level of inventory. Finally, accounts payable is a routine source of
financing for the firm’s working capital, and payment practices in an industry determine
the normal level of accounts payable.
The following ratios are useful in analyzing a firm’s working capital management:
operating working capital as a percent of sales, operating working capital turnover,
accounts receivable turnover, inventory turnover, and accounts payable turnover. The
5-12
PART 2 • Business Analysis and Valuation Tools
Copyright 2012 Cengage Learning. All Rights Reserved. May not be copied, scanned, or duplicated, in whole or in part. Due to electronic rights, some third party content may be suppressed from the eBook and/or eChapter(s).
Editorial review has deemed that any suppressed content does not materially affect the overall learning experience. Cengage Learning reserves the right to remove additional content at any time if subsequent rights restrictions require it.

turnover ratios can also be expressed in number of days of activity that the operating
working capital (and its components) can support. These ratios are defined below:
Operating working capital to sales ratio ¼
Operating working capital
Sales
Operating working capital turnover ¼
Sales
Operating working capital
Accounts receivable turnover ¼
Sales
Accounts receivable
Inventory turnover ¼
Cost of goods sold
12
Inventory
Accounts payable turnover ¼
Purchases
Accounts payable
or
Cost of goods sold
Accounts payable
Days’ receivables ¼
Accounts receivable
Average sales per day
Days’ inventory ¼
Inventory
Average cost of goods sold per day
Days’ payables ¼
Accounts payable
Average purchases ðor cost of goods soldÞ per day
Operating working capital turnover indicates how many dollars of sales a firm is able
to generate for each dollar invested in operating working capital. Accounts receivable
turnover, inventory turnover, and accounts payable turnover allow the analyst to exam-
ine how productively the three principal components of working capital are being used.
Days’ receivables, days’ inventory, and days’ payables are another way to evaluate the
efficiency of a firm’s working capital management.
13
Long-Term Assets Management
Another area of investment management concerns the utilization of a firm’s long-term
assets. It is useful to define again a firm’s investment in long-term assets:
Net long-term assets ¼ðTotal long-term assets
Non-interest-bearing long-term liabilitiesÞ
Long-term assets generally consist of net property, plant, and equipment (PP&E), intangible
assets such as goodwill, and other assets. Non-interest-bearing long-term liabilities include
items such as deferred taxes. We define net long-term assets and net working capital in such
a way that their sum, net operating assets, is equal to the sum of net debt and equity, or net
capital. This is consistent with the way we defined operating ROA earlier in the chapter.
The efficiency with which a firm uses its net long-term assets is measured by the
following two ratios: net long-term assets as a percent of sales and net long-term asset
turnover, defined as
Net long-term asset turnover ¼
Sales
Net long-term assets
Financial Analysis 5-13
Copyright 2012 Cengage Learning. All Rights Reserved. May not be copied, scanned, or duplicated, in whole or in part. Due to electronic rights, some third party content may be suppressed from the eBook and/or eChapter(s).
Editorial review has deemed that any suppressed content does not materially affect the overall learning experience. Cengage Learning reserves the right to remove additional content at any time if subsequent rights restrictions require it.

Property plant and equipment (PP&E) is the most important long-term asset in a
firm’s balance sheet. The efficiency with which a firm’s PP&E is used is measured either
by the ratio of PP&E to sales or by the PP&E turnover ratio:
PP&E turnover ¼
Sales
Net property, plant, and equipment
Key Analysis Questions
The ratios discussed in the two preceding sections allow the analyst to explore a
number of business questions:
• How well does the company manage its inventory? Does the company use mod-
ern manufacturing techniques? Does it have good vendor and logistics manage-
ment systems? If inventory ratios are changing, what is the underlying business
reason? Are new products being planned? Is there a mismatch between the
demand forecasts and actual sales?
• How well does the company manage its credit policies? Are these policies consis-
tent with its marketing strategy? Is the company artificially increasing sales by
loading the distribution channels?
• Is the company taking advantage of trade credit? Is it relying too much on trade
credit? If so, what are the implicit costs?
• Is the company’s investment in plant and equipment consistent with its compet-
itive strategy? Does the company have a sound policy of acquisitions and
divestitures?
Table 5-6 shows the asset turnover ratios for TJX and Nordstrom on an As Reported
and As Adjusted basis. The major impact of the operating lease adjustment comes in
long-term asset ratios, with small secondary impacts in the ratios that use cost of goods
sold. Due to the narrow impact of the operating lease adjustment in this section, we will
focus here on an analysis of As Reported numbers and quickly summarize the key
changes due to the adjustments at the end of the section.
TJX is extremely effici ent at man aging its working capital needs, with operating
working capital representing less than 1 percent of total sales in 2010. Tight inven-
tory ma nagement, a slightly s low payment policy ( seen in a 35.3 days payable), low
short-term debt, and the small accounts receivable balance (reflective of TJX’sdeci-
sion to outsource its bra nded c redit c ard) contribute to TJX’s l ow o perating working
capital levels.
Nordstrom is using its vendors to provide operating working capital even more
effectively (and is more willing perhaps to stretch out payments to vendors) than TJX
with days accounts payable in 2010 of 47.6. The primary driver of Nordstrom’smuch
higher ratio of operating working capital to sales (and thus lower operating working
capital turnover) of 16.5 percent in 2010 (as compared to 0.76 percent for TJX) is its
large accounts receivable balance that results f rom its previously d iscussed strategy of
financing its customer s through its in-house c redit card operations (which results in a
lengthy d ays accounts receivable of 76.6 in 2010 compared to 2.5 for TJX). Nordstrom
is quite efficient in managing its inventory with inventory turnover of 6.2 times in
2010, the same as TJX. This is interesting in that intuitively, one would expect that
TJX (as a company pursuing a low-cost, efficient supply chain strategy) would be
5-14
PART 2 • Business Analysis and Valuation Tools
Copyright 2012 Cengage Learning. All Rights Reserved. May not be copied, scanned, or duplicated, in whole or in part. Due to electronic rights, some third party content may be suppressed from the eBook and/or eChapter(s).
Editorial review has deemed that any suppressed content does not materially affect the overall learning experience. Cengage Learning reserves the right to remove additional content at any time if subsequent rights restrictions require it.

much more successful at ef ficie nt inventory management than a company such as
Nordstrom, which prides itself on a broad and differentiated selection. The ratios
show that Nordstrom appears to achieve both a broad selection and efficient i nventory
management at the same time.
TJX shows significantly better net long-term asset and PP&E utilization than Nord-
strom as seen in its higher net long-term asset and PP&E turnover ratios. This is reflec-
tive of the difference in store financing strategies discussed previously. When this
difference is adjusted for, these ratios are much more comparable, as seen in the compar-
ison of As Adjusted numbers for net long-terms assets/sales, PP&E/sales, net long-term
asset turnover, and PP&E turnover (which are just the inverse of the first two ratios).
There are small differences between As Reported and As Adjusted figures for inventory
turnover and accounts payable turnover and their inverse days’ inventory and days’
accounts payable, but these differences are minor and can be attributed to the adjust-
ment made to cost of goods sold.
Evaluating F inancial Management : Analyzing Financial Leverage
Financial leverage enables a firm to have an asset base larger than its equity. The firm
can augment its equity through borrowing and the creation of other liabilities such as
accounts payable, accrued liabilities, and deferred taxes. Financial leverage increases a
firm’s ROE as long as the cost of the liabilities is less than the return from investing
these funds. In this respect, it is important to distinguish between interest-bearing liabil-
ities such as notes payable, other forms of short-term and long-term debt that carry an
explicit interest charge, and other liabilities. Some of these other forms of liability, such
as accounts payable or deferred taxes, do not carry any interest charge at all. Others,
such as capital lease obligations and pension obligations, carry an implicit interest
charge. Finally, some firms carry large cash balances or investments in marketable secu-
rities. These balances reduce a firm’s net debt because conceptually the firm can pay
down its debt using its cash and short-term investments.
TABLE 5 -6 Asset Management Ratios
Year ended January 29, 2011 As Reported As Adjusted
..................................................................................................................................................
TJX Nordstrom TJX Nordstrom
Operating working capital/Sales 0.76% 16.5% 0.76% 16.5%
Net long-term assets/Sales 8.1% 18.4% 28.4% 24.4%
PP&E/Sales 11.3% 25.5% 31.3% 31.3%
..................................................................................................................................................
Operating working capital
turnover
132.2 6.1 132.2 6.1
Net long-term assets turnover 12.4 5.4 3.5 4.1
PP&E turnover 8.9 3.9 3.2 3.2
Accounts receivable turnover 148.2 4.8 148.2 4.8
Inventory turnover 6.2 6.2 5.9 6.1
Accounts payable turnover 10.3 7.7 9.9 7.6
..................................................................................................................................................
Days’ accounts receivable 2.5 76.6 2.5 76.6
Days’ inventory 59.3 58.9 61.9 59.5
Days’ accounts payable 35.3 47.6 36.9 48.1
..................................................................................................................................................
Source: © Cengage Learning 2013
Financial Analysis 5-15
Copyright 2012 Cengage Learning. All Rights Reserved. May not be copied, scanned, or duplicated, in whole or in part. Due to electronic rights, some third party content may be suppressed from the eBook and/or eChapter(s).
Editorial review has deemed that any suppressed content does not materially affect the overall learning experience. Cengage Learning reserves the right to remove additional content at any time if subsequent rights restrictions require it.

While financial leverage can potentially benefit a firm’s shareholders, it can also
increase their risk. Unlike equity, liabilities have predefined payment terms, and the
firm faces risk of financial distress if it fails to meet these commitments. There are a
number of ratios to evaluate the degree of risk arising from a firm’ s financial leverage.
Current Liabilities and Short-Term Liquidity
The following ratios are useful in evaluating the risk related to a firm’s current liabilities:
Current ratio ¼
Current assets
Current liabilities
Quick ratio ¼
Cash þ Short-term investments þ Accounts receivable
Current liabilities
Cash ratio ¼
Cash þ Marketable securities
Current liabilities
Operating cash flow ratio ¼
Cash flow from operations
Current liabilities
All the above ratios attempt to measure the firm’s ability to repay its current liabili-
ties. The first three compare a firm’s current liabilities with its short-term assets that
can be used to repay those liabilities. The fourth ratio focuses on the ability of the
firm’s operations to generate the resources needed to repay its current liabilities.
Since both current assets and current liabilities have comparable duration, the cur-
rent ratio is a key index of a firm’s short-term liquidity. Analysts vi ew a current ratio
of more than one to be an i ndication that the firm can cover its current liabilities
from the cash realized from its c urrent assets. However, the firm can face a short-
term liquidity problem even with a current ratio exceeding one when some of its
current assets are not easy to liquidate. Quick rati o a nd cash ratio capture th e f irm’s
ability to cover its current liabilities fro m liquid assets. Qu ick ratio assumes that the
firm’saccountsreceivableareliquid.Thisistrueinindustrieswherethecredit-
worthiness of the customers is beyond dispute, or when receivables are collected in a
very shor t per iod. When these conditions do not prevail, cash rat io, which considers
only cash and marketable securiti es, is a better indication of a firm’s ability to cover its
current liabilit ies in an emergen cy. Operat ing cash flow is another measure o f the firm’s
ability to cover its current liabilities from cash generated from operations of the firm.
The liquidity ratios for TJX and Nordstrom are shown in Table 5-7. Nordstrom’s sig-
nificantly higher accounts receivable balances drive its higher current and quick ratios
TABL E 5 -7 Liquidity Ratios
Year ended January 29, 2011 As Reported As Adjusted
..................................................................................................................................................................................
TJX Nordstrom TJX Nordstrom
Current ratio 1.66 2.01 1.66 2.01
Quick ratio 0.65 1.41 0.65 1.41
Cash ratio 0.60 0.39 0.60 0.39
Operating cash flow ratio 0.73 0.62 0.73 0.62
..................................................................................................................................................................................
Source: © Cengage Learning 2013
5-16 PART 2 • Business Analysis and Valuation Tools
Copyright 2012 Cengage Learning. All Rights Reserved. May not be copied, scanned, or duplicated, in whole or in part. Due to electronic rights, some third party content may be suppressed from the eBook and/or eChapter(s).
Editorial review has deemed that any suppressed content does not materially affect the overall learning experience. Cengage Learning reserves the right to remove additional content at any time if subsequent rights restrictions require it.

relative to TJX. The cash ratios are somewhat more comparable given that accounts
receivable is not included in this calculation and both companies have a healthy cash
balance in 2010. TJX’s operating cash flow ratio was slightly ahead of that of Nordstrom,
indicating overall stronger cash flow from operations relative to its current liabilities. In
general, both firms’ liquidity situations are comfortable and are not likely to be a point
of concern for short-term creditors. Finally, it can be noted that the operating lease
adjustment had no impact on these ratios.
Debt and Long-Term Solven cy
Acompany’s financial leverage is also influenced by its debt financing policy. There are sev-
eral potential benefits from debt financing. First, debt is typically cheaper than equity
because the firm promises predefined payment terms to debt holders. Second, in most coun-
tries interest on debt financing is tax deductible whereas dividends to shareholders are not
tax deductible. Third, debt financing can impose discipline on the firm’s management and
motivate it to reduce wasteful expenditures. Fourth, for non-public debt, it is likely to be
easier for management to communicate their proprietary information on the firm’sstrate-
gies and prospects to private lenders than to public capital markets. Such communication
can potentially reduce a firm’s cost of capital. For all these reasons, it is advantageous for
firms to use at least some debt in their capital structure. Too much reliance on debt financ-
ing, however, is potentially costly to the firm’s shareholders. The firm will face financial dis-
tress if it defaults on the interest and principal payments. Debt holders also impose
covenants on the firm, restricting the firm’s operating, investment, and financing decisions.
The optimal capital structure for a firm is determined primarily by its business risk. A
firm’s cash flows are highly predictable when there is little competition or there is little
threat of technological changes. Such firms have low business risk; hence they can rely
heavily on debt financing. In contrast, if a firm’s operating cash flows are highly volatile
and its capital expenditure needs are unpredictable, it may have to rely primarily on
equity financing. Managers’ attitudes toward risk and financial flexibility also often
determine a firm’s debt policies.
There are a number of ratios that help the analyst in this area. To evaluate the mix of
debt and equity in a firm’s capital structure, the following ratios are useful:
Liabilities to equity ratio ¼
Total liabilities
Shareholders’ equity
Debt-to-equity ratio ¼
Short-term debt þ Long-term debt
Shareholders’ equity
Net-debt-to-equity ratio
¼
Short-term debt þ Long-term debt Cash and marketable securities
Shareholders’ equity
Debt-to-capital ratio
¼
Short-term debt þ Long-term debt
Short-term debt þ Long-term debt þ Shareholders’ equity
Net-debt-to-net-capital ratio
¼
Interest bearing liabilities Cash and marketable securities
Interest bearing liabilities Cash and marketable securities þ Shareholders’ equity
Financial Analysis 5-17
Copyright 2012 Cengage Learning. All Rights Reserved. May not be copied, scanned, or duplicated, in whole or in part. Due to electronic rights, some third party content may be suppressed from the eBook and/or eChapter(s).
Editorial review has deemed that any suppressed content does not materially affect the overall learning experience. Cengage Learning reserves the right to remove additional content at any time if subsequent rights restrictions require it.

The first ratio reformulates one of the three primary ratios underlying ROE, the
assets-to-equity ratio (it is the assets-to-equity ratio minus one). The second ratio pro-
vides an indication of how many dollars of debt financing the firm is using for each dol-
lar invested by its shareholders. The third ratio uses net debt, which is total debt minus
cash and marketable securities, as the measure of a firm’s borrowings. The fourth and
fifth ratios measure debt as a proportion of total capital. In calculating all the above
ratios, it is important to include all interest-bearing obligations, whether the interest
charge is explicit or implicit. Recall that examples of line items that carry an implicit
interest charge include capital lease obligations and pension obligations.
Analysts sometimes include any potential off-balance-sheet obligations that a firm
may have, such as non-cancellable operating leases, in the definition of a firm’s debt.
We show that (as previously described) in the As Adjusted numbers in our TJX and
Nordstrom example.
The ease with which a firm can meet its interest payments is an indication of the
degree of risk associated with its debt policy. The interest coverage ratio provides a mea-
sure of this construct:
Interest coverage ðearnings basisÞ¼
Net income þ Interest expense þ Tax expense
Interest expense
Interest coverage ðcash flow basisÞ
¼
Cash flow from operations þ Interest expense þ Taxes paid
Interest expense
The earnings-based coverage ratio indicates the dollars of earnings available for each
dollar of required interest payment; the cash-flow-based coverage ratio indicates the dol-
lars of cash generated by operations for each dollar of required interest payment. In both
these ratios, the denominator is the interest expense. In the numerator we add taxes back
because taxes are computed only after interest expense is deducted. A coverage ratio of
one implies that the firm is barely covering its interest expense through its operating
activities, which is a very risky situation. The larger the coverage ratio, the greater the
cushion the firm has to meet interest obligations.
Key Analysis Questions
Some of the business questions to ask when the analyst is examining a firm’s debt
policies follow:
• Does the company have enough debt? Is it exploiting the potential benefits of
debt—interest tax shields, management discipline, and easier communication?
• Does the company have too much debt given its business risk? What type of
debt covenant restrictions does the firm face? Is it bearing the costs of too
much debt, risking potential financial distress and reduced business flexibility?
• What is the company doing with the borrowed funds? Investing in working cap-
ital? Investing in fixed assets? Are these investments profitable?
• Is the company borrowing money to pay dividends? If so, what is the
justification?
We show debt and coverage ratios for TJX and Nordstrom in Table 5-8. On an As
Reported basis, TJX carries a much lower debt load than Nordstrom, which is reflected
5-18
PART 2 • Business Analysis and Valuation Tools
Copyright 2012 Cengage Learning. All Rights Reserved. May not be copied, scanned, or duplicated, in whole or in part. Due to electronic rights, some third party content may be suppressed from the eBook and/or eChapter(s).
Editorial review has deemed that any suppressed content does not materially affect the overall learning experience. Cengage Learning reserves the right to remove additional content at any time if subsequent rights restrictions require it.

in the As Reported debt ratios shown in Table 5-8. As discussed, this makes sense given
that Nordstrom finances its ownership of a large proportion of its stores with long-term
debt, while TJX avoids this debt with the use of operating leases. In addition, TJX shows
extraordinarily high interest coverage ratios, but this picture changes when one again
considers TJX’s store leasing strategy. When both companies are adjusted for the impact
of their operating lease usage, the debt ratios align much more closely, as seen in the As
Adjusted ratios in Table 5-8.
If the present value of minimum lease rental obligations is added to TJX’s net debt, its
net debt to equity ratio increases dramatically—which can be seen in the As Adjusted net
debt to equity. The impact of the operating lease adjustment is similar but of much less
magnitude for Nordstrom given its more limited use of operating leases. Also, notice
how the additional interest expense added as part of the operating lease adjustment
brings the interest coverage ratios of the companies much closer together (seen in As
Adjusted interest coverage). These items illustrate the importance of considering off-
balance sheet obligations in analyzing a company’s financial management. In general,
both companies are in a relatively comfortable situation relative to their fixed obligations,
even after factoring in operating lease commitments.
Ratios of Disaggregated Data
So far we have discussed how to compute ratios using information in the financial
statements. Analysts often probe the above ratios further by using disaggregated finan-
cial and physical data. For example, for a multibusiness company, one could analyze
the information by individual business segments. Such an analysis can re veal potential
differences in the performance of each business un it, allowing the analyst to pinpoint
areas where a company’s strategy is working and where it is not. It i s also possible to
probe financial ratios further by computing ratios of physical data pertaining to a com-
pany’s operations. The appropriate physical data to look at varies from industry to
industry. As an example in retailing, one c ould compute productivity statistics such as
sales per store, sales per square foot, customer transactions per store, and average
amount of sale per customer transaction. In the hotel industry, room occupancy rates
provide important information; in the cellular telephone industry, acquisition cost per
new subscriber and subscriber retention rate are import ant. These disaggregated ratios
are particularly useful for young firms and young industries such as Internet firms,
where accounting data may not fully capture the business economics due to conserva-
tive accounting rules.
TABLE 5 -8 Debt and Coverage Ratios
Year ended January 29, 2011 As Reported As Adjusted
.....................................................................................................................................................................
.
TJX Nordstrom TJX Nordstrom
Liabilities to equity 1.58 3.19 3.12 3.55
Debt to equity 0.27 1.66 1.81 2.03
Net debt to equity −0.33 1.16 1.21 1.52
Debt to capital 0.22 0.62 0.64 0.67
Net debt to net capital −0.49 0.54 0.55 0.60
Interest coverage (earnings based) 45.2 8.5 9.7 7.0
Interest coverage (cash flow based) 60.1 13.3 14.1 11.2
.....................................................................................................................................................................
.
Source: © Cengage Learning 2013
Financial Analysis 5-19
Copyright 2012 Cengage Learning. All Rights Reserved. May not be copied, scanned, or duplicated, in whole or in part. Due to electronic rights, some third party content may be suppressed from the eBook and/or eChapter(s).
Editorial review has deemed that any suppressed content does not materially affect the overall learning experience. Cengage Learning reserves the right to remove additional content at any time if subsequent rights restrictions require it.
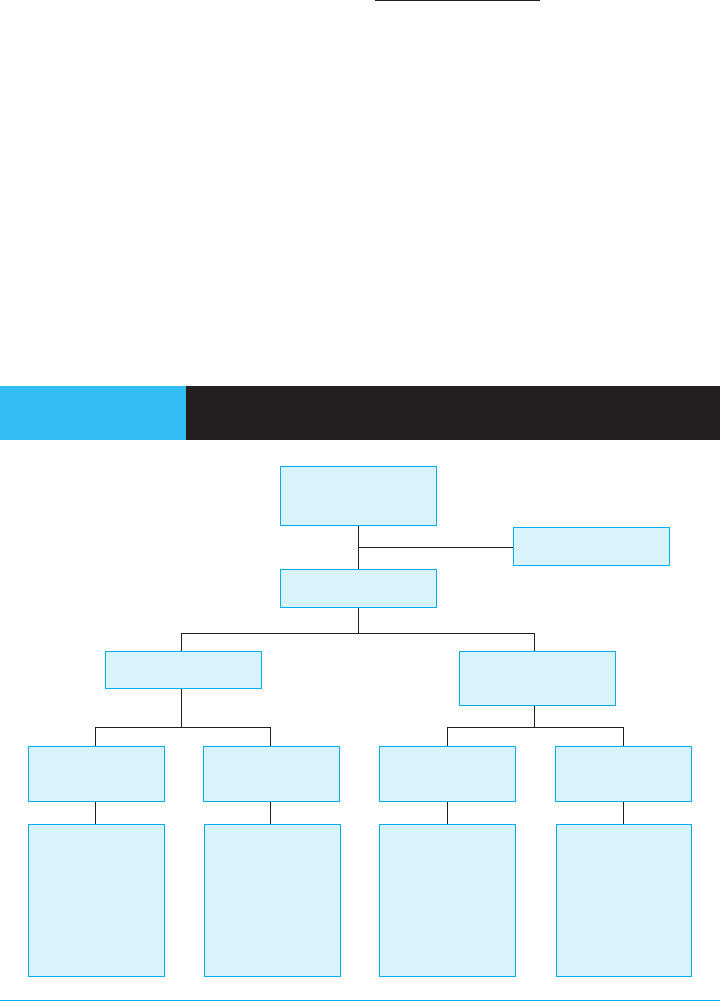
Putting It All Together: Assessing Sustainable Growth Rat e
Analysts often use the concept of sustainable growth as a way to evaluate a firm’s ratios
in a comprehensive manner. A firm’s sustainable growth rate is defined as
Sustainable growth rate ¼ ROE ð1 Dividend payout ratioÞ
We already discussed the analysis of ROE in the previous four sections. The dividend
payout ratio is defined as
Divided payout ratio ¼
Cash dividends paid
Net income
A firm’s dividend payout ratio is a measure of its dividend policy. Firms pay dividends
for several reasons. They provide a way to return to shareholders any cash generated in
excess of the firm’s operating and investment needs. When there are information asym-
metries between a firm’s managers and its shareholders, dividend payments can serve as
a signal to shareholders about managers’ expectations of the firm’s future prospects.
Firms may also pay dividends to attract a certain type of shareholder base.
Sustainable growth rate is the rate at which a firm can grow while keeping its profit-
ability and financial policies unchanged. A firm’s return on equity and its dividend
payout policy determine the pool of funds available for growth. Of course the firm can
grow at a rate different from its sustainable growth rate if its profitability, payout policy,
or financial leverage changes. Therefore, the sustainable growth rate provides a bench-
mark against which a firm’s growth plans can be evaluated. Figure 5-2 shows how a
firm’s sustainable growth rate can be linked to all the ratios discussed in this chapter.
FIGURE 5-2 Sustainable Growth Rate Framework for Financial Ratio
Analysis
SUSTAINABLE
GROWTH RATE
ROE
Operating ROA
Net Operating
Prot Margin
Gross prot margin
SG&A/Sales
R&D/Sales
Effective tax rate on
operating prots
Operating working
capital turnover
Operating long-term
asset turnover
Receivables turnover
Inventory turnover
Payables turnover
Net effective interest
rate
Interest income/Cash
and marketable
securities
Interest expense/
Total debt
Debt/Equity
Cash and marketable
securities/Equity
Interest coverage
• earnings basis
• cash basis
Operating Asset
Turnover
Spread
Net Financial
Leverage
Financial
Leverage Effect
Dividend Payout
Source: © Cengage Learning
5-20 PART 2 • Business Analysis and Valuation Tools
Copyright 2012 Cengage Learning. All Rights Reserved. May not be copied, scanned, or duplicated, in whole or in part. Due to electronic rights, some third party content may be suppressed from the eBook and/or eChapter(s).
Editorial review has deemed that any suppressed content does not materially affect the overall learning experience. Cengage Learning reserves the right to remove additional content at any time if subsequent rights restrictions require it.

These linkages allow an analyst to examine the drivers of a firm’s current sustainable
growth rate. If the firm intends to grow at a higher rate than its sustainable growth
rate, one could assess which of the ratios are likely to change in the process.
Key Analysis Questions
Analysis of sustainable growth can lead to asking the following types of business
questions:
• How quickly can the firm grow its business by keeping its profitability and
financial policies unchanged?
• If it intends growing faster, where is the growth going to come from? Is man-
agement expecting profitability to increase? Or asset productivity to improve?
Are these expectations realistic? Is the firm planning for these changes?
• If the firm is planning to increase its financial leverage or cut dividends, what is
the likely impact of these financial policy changes?
Table 5-9 shows the sustainable growth rate and its components for TJX and Nord-
strom. TJX had a significantly higher sustainable growth rate relative to Nordstrom on
both an As Reported and As Adjusted basis, due to both its higher ROEs and a lower
dividend payout ratio. TJX’s actual sales, asset, and liability growth rates in 2010 were
considerably lower than implied by its sustainable growth rate, reflecting management’s
balanced approach to growth, investment, and returning funds to shareholders in the
form of dividends and stock repurchase.
Historical Patterns of Ratios for U.S. Firms
To provide a benchmark for analysis, Table 5-10 reports historical values of the key ratios
discussed in this chapter. These ratios are calculated using financial statement data for all
publicly listed U.S. companies. The table shows the values of ROE, its key components, and
the sustainable growth rate for each of the years 1991 to 2010, and the average for this twenty
year period. The data show that the average ROE over this time frame has been 10.3 percent,
average operating ROA has been 9.0 percent, and the average spread between operating
ROA and net borrowing costs after tax has been 2.5 percent. The average sustainable growth
rate for U.S. companies during this period has been 4.9 percent. Of course, an individual
company’s ratios might depart from these economy-wide averages for a number of reasons,
such as industry effects, company strategies, and management effectiveness. Nonetheless, the
average values in the table serve as useful benchmarks in financial analysis.
TABLE 5 -9 Sustainable Growth Rate
Year ended January 29, 2011 As Reported As Adjusted
.....................................................................................................................................................................
.
TJX Nordstrom TJX Nordstrom
Return on equity 46.5% 39.0% 55.4% 40.0%
Dividend payout ratio 17.1% 27.2% 17.1% 27.2%
Sustainable growth rate 38.6% 28.4% 45.9% 29.1%
.....................................................................................................................................................................
.
Source: © Cengage Learning 2013
Financial Analysis 5-21
Copyright 2012 Cengage Learning. All Rights Reserved. May not be copied, scanned, or duplicated, in whole or in part. Due to electronic rights, some third party content may be suppressed from the eBook and/or eChapter(s).
Editorial review has deemed that any suppressed content does not materially affect the overall learning experience. Cengage Learning reserves the right to remove additional content at any time if subsequent rights restrictions require it.

CASH FLOW ANALYSIS
The ratio analysis discussion focused on analyzing a firm’s income statement (net profit
margin analysis) or its balance sheet (asset turnover and financial leverage). The analyst
can get further insights into the firm’s operating, investing, and financing policies by
examining its cash flows. Cash flow analysis also provides an indication of the quality
of the information in the firm’s income statement and balance sheet. As before, we will
illustrate the concepts discussed in this section using TJX’s and Nordstrom’s cash flows.
Cash Flow and Funds Flow Statements
All U.S. companies are required to include a statement of cash flows in their financial
statements under Statement of Financial Accounts Standard No. 95 (SFAS 95). In the
cash flow statement, firms report their cash flows in three categories: cash flow from
operations, cash flow related to investments, and cash flow related to financing activi-
ties. Cash flow from operations is the cash generated by the firm from the sale of goods
and services after paying for the cost of inputs and operations. Cash flow related to
investment activities shows the cash paid f or capital expenditures, intercorporate
investments, acquisitions, and cash received from the sales of long-term assets.
TABLE 5 -10 Historical Values of Key Financial Ratios
Year ROE
NOPAT
Margin
Operating
Asset
Turnover
Operating
ROA Spread
Net
Financial
Leverage
Sustainable
Growth
Rate
......................................................................................................................................................
1991 6.6% 6.3% 1.55 7.2% 0.1% 1.20 0.5%
1992 4.4% 4.4% 1.60 6.1% 0.6% 1.14 1.6%
1993 8.8% 5.0% 1.67 6.5% 0.7% 1.17 2.6%
1994 14.0% 7.1% 1.77 11.0% 3.9% 1.16 7.9%
1995 13.8% 6.1% 1.83 8.3% 6.8% 1.11 7.3%
1996 14.8% 6.6% 1.83 9.4% 7.5% 1.14 8.7%
1997 13.8% 7.5% 1.83 10.4% 3.7% 1.11 8.2%
1998 13.1% 7.9% 1.76 9.7% 2.3% 1.22 7.4%
1999 13.5% 7.8% 1.69 9.9% 3.8% 1.25 8.4%
2000 10.1% 7.0% 1.71 8.0% 1.8% 1.31 5.2%
2001 1.4% 4.0% 1.47 3.0% 3.0% 1.34 2.7%
2002 2.2% 1.7% 1.31 2.7% 7.9% 1.51 4.4%
2003 13.3% 8.3% 1.57 9.5% 3.5% 1.58 8.7%
2004 13.3% 8.0% 1.70 10.1% 3.4% 1.49 8.3%
2005 13.8% 9.0% 1.78 11.9% 3.7% 1.21 8.2%
2006 16.7% 10.3% 1.88 14.1% 7.4% 1.23 11.1%
2007 12.1% 8.8% 1.75 12.4% 5.2% 1.23 6.6%
2008 0.1% 3.4% 1.68 6.8% 0.7% 1.33 4.7%
2009 8.9% 7.6% 1.49 9.8% 3.3% 1.31 4.4%
2010 12.4% 10.3% 1.65 12.9% 5.6% 1.04 7.9%
......................................................................................................................................................
Average 10.3% 6.9% 1.68 9.0% 2.5% 1.23 4.9%
......................................................................................................................................................
Ratios are based on beginning balance sheet data.
Source: Financial statement data for all publicly traded U.S. companies between 1991 and 2010, listed in
Standard & Poor’s Compustat database.
5-22 PART 2 • Business Analysis and Valuation Tools
Copyright 2012 Cengage Learning. All Rights Reserved. May not be copied, scanned, or duplicated, in whole or in part. Due to electronic rights, some third party content may be suppressed from the eBook and/or eChapter(s).
Editorial review has deemed that any suppressed content does not materially affect the overall learning experience. Cengage Learning reserves the right to remove additional content at any time if subsequent rights restrictions require it.
Cash flow related to financing activities shows the cash raised from (or paid to) the
firm’s stockholders and de bt holders.
Firms use two cash flow statement formats: the direct format and the indirect format.
The key difference between the two formats is the way they report cash flow from oper-
ating activities. In the direct cash flow format, which is used by only a small number of
firms, operating cash receipts and disbursements are reported directly. In the indirect
format, firms derive their operating cash flows by making adjustments to net income.
Because the indirect format links the cash flow statement with the firm’s income state-
ment and balance sheet, many analysts and managers find this format more useful. As a
result, the FASB requires firms using the direct format to report operating cash flows in
the indirect format as well.
Recall from Chapter 3 that net income differs from operating cash flows because
revenues and expenses are measured on an accrual basis. There are two types of
accruals embedded in net income. First, the re are current accruals like credit sales
and unpaid expenses. Current accruals result in changes in a firm’s current assets
(such as accounts receivable, inventory, prepaid expenses) and current liabilities (such
as accounts payable and accrued liabilities). The second type of accruals included in the
income statement is noncurrent accruals such as depreciation, deferred taxes, and
equity income from unconsolidated subsidiaries. To derive cash flow from operations
from net income, adjustments h ave to be made for both these types of accruals. In
addition, adjustment s must be made for nonoperating gains included in net income
such as profits from asset sales.
Some firms outside the United States report a funds flow statement rather than a cash
flow statement of the type described above. Prior to SFAS 95, U.S. firms also reported a
similar statement. Funds flow statements show working capital flows, not cash flows. It is
useful for analysts to know how to convert a funds flow statement into a cash flow
statement.
Funds flow statements typically provide information on a firm’s working capital
from operations , d efined as net income adjusted for noncurrent accruals, and gains
from the sale of long-term assets. As discussed above, cash flow from operations essen-
tially involves a third adjustment, the adjustment for current accruals. Thus it is
relatively straightforward to convert working capital from operations to cash flow
from operations by making the relevant adjustments for current accruals related to
operations.
Information on current accruals can be obtained by examining changes in a firm’s
current assets and current liabilities. Typically, operating accruals represent changes in
all the current asset accounts other than cash and cash equivalents, and changes in all
the current liabilities other than notes payable and the current portion of long-term
debt.
14
Cash from operations can be calculated as follows:
Working capital from operations
Increase (or þ decrease) in accounts receivable
Increase (or þ decrease) in inventory
Increase (or þ decrease) in other curren t assets exc luding cash and
cash equivalents
þ Increase (or decrease) in accounts payable
þ Increase (or decrease) in other current liabilities excluding debt.
Funds flow statements also often do not classify investment and financing flows. In
such a case, the analyst has to classify the line items in the funds flow statement into
these two categories by evaluating the nature of the business transactions that give rise
to the flow represented by the line items.
Financial Analysis 5-23
Copyright 2012 Cengage Learning. All Rights Reserved. May not be copied, scanned, or duplicated, in whole or in part. Due to electronic rights, some third party content may be suppressed from the eBook and/or eChapter(s).
Editorial review has deemed that any suppressed content does not materially affect the overall learning experience. Cengage Learning reserves the right to remove additional content at any time if subsequent rights restrictions require it.
Analyzing Cash Flow Information
Cash flow analysis can be used to address a variety of questions regarding a firm’s cash
flow dynamics:
• How strong is the firm’s internal cash flow generation? Is the cash flow from
operations positive or negative? If it is negative, why? Is it because the company
is growing? Is it because its operations are unprofitable? Or is it having difficulty
managing its working capital properly?
• Does the company have the ability to meet its short-term financial obligations,
such as interest payments, from its operating cash flow? Can it continue to meet
these obligations without reducing its operating flexibility?
• How much cash did the company invest in growth? Are these investments consis-
tent with its business strategy? Did the company use internal cash flow to finance
growth, or did it rely on external financing?
• Did the company pay dividends from internal free cash flow, or did it have to rely
on external financing? If the company had to fund its dividends from external
sources, is the company’s dividend policy sustainable?
• What type of external financing does the company rely on? Equity, short-term
debt, or long-term debt? Is the financing consistent with the company’s overall
business risk?
• Does the company have excess cash flow after making capital investments? Is it a
long-term trend? What plans does management have to deploy the free cash flow?
While the information in reported cash flow statements can be used to answer the
above questions directly in the case of some firms, it may not be easy to always do so
for a number of reasons. First, even though SFAS 95 provides broad guidelines on the
format of a cash flow statement, there is still significant variation across firms in how
cash flow data are disclosed. Therefore, to facilitate a systematic analysis and comparison
across firms, analysts often recast the information in the cash flow statement using their
own cash flow model. Second, firms include interest expense and interest income in
computing their cash flow from operating activities. However, these two items are not
strictly related to a firm’s operations. Interest expense is a function of financial leverage,
and interest income is derived from financial assets rather than operating assets. There-
fore it is useful to restate the cash flow statement to take this into account.
Analysts use a number of different approaches to restate the cash flow data. One such
model is shown in Table 5-11. This presents cash flow from operations in two stages.
The first step computes cash flow from operations before operating working capital
investments. In computing this cash flow, the model excludes interest expense and inter-
est income. To compute this number starting with a firm’s net income, an analyst adds
back three types of items: (1) after-tax net interest expense because this is a financing
item that will be considered later; (2) non-operating gains or losses typically arising out
of asset disposals or asset write-offs because these items are investment related and will
be considered later; and (3) long-term operating accruals such as depreciation and
deferred taxes because these are non-cash operating charges.
Several factors affect a firm’s ability to generate positive cash flow from operations.
Healthy firms that are in a steady state should generate more cash from their custo-
mers than they spend on operating expenses. In contrast, growing firms—especially
those with heavy outlays for research and development, advertising and marketing, or
building an organization to sustain future growth—may experience negative operating
cash flow. Firms’ working capital management also affects whether they generate posi-
tive cash flow from operations. Firms in the growing stage typically use cash flow for
5-24
PART 2 • Business Analysis and Valuation Tools
Copyright 2012 Cengage Learning. All Rights Reserved. May not be copied, scanned, or duplicated, in whole or in part. Due to electronic rights, some third party content may be suppressed from the eBook and/or eChapter(s).
Editorial review has deemed that any suppressed content does not materially affect the overall learning experience. Cengage Learning reserves the right to remove additional content at any time if subsequent rights restrictions require it.

operating working capital items such as funding customers (accounts receivable) and
purchasing inventories (net of accounts payable financing from suppliers). Net invest-
ments in working capital are a function of firms’ credit policies (accounts receivable),
payment policies (payables, prepaid expenses, and accrued liabilities), and expected
growth in sales (inventories). Thus, in interpreting firms’ cash flow from operations
after working capital, it is important to keep in mind their growth strategy, industry
characteristics, and credit policies.
The cash flow analysis model next focuses on cash flows related to long-term invest-
ments. These investments take the form of capital expenditures, intercorporate invest-
ments, and mergers and acquisitions. Any positive operating cash flow after making
operating working capital investments allows the firm to pursue long-term growth
opportunities. If the firm’s operating cash flows after working capital investments are
not sufficient to finance its long-term investments, it has to rely on external financing
to fund its growth. Such firms have less flexibility to pursue long-term investments
than those that can fund their growth internally. There are both costs and benefits
from being able to fund growth internally. The cost is that managers can use the inter-
nally generated free cash flow to fund unprofitable investments. Such wasteful capital
expenditures are less likely if managers are forced to rely on external capital suppliers.
However, reliance on external capital markets may make it difficult for managers to
TABLE 5-11 Cash Flow Analysis
Year ended January 29, 2011 As Reported As Adjusted
.....................................................................................................................................................................
.
TJX Nordstrom TJX Nordstrom
Net Income 1,343.1 613.0 1,600.3 629.1
After-tax net interest expense (income) 24.2 78.6 176.0 101.2
Non-operating losses (gains) 158.4 0.0 162.0 0.0
Long-term operating accruals 587.8 465.0 1,087.6 510.5
.....................................................................................................................................................................
.
Operating cash flow before working
capital investments
2,113.5 1,156.6 3,025.9 1,240.8
Net (investments in) or liquidation of
operating working capital
(5.0) 99.0 (5.0) 99.0
.....................................................................................................................................................................
.
Operating cash flow before
investment in long-term assets
2,108.5 1,255.6 3,020.9 1,339.8
Net (investment in) or liquidation of
operating long-term assets
(708.2) (462.0) (2,591.2) (630.6)
.....................................................................................................................................................................
.
Free cash flow available to debt
and equity
1,400.3 793.6 429.7 709.2
After-tax net interest income (expense) (24.2) (78.6) (176.0) (101.2)
Net debt (repayment) or issuance (2.4) 179.0 1,120.0 286.0
.....................................................................................................................................................................
.
Free cash flow available to equity 1,373.7 894.0 1,373.7 894.0
Dividend (payments) (229.3) (167.0) (229.3) (167.0)
Net stock issuance (repurchase),
and other equity changes
(1,017.2) (16.0) (1,017.2) (16.0)
Netincrease (decrease) incash balance 127.2 711.0 127.2 711.0
.....................................................................................................................................................................
.
Source: © Cengage Learning 2013
Financial Analysis 5-25
Copyright 2012 Cengage Learning. All Rights Reserved. May not be copied, scanned, or duplicated, in whole or in part. Due to electronic rights, some third party content may be suppressed from the eBook and/or eChapter(s).
Editorial review has deemed that any suppressed content does not materially affect the overall learning experience. Cengage Learning reserves the right to remove additional content at any time if subsequent rights restrictions require it.

undertake long-term risky investments if it is not easy to communicate to the capital
markets the benefits from such investments.
Any excess cash flow after these long-term investments is free cash flow that is
available for both d ebt holders and equity holders . D ebt cash transactions include
interest payments and principal payments as well as new borrowing. Cash flow after
payments to debt holders is free cash flow available to equity holders. Cash transac-
tions involving shareholders include dividend payments and stock repurchases, as well
as issues of new equity.
Firms with negative free cash flow to both debt and equity have to borrow additional
funds to meet their interest and debt repayment obligations, cut dividend payments, or
issue additional equity. Managers of firms in this situation are often reluctant to cut divi-
dends for fear that it will be viewed negatively by investors. While this may be feasible in
the short term, it is not prudent for a firm to continue to pay dividends to equity holders
unless it has a positive free cash flow on a sustained basis. In contrast, firms with large
positive free cash flow to debt and equity run the risk of making unproductive invest-
ments to pursue growth for its own sake. An analyst, therefore, should carefully examine
the investment plans of such firms.
The model in Table 5-11 suggests that the analyst should focus on a number of cash
flow measures: (1) cash flow from operations before investment in working capital and
interest payments, to examine whether or not the firm is able to generate a cash surplus
from operations; (2) cash flow from operations after investment in working capital, to
assess how the firm’s working capital is being managed and whether or not it has the
flexibility to invest in long-term assets for future growth; (3) free cash flow available to
debt and equity holders, to assess a firm’s ability to meet its interest and principal pay-
ments; and (4) free cash flow available to equity holders, to assess the firm’s financial
ability to sustain its dividend policy and to identify potential agency problems from
excess free cash flow. These measures have to be evaluated in the context of the com-
pany’s business, its growth strategy, and its financial policies. Further, changes in these
measures from year to year provide valuable information on the stability of the cash flow
dynamics of the firm.
Key Analysis Questions
The cash flow model in Table 5-11 can also be used to assess a firm’s earnings qual-
ity. The reconciliation of a firm’s net income with its cash flow from operations
facilitates this exercise. Following are some of the questions an analyst can probe
in this respect:
• Are there significant differences between a firm’s net income and its operating
cash flow? Is it possible to clearly identify the sources of this difference? Which
accounting policies contribute to this difference? Are there any one-time events
contributing to this difference?
• Is the relationship between cash flow and net income changing over time? Why?
Is it because of changes in business conditions or because of changes in the
firm’s accounting policies and estimates?
• What is the time lag between the recognition of revenues and expenses and the
receipt and disbursement of cash flows? What type of uncertainties need to be
resolved in between?
• Are the changes in receivables, inventories, and payables normal? If not, is there
adequate explanation for the changes?
5-26
PART 2 • Business Analysis and Valuation Tools
Copyright 2012 Cengage Learning. All Rights Reserved. May not be copied, scanned, or duplicated, in whole or in part. Due to electronic rights, some third party content may be suppressed from the eBook and/or eChapter(s).
Editorial review has deemed that any suppressed content does not materially affect the overall learning experience. Cengage Learning reserves the right to remove additional content at any time if subsequent rights restrictions require it.

Finally, as we will discuss in Chapter 7, free cash flow available to debt and equity and
free cash flow available to equity are critical inputs into the cash-flow-based valuation of
firms’ assets and equity, respectively.
Analysis of TJX’s and Nordstrom’sCashFlow
Both TJX and Nordstrom reported their cash flows using the indirect cash flow state-
ment. Table 5-11 recasts these statements using the approach discussed above so that
we can analyze the two companies’ cash flow dynamics.
The cash flow analysis presented in Table 5-11 shows that on an As Reported basis
TJX had an operating cash flow before working capital investments of $2.114 billion in
2010. The difference between its earnings and this cash flow is attributable primarily to
depreciation and amortization charges, which is a non-cash expense that is included in
the company’s income statement. TJX made a small net investment in operating working
capital (the result of increases in accounts receivable and inventory netted out against
increases in accounts payable, income taxes payable, and inventory) resulting in an oper-
ating cash flow before investment in long-term assets of $2.109 billion for 2010. Invest-
ment in store renovations and improvements, fit ups for new stores, and expansion of
office and distribution centers comprised the bulk of net investment in operating
long-term assets of $708.2 million, resulting in a free cash flow available to debt and
equity of $1.4 billion in 2010. Netting out a small amount of after-tax net interest income
and debt repayment resulted in a free cash flow available to equity of $1.37 billion. As part
of an ongoing share repurchase program, TJX repurchased roughly $1.0 billion in shares.
That, combined with a dividend of $229.3 million resulted in a net increase of cash of
$127.2 million in 2010. Generally, TJX had a strong cash flow situation in 2010, as it was
able to fund its rapid expansion, an increasing dividend to shareholders, and an aggressive
share repurchase program while increasing its cash balance.
Nordstrom’s As Reported operating cash flow before working capital investments was
$1.16 billion in 2010. By liquidating $99 million of operating capital mainly through
increases in accounts payable and other liabilities (partially offset by increases in
accounts receivable and inventory), Nordstrom was able to generate $1.26 billion in
operating cash flow before investment in long-term assets. Like TJX, Nordstrom invested
heavily in its expansion, leaving free cash flow available to debt and equity of $793.6 million
in 2010. Net proceeds from a $500 million debt issue, an increase in short-term borrowings,
and the reduction in after-tax net interest expense resulted in free cash flow available to
equity of $894 million. Like TJX, Nordstrom issued a dividend and bought back a small
amount of stock, resulting in a net increase in its cash balance of $711 million.
As discussed in Chapter 4 and shown in Table 5-11, bringing the operating leases
onto the balance sheet as capital leases boosts net income. It also increases operating
cash flows as adjustments for depreciation and the increase in deferred tax liability are
included in long-term operating accruals. In the investments segment, investments in
long-term assets increase as new lease agreements are entered and capitalized. Finally,
in the financing section, net debt issuance increases as debt is added from newly capital-
ized leases and annual payments are made for principal and interest (after-tax).
SUMMARY
This chapter presents two key tools of financial analysis: ratio analysis and cash flow
analysis. Both these tools allow the analyst to examine a firm’s performance and its
financial condition given its strategy and goals. Ratio analysis involves assessing the
firm’s income statement and balance sheet data. Cash flow analysis relies on the firm’s
Financial Analysis 5-27
Copyright 2012 Cengage Learning. All Rights Reserved. May not be copied, scanned, or duplicated, in whole or in part. Due to electronic rights, some third party content may be suppressed from the eBook and/or eChapter(s).
Editorial review has deemed that any suppressed content does not materially affect the overall learning experience. Cengage Learning reserves the right to remove additional content at any time if subsequent rights restrictions require it.

cash flow statement. In this chapter we applied these tools to TJX and Nordstrom in
order to compare the two firms’ performance on both an As Reported and As Adjusted
(for the use of off–balance sheet operating leases) basis.
The starting point for ratio analysis is the company’s ROE. The next step is to eval-
uate the three drivers of ROE, which are net profit margin, asset turnover, and finan-
cial leverage. Net profit margin reflects a firm’s operating management, asset turnover
reflects its investment management, and financial leverage reflects its financing policies.
Each of these areas can be further probed by examining a number of ratios. For exam-
ple, common-sized income statement analysis allows a detailed examination of a firm’s
net margins. Similarly, turnover of key working capital accounts such as accounts
receivable, inventory, and accounts payable, and turnover of the firm’s fixed assets,
allow further examination of a firm’s asset utilization. Finally, short-term liquidity
ratios, debt policy ratios, and coverage ratios provide a means of examining a firm’s
financial leverage.
A firm’s sustainable growth rate—the rate at which it can grow without altering its
operating, investment, and financing policies—is determined by its ROE and its dividend
policy. The concept of sustainable growth provides a way to integrate the different ele-
ments of ratio analysis and to evaluate whether or not a firm’s growth strategy is sustain-
able. If a firm’s plans call for growing at a rate above its current sustainable rate, then
one can analyze which of the firm’s ratios is likely to change in the future.
Cash flow analysis supplements ratio analysis in examining a firm’s operating
activities, investment management, and financial risks. Firms in the United States are
currently required to report a cash flow statement summarizing their operating, invest-
ment, and financing cash flows. Firms in other countries typically report working capital
flows, but it is possible to use this information to create a cash flow statement.
Since there are wide variations across firms in the way cash flow data are reported, ana-
lysts often use a standard format to recast cash flow data. We discussed one such cash flow
model in this chapter. This model allows the analyst to assess whether a firm’soperations
generate cash flow before investments in operating working capital, and how much cash is
being invested in the firm’s working capital. It also enables the analyst to calculate the
firm’s free cash flow after making long-term investments, which is an indication of the
firm’s ability to meet its debt and dividend payments. Finally, the cash flow analysis
shows how the firm is financing itself, and whether its financing patterns are too risky.
The insights gained from analyzing a firm’s financial ratios and its cash flows are
valuable in forecasting the firm’s future prospects.
DISCUSSION QUESTI ONS
1. Which of the following types of firms do you expect to have particularly high or low
asset turnover? Explain why.
• a supermarket
• a pharmaceutical company
• a jewelry retailer
• a steel company
2. Which of the following types of firms do you expect to have high or low sales
margins? Why?
• a supermarket
• a pharmaceutical company
• a jewelry retailer
• a software company
5-28
PART 2 • Business Analysis and Valuation Tools
Copyright 2012 Cengage Learning. All Rights Reserved. May not be copied, scanned, or duplicated, in whole or in part. Due to electronic rights, some third party content may be suppressed from the eBook and/or eChapter(s).
Editorial review has deemed that any suppressed content does not materially affect the overall learning experience. Cengage Learning reserves the right to remove additional content at any time if subsequent rights restrictions require it.

3. James Broker, an analyst with an established brokerage firm, comments: “The criti-
cal number I look at for any company is operating cash flow. If cash flows are less
than earnings, I consider a company to be a poor performer and a poor investment
prospect.” Do you agree with this assessment? Why or why not?
4. In 2005 IBM had a return on equity of 26.7 percent, whereas Hewlett-Packard’s
return was only 6.4 percent. Use the decomposed ROE framework to provide possi-
ble reasons for this difference based on the data below:
IBM HP
.....................................................................................................................................
NOPAT/Sales 9.0% 2.7%
Sales/Net Assets 2.16 2.73
Effective After Tax Interest Rate 2.4% 1.1%
Net Financial Leverage 0.42 0.16
......................................................................................................................................
5. Joe Investor asserts, “A company cannot grow faster than its sustainable growth
rate.” True or false? Explain why.
6. What are the reasons for a firm having lower cash from operations than working
capital from operations? What are the possible interpretations of these reasons?
7. ABC Company recognizes revenue at the point of shipment. Management decides to
increase sales for the current quarter by filling all customer orders. Explain what
impact this decision will have on
• Days’ receivable for the current quarter
• Days’ receivable for the next quarter
• Sales growth for the current quarter
• Sales growth for the next quarter
• Return on sales for the current quarter
• Return on sales for the next quarter
8. What ratios would you use to evaluate operating leverage for a firm?
9. What are the potential benchmarks that you could use to compare a company’s
financial ratios? What are the pros and cons of these alternatives?
10. In a period of rising prices, how would the following ratios be affected by the
accounting decision to select LIFO, rather than FIFO, for inventory valuation?
• Gross margin
• Current ratio
• Asset turnover
• Debt-to-equity ratio
• Average tax rate
NOTES
1. Both TJX and Nordstrom end their fiscal years on the last Saturday in January. TJX
calls the fiscal year ending January 30, 2011, fiscal year 2011, while Nordstrom calls
that same time period fiscal year 2010. For clarity, we will call the fiscal year ending
January 30, 2010, as fiscal year 2009, and the fiscal year ending January 29, 2011, as
fiscal year 2010.
2. TJX and Nordstrom financial statements used as the source for creating the stan-
dardized statements accessed via Thomson ONE.
3. Financial statement data for all publicly traded U.S. companies between 1991 and
2010, listed in Standard & Poor’s Compustat database, accessed October 2011.
Source: Thomson One
Financial Analysis 5-29
Copyright 2012 Cengage Learning. All Rights Reserved. May not be copied, scanned, or duplicated, in whole or in part. Due to electronic rights, some third party content may be suppressed from the eBook and/or eChapter(s).
Editorial review has deemed that any suppressed content does not materially affect the overall learning experience. Cengage Learning reserves the right to remove additional content at any time if subsequent rights restrictions require it.
4. In computing ROE, one can either use the beginning equity, ending equity, or an
average of the two. Conceptually, the average equity is appropriate, particularly for
rapidly growing companies. However, for most companies, this computational
choice makes little difference as long as the analyst is consistent. Therefore, in prac-
tice most analysts use ending balances for simplicity. This comment applies to all
ratios discussed in this chapter where one of the items in the ratio is a flow variable
(items in the income statement or cash flow statement) and the other item is a stock
variable (items in the balance sheet). Throughout this chapter we use the beginning
balances of the stock variables.
5. We discuss in greater detail in Chapter 8 how to estimate a company’s cost of equity
capital.
6. Strictly speaking, part of a cash balance is needed to run the firm’s operations, so
only the excess cash balance should be viewed as negative debt. However, firms do
not provide information on excess cash, so we subtract all cash balances in our defi-
nitions and computations. An alternative possibility is to subtract only short-term
investments and ignore the cash balance completely.
7. See D. Nissim and S. Penman, “Ratio Analysis and Valuation: From Research to
Practice,” Review of Accounting Studies 6 (2001): 109–154, for a more detailed
description of this approach.
8. Financial statement data for all publicly traded U.S. companies between 1991 and
2010, listed in Standard & Poor’s Compustat database, accessed October 2011.
9. Both TJX and Nordstrom have a solid credit rating and a relatively low cost of debt.
We will discuss in Chapter 8 how to estimate a company’s weighted average cost of
capital.
10. TJX Companies, Inc., January 29, 2011, Form 10-K (filed March 30, 2011), p. 25,
http://www.tjx.com/investor_landing.asp, accessed May 2011.
11. See Taxes and Business Strategy by M. Scholes and M. Wolfson (Englewood Cliffs,
NJ: Prentice-Hall, 1992).
12. If firms that are analyzed use different inventory methods, the analyst can adjust to
a common method for computing inventory turnover and days’ inventory. This can
be accomplished by adjusting LIFO inventory and LIFO cost of sales to FIFO values
using disclosures on the effect of LIFO inventory valuation in the inventory footnote
disclosure.
13. There are a number of issues related to the calculation of these ratios in practice.
First, in calculating all the turnover ratios, the assets used in the calculations can
either be beginning of the year values, year-end values, or an average of the begin-
ning and ending balances in a year. We use the beginning of the year values in our
calculations. Second, strictly speaking, one should use credit sales to calculate
accounts receivable turnover and days’ receivables. But since it is usually difficult to
obtain data on credit sales, total sales are used instead. Similarly, in calculating
accounts payable turnover or days’ payables, cost of goods sold is substituted for
purchases for data availability reasons.
14. Changes in cash and marketable securities are excluded because this is the amount
being explained by the cash flow statement. Changes in short-term debt and the cur-
rent portion of long-term debt are excluded because these accounts represent financ-
ing flows, not operating flows.
5-30
PART 2 • Business Analysis and Valuation Tools
Copyright 2012 Cengage Learning. All Rights Reserved. May not be copied, scanned, or duplicated, in whole or in part. Due to electronic rights, some third party content may be suppressed from the eBook and/or eChapter(s).
Editorial review has deemed that any suppressed content does not materially affect the overall learning experience. Cengage Learning reserves the right to remove additional content at any time if subsequent rights restrictions require it.

APPENDIX A THE TJX COMPANIES, INC. FINANCIAL STATEMENTS
We present here for refere nce Standardize d and Condensed financial statements for
TJX, on both an As Reported and As Adjusted (as detailed in the chapter) basis. It is
important to note that “As Reported” and “ As Adjusted” refers to the numbers
included in the statements—as noted previously, the Standardized and Condensed
financial statement formats have been developed as a way to facilitate comparison
and forecasting, and differ from the format presented by a specific company in its fil-
ings. Also note that the standardized statements shown below are generated by the
BAV software t ool and based on data reported by the Thomson ONE database, which
makes minor modifications to the data as reported by the firm. As a consequence, the
standardized statements shown below will not be an exact match to the standardized
statements shown in the appendix to Chapter 4, which were manually compiled to
illustrate the general methodology of creating standardized statements. F inally, As
Adjusted statements show differences from As Reported st atements only in the years
(FY 2010 for income and cash flow statements, FY 2011 and 2010 for beginning bal-
ance sheets) where adjustments have been made.
The TJX Companies, Inc.
Standardized Statements of Income ($ millions)
AS REPORTED
Fiscal Year 2010 2009 2008
.....................................................................................................................................................
Sales
21,942.2 20,288.4 18,999.5
Cost of Sales 15,5768 14,538.2 13,993.0
Gross Profit 6,365.4 5,750.2 5,006.5
SG&A
3,712.6 3,319.7 3,170.0
Other Operating Expense 458.1 435.2 371.2
Operating Income 2,194.7 1,995.3 1,465.3
Investment Income 0.0 0.0 0.0
Other Income, net of Other Expense 8.5 (1.7) 0.0
Other Income 15.3 7.5 0.0
Other Expense 6.8 9.2 0.0
Net Interest Expense (Income) 39.1 42.0 14.3
Interest Income 9.9 9.8 22.2
Interest Expense
49.0 51.8 36.5
Minority Interest 0.0 0.0 0.0
Pre-Tax Income 2,164.1 1,951.6 1,451.0
Tax Expense
824.6 738 536.1
Unusual Gains, Net of Unusual
Losses (after tax)
3.6 0.0 (34.3)
Net Income
1,343.1 1,213.6 880.6
Preferred Dividends 0.0 0.0 0.0
Net Income to Common 1,343.1 1,213.6 880.6
......................................................................................................................................................
Source: Thomson ONE database and Business Analysis and Valuation (BAV) Model V.5.
Financial Analysis 5-31
Copyright 2012 Cengage Learning. All Rights Reserved. May not be copied, scanned, or duplicated, in whole or in part. Due to electronic rights, some third party content may be suppressed from the eBook and/or eChapter(s).
Editorial review has deemed that any suppressed content does not materially affect the overall learning experience. Cengage Learning reserves the right to remove additional content at any time if subsequent rights restrictions require it.

The TJX Companies, Inc.
Standardized Beginning Balance Sheet ($ millions)
AS REPORTED
Fiscal Year 2011 2010 2009
.....................................................................................................................................................
Assets
Cash and Marketable Securities 1,821.5 1,745.2 453.5
Accounts Receivable 200.1 148.1 143.5
Inventory 2,765.5 2,532.3 2,619.3
Other Current Assets
312.4 378.2 409.8
Total Current Assets 5,099.5 4,803.8 3,626.1
Long-Term Tangible Assets 2,689.9 2,478.4 2,372.6
Long-Term Intangible Assets 182.3 181.7 179.5
Other Long-Term Assets
0.0 0.0 0.0
Total Long-Term Assets
2,872.2 2,660.1 2,552.1
Total Assets
7,971.8 7,464.0 6,178.2
Liabilities
Accounts Payable 1,683.9 1,507.9 1,276.1
Short-Term Debt 2.7 2.4 395.0
Other Current Liabilities 1,446.4 1,384.7 1,096.8
Total Current Liabilities 3,133.0 2,895.0 2,767.9
Long-Term Debt 787.5 790.2 383.8
Deferred Taxes 241.9 192.4 127.0
Other Long-Term Liabilities
(non-interest bearing)
709.3 697.1 765.0
Total Long-Term Liabilities
1,738.7 1,679.7 1,275.8
Total Liabilities
4,871.9 4,574.7 4,043.7
Minority Interest 0.0 0.0 0.0
Shareholders’ Equity
Preferred Stock 0.0 0.0 0.0
Common Shareholders’ Equity
3,099.9 2,889.3 2,134.6
Total Shareholders’ Equity 3,099.9 2,889.3 2,134.6
Total Liabilities and Share-
holders’ Equity
7,971.8 7,464.0 6,178.2
......................................................................................................................................................
Balance sheet items are shown as beginning of period balances.
Source: Thomson ONE database and Business Analysis and Valuation (BAV) Model V.5.
The TJX Companies, Inc.
Standardized Statements of Cash Flows ($ millions)
AS REPORTED
Fiscal Year 2010 2009 2008
.....................................................................................................................................................
Net Income 1,343.1 1,213.6 880.6
After-tax net interest expense (income) 24.2 26.1 9.0
Non-operating losses (gains) 158.4 (21.5) 55.2
Long-term operating accruals 587.8 456.6 489.3
Depreciation and amortization 458.1 435.2 401.7
Other
129.7 21.4 87.6
(continued)
5-32 PART 2 • Business Analysis and Valuation Tools
Copyright 2012 Cengage Learning. All Rights Reserved. May not be copied, scanned, or duplicated, in whole or in part. Due to electronic rights, some third party content may be suppressed from the eBook and/or eChapter(s).
Editorial review has deemed that any suppressed content does not materially affect the overall learning experience. Cengage Learning reserves the right to remove additional content at any time if subsequent rights restrictions require it.

Fiscal Year
2010 2009 2008
.....................................................................................................................................................
Operating cash flow before working
capital investments
2,113.5 1,674.8 1,434.1
Net (investments in) or liquidation
of operating working capital
(5.0) 548.6 (347.8)
Operating cash flow before
investment in long-term assets
2,108.5 2,223.4 1,086.3
Net (investment in) or liquidation
of operating long-term assets
(708.2) (434.9) (568.6)
Free cash flow available to debt
and equity
1,400.3 1,788.5 517.7
After-tax net interest income (expense) (24.2) (26.1) (9.0)
Net debt (repayment) or issuance
(2.4) 371.4 (2.0)
Free cash flow available to equity 1,373.7 2,133.8 506.7
Dividend (payments) (229.3) (197.7) (176.7)
Net stock issuance (repurchase), and
other equity changes
(1017.2) (774.9) (608.9)
Net increase (decrease) in cash balance 127.2 1,161.2 (278.9)
......................................................................................................................................................
Source: Thomson ONE database and Business Analysis and Valuation (BAV) Model V.5.
The TJX Companies, Inc.
Condensed Statements of Income ($ millions)
AS REPORTED
Fiscal Year 2010 2009 2008
.....................................................................................................................................................
Sales 21,942.2 20,288.4 18,999.5
Net Operating Profit after Tax 1,367.3 1,239.7 889.6
Net Income 1,343.1 1,213.6 880.6
þ Net Interest Expense after Tax
24.2 26.1 9.0
¼ Net Operating Profit after Tax 1,367.3 1,239.7 889.6
Net Interest Expense after Tax
24.2 26.1 9.0
Interest Expense 49.0 51.8 36.5
Interest Income 9.9 9.8 22.2
¼ Net Interest Expense (Income) 39.1 42.0 14.3
(1 − Tax Expense/Pre-Tax Income)
0.62 0.62 0.63
¼ Net Interest Expense after Tax 24.2 26.1 9.0
¼ Net Income 1,343.1 1,213.6 880.6
Preferred Stock Dividends
0.0 0.0 0.0
¼ Net Income to Common 1,343.1 1,213.6 880.6
......................................................................................................................................................
Source: Thomson ONE database and Business Analysis and Valuation (BAV) Model V.5.
The TJX Companies, Inc.
Condensed Beginning Balance Sheet ($ millions)
AS REPORTED
Fiscal Year 2011 2010 2009
.....................................................................................................................................................
Beginning Net Working Capital 147.7 166.0 799.7
Accounts Receivable 200.1 148.1 143.5
þ Inventory 2,765.5 2,532.3 2,619.3
(continued)
Financial Analysis 5-33
Copyright 2012 Cengage Learning. All Rights Reserved. May not be copied, scanned, or duplicated, in whole or in part. Due to electronic rights, some third party content may be suppressed from the eBook and/or eChapter(s).
Editorial review has deemed that any suppressed content does not materially affect the overall learning experience. Cengage Learning reserves the right to remove additional content at any time if subsequent rights restrictions require it.

Fiscal Year
2011 2010 2009
.....................................................................................................................................................
þ Other Current Assets 312.4 378.2 409.8
Accounts Payable 1,683.9 1,507.9 1,276.1
Other Current Liabilities
1,446.4 1,384.7 1,096.8
¼ Beginning Net Working Capital 147.7 166.0 799.7
þ Beginning Net Long-Term Assets
1,921.0 1,770.6 1,660.1
Long-Term Tangible Assets 2,689.9 2,478.4 2,372.6
þ Long-Term Intangible Assets 182.3 181.7 179.5
þ Other Long-Term Assets 0.0 0.0 0.0
Minority Interest 0.0 0.0 0.0
Deferred Taxes 241.9 192.4 127.0
Other Long-Term Liabilities
(non-interest bearing)
709.3 697.1 765.0
¼ Beginning Net Long-Term Assets 1,921.0 1,770.6 1,660.1
¼ Total Beginning Net Assets 2,068.7 1,936.6 2,459.8
Beginning Net Debt (1,031.3) (952.6) 325.3
Short-Term Debt 2.7 2.4 395.0
þ Long-Term Debt 787.5 790.2 383.8
Cash
1,821.5 1,745.2 453.5
¼ Beginning Net Debt (1,031.3) (952.6) 325.3
þ Beginning Preferred Stock 0.0 0.0 0.0
þ Beginning Shareholders’ Equity
3,099.9 2,889.3 2,134.6
¼ Total Net Capital 2,068.6 1,936.7 2,459.9
......................................................................................................................................................
Source: Thomson ONE database and Business Analysis and Valuation (BAV) Model V.5.
The TJX Companies, Inc.
Standardized Statements of Income ($ millions)
AS ADJUSTED
Fiscal Year 2010 2009 2008
.....................................................................................................................................................
Sales 21,942.2 20,288.4 18,999.5
Cost of Sales
14,930.8 14,538.2 13,993.0
Gross Profit 7,011.4 5,750.2 5,006.5
SG&A 3,712.6 3,319.7 3,170.0
Other Operating Expense
458.1 435.2 371.2
Operating Income 2,840.7 1,995.3 1,465.3
Investment Income 0.0 0.0 0.0
Other Income, net of Other Expense 8.5 (1.7) 0.0
Other Income 15.3 7.5 0.0
Other Expense 6.8 9.2 0.0
Net Interest Expense (Income) 283.9 42.0 14.3
Interest Income 9.9 9.8 22.2
Interest Expense 293.8 51.8 36.5
Minority Interest
0.0 0.0 0.0
Pre-Tax Income 2,565.3 1,951.6 1,451.0
Tax Expense 965.0 738 536.1
Unusual Gains, Net of Unusual
Losses (after tax)
0.0 0.0 (34.3)
Net Income 1,600.3 1,213.6 880.6
Preferred Dividends
0.0 0.0 0.0
Net Income to Common 1,600.3 1,213.6 880.6
......................................................................................................................................................
Source: Thomson ONE database and Business Analysis and Valuation (BAV) Model V.5.
5-34 PART 2 • Business Analysis and Valuation Tools
Copyright 2012 Cengage Learning. All Rights Reserved. May not be copied, scanned, or duplicated, in whole or in part. Due to electronic rights, some third party content may be suppressed from the eBook and/or eChapter(s).
Editorial review has deemed that any suppressed content does not materially affect the overall learning experience. Cengage Learning reserves the right to remove additional content at any time if subsequent rights restrictions require it.

The TJX Companies, Inc.
Standardized Beginning Balance Sheet ($ millions)
AS ADJUSTED
Fiscal Year 2011 2010 2009
....................................................................................................................................................
Assets
Cash and Marketable Securities 1,821.5 1,745.2 453.5
Accounts Receivable 200.1 148.1 143.5
Inventory 2,765.5 2,532.3 2,619.3
Other Current Assets
312.4 378.2 409.8
Total Current Assets 5,099.5 4,803.8 3,626.1
Long-Term Tangible Assets 8,663.7 6,928.6 2,372.6
Long-Term Intangible Assets 182.3 181.7 179.5
Other Long-Term Assets
0.0 0.0 0.0
Total Long-Term Assets
8,846.0 7,110.3 2,552.1
Total Assets
13,945.5 11,914.1 6,178.2
Liabilities
Accounts Payable 1,683.9 1,507.9 1,276.1
Short-Term Debt 2.7 2.4 395.0
Other Current Liabilities 1,450.0 1,384.7 1,096.8
Total Current Liabilities 3,136.6 2,895.0 2,767.9
Long-Term Debt 6,360.1 5,240.4 383.8
Deferred Taxes 382.3 192.4 127.0
Other Long-Term Liabilities (non-interest bearing)
709.3 697.1 765.0
Total Long-Term Liabilities
7,451.7 6,129.9 1,275.8
Total Liabilities
10,588.3 9,024.9 4,043.7
Minority Interest 0.0 0.0 0.0
Shareholders’ Equity
Preferred Stock 0.0 0.0 0.0
Common Shareholders’ Equity
3,357.1 2,889.3 2,134.6
Total Shareholders’ Equity 3,357.1 2,889.3 2,134.6
Total Liabilities and Shareholders’ Equity
13,945.5 11,914.1 6,178.2
......................................................................................................................................................
Balance sheet items are shown as beginning of period balances.
Source: Thomson ONE database and Business Analysis and Valuation (BAV) Model V.5.
The TJX Companies, Inc.
Standardized Statements of Cash Flows ($ millions)
AS ADJUSTED
Fiscal Year 2010 2009 2008
....................................................................................................................................................
Net Income 1,600.3 1,213.6 880.6
After-tax net interest expense (income) 176.0 26.1 9.0
Non-operating losses (gains) 162.0 (21.5) 55.2
Long-term operating accruals 1,087.6 456.6 489.3
Depreciation and amortization 817.5 435.2 401.7
Other
270.1 21.4 87.6
Operating cash flow before working capital
investments
3,025.9 1,674.8 1,434.1
(continued)
Financial Analysis 5-35
Copyright 2012 Cengage Learning. All Rights Reserved. May not be copied, scanned, or duplicated, in whole or in part. Due to electronic rights, some third party content may be suppressed from the eBook and/or eChapter(s).
Editorial review has deemed that any suppressed content does not materially affect the overall learning experience. Cengage Learning reserves the right to remove additional content at any time if subsequent rights restrictions require it.

Fiscal Year
2010 2009 2008
....................................................................................................................................................
Net (investments in) or liquidation
of operating working capital
(5.0) 548.6 (347.8)
Operating cash flow before investment
in long-term assets
3,020.9 2,223.4 1,086.3
Net (investment in) or liquidation of operating
long-term assets
(2,591.2) (434.9) (568.6)
Free cash flow available to debt and equity 429.7 1,788.5 517.7
After-tax net interest income (expense) (176.0) (26.1) (9.0)
Net debt (repayment) or issuance
1,120.0 371.4 (2.0)
Free cash flow available to equity 1,373.7 2,133.8 506.7
Dividend (payments) (229.3) (197.7) (176.7)
Net stock issuance (repurchase), and
other equity changes
(1,017.2) (774.9) (608.9)
Net increase (decrease) in cash balance 127.2 1,161.2 (278.9)
......................................................................................................................................................
Source: Thomson ONE database and analyst calculation.
The TJX Companies, Inc.
Condensed Statements of Income ($ millions)
AS ADJUSTED
Fiscal Year 2010 2009 2008
.....................................................................................................................................................
Sales 21,942.2 20,288.4 18,999.5
Net Operating Profit after Tax 1,777.4 1,239.7 889.6
Net Income 1,600.3 1,213.6 880.6
þ Net Interest Expense after Tax
177.1 26.1 9.0
¼ Net Operating Profit after Tax 1,777.4 1,239.7 889.6
Net Interest Expense after Tax
177.1 26.1 9.0
Interest Expense 293.8 51.8 36.5
Interest Income 9.9 9.8 22.2
¼ Net Interest Expense (Income) 283.9 42.0 14.3
(1 − Tax Expense/Pre-Tax Income)
0.62 0.62 0.63
¼ Net Interest Expense after Tax 177.1 26.1 9.0
¼ Net Income 1,600.3 1,213.6 880.6
Preferred Stock Dividends
0.0 0.0 0.0
¼ Net Income to Common 1,600.3 1,213.6 880.6
......................................................................................................................................................
Source: Thomson ONE database and Business Analysis and Valuation (BAV) Model V.5.
The TJX Companies, Inc.
Condensed Beginning Balance Sheet ($ millions)
AS ADJUSTED
Fiscal Year 2011 2010 2009
.....................................................................................................................................................
Beginning Net Working Capital 144.1 166.0 799.7
Accounts Receivable 200.1 148.1 143.5
þ Inventory 2,765.5 2,532.3 2,619.3
þ Other Current Assets 312.4 378.2 409.8
Accounts Payable 1,683.9 1,507.9 1,276.1
(continued)
5-36 PART 2 • Business Analysis and Valuation Tools
Copyright 2012 Cengage Learning. All Rights Reserved. May not be copied, scanned, or duplicated, in whole or in part. Due to electronic rights, some third party content may be suppressed from the eBook and/or eChapter(s).
Editorial review has deemed that any suppressed content does not materially affect the overall learning experience. Cengage Learning reserves the right to remove additional content at any time if subsequent rights restrictions require it.

Fiscal Year
2011 2010 2009
.....................................................................................................................................................
Other Current Liabilities
1,450.0 1,384.7 1,096.8
¼ Beginning Net Working Capital 144.1 166.0 799.7
þ Beginning Net Long-Term Assets
7,754.4 6,220.8 1,660.1
Long-Term Tangible Assets 8,663.7 6,928.6 2,372.6
þ Long-Term Intangible Assets 182.3 181.7 179.5
þ Other Long-Term Assets 0.0 0.0 0.0
Minority Interest 0.0 0.0 0.0
Deferred Taxes 382.3 192.4 127.0
Other Long-Term Liabilities
(non-interest bearing)
709.3 697.1 765.0
¼ Beginning Net Long-Term Assets 7,754.4 6,220.8 1,660.1
¼ Total Beginning Net Assets 7,898.5 6,386.9 2,459.8
Beginning Net Debt 4,541.3 3,497.6 325.3
Short-Term Debt 2.7 2.4 395.0
þ Long-Term Debt 6,360.1 5,240.4 383.8
Cash
1,821.5 1,745.2 453.5
¼ Beginning Net Debt 4,541.3 3,497.6 325.3
þ Beginning Preferred Stock 0.0 0.0 0.0
þ Beginning Shareholders’ Equity
3,357.1 2,889.3 2,134.6
¼ Total Net Capital 7,898.4 6,386.9 2,459.9
......................................................................................................................................................
Source: Thomson ONE database and Business Analysis and Valuation (BAV) Model V.5.
APPENDIX B NORDSTROM, INC. FINANCIAL STATEMENTS
We present here for reference Standardized and Condensed financial statements for
Nordstrom, on both an As Reported and As Adjusted (as detailed in the chapter) basis.
A reminder that “As Reported” and “As Adjusted” refers to the numbers presented in
the statements, not the format, which is used to facilitate comparison and forecasting,
and is not specifically representative of the format presented in company filings. Finally,
As Adjusted statements show differences from As Reported statements only in the years
(FY 2010 for income and cash flow statements, FY 2011 and 2010 for beginning balance
sheets) where adjustments have been made.
Nordstrom, Inc.
Standardized Statements of Income ($ millions)
AS REPORTED
Fiscal Year 2010 2009 2008
.....................................................................................................................................................
Sales 9,700.0 8,627.0 8,573.0
Cost of Sales
5,570.0 5,015.0 5,115.0
Gross Profit 4,130.0 3,612.0 3,458.0
SG&A 2,685.0 2,465.0 2,386.0
Other Operating Expense
327.0 313.0 302.0
Operating Income 1,118.0 834.0 770.0
Investment Income 0.0 0.0 0.0
Other Income, net of Other Expense 0.0 0.0 9.0
Other Income 0.0 0.0 9.0
(continued)
Financial Analysis 5-37
Copyright 2012 Cengage Learning. All Rights Reserved. May not be copied, scanned, or duplicated, in whole or in part. Due to electronic rights, some third party content may be suppressed from the eBook and/or eChapter(s).
Editorial review has deemed that any suppressed content does not materially affect the overall learning experience. Cengage Learning reserves the right to remove additional content at any time if subsequent rights restrictions require it.

Fiscal Year
2010 2009 2008
.....................................................................................................................................................
Other Expense 0.0 0.0 0.0
Net Interest Expense (Income) 127.0 138.0 131.0
Interest Income 6.0 10.0 14.0
Interest Expense 133.0 148.0 145.0
Minority Interest
0.0 0.0 0.0
Pre-Tax Income 991.0 696.0 648.0
Tax Expense 378.0 255.0 247.0
Unusual Gains, Net of Unusual Losses
(after tax)
0.0 0.0 0.0
Net Income 613.0 441.0 401.0
Preferred Dividends
0.0 0.0 0.0
Net Income to Common 613.0 441.0 401.0
......................................................................................................................................................
Source: Thomson ONE database and Business Analysis and Valuation (BAV) Model V.5.
Nordstrom, Inc.
Standardized Beginning Balance Sheet ($ millions)
AS REPORTED
Fiscal year 2011 2010 2009
.....................................................................................................................................................
Assets
Cash and Marketable Securities 1,506.0 795.0 72.0
Accounts Receivable 2,026.0 2,035.0 1,942.0
Inventory 977.0 898.0 900.0
Other Current Assets
315.0 326.0 303.0
Total Current Assets 4,824.0 4,054.0 3,217.0
Long-Term Tangible Assets 2,585.0 2,472.0 2,391.0
Long-Term Intangible Assets 53.0 53.0 53.0
Other Long-Term Assets
0.0 0.0 0.0
Total Long-Term Assets
2,638.0 2,525.0 2,444.0
Total Assets
7,462.0 6,579.0 5,661.0
Liabilities
Accounts Payable 846.0 726.0 563.0
Short-Term Debt 6.0 356.0 299.0
Other Current Liabilities
1,027.0 932.0 739.0
Total Current Liabilities 1,879.0 2,014.0 1,601.0
Long-Term Debt 2,775.0 2,257.0 2,214.0
Deferred Taxes 0.0 0.0 0.0
Other Long-Term Liabilities (non-interest bearing)
787.0 736.0 636.0
Total Long-Term Liabilities
3,562.0 2,993.0 2,850.0
Total Liabilities 5,441.0 5,007.0 4,451.0
Minority Interest 0.0 0.0 0.0
Shareholders’ Equity
Preferred Stock 0.0 0.0 0.0
Common Shareholders’ Equity
2,021.0 1,572.0 1,210.0
Total Shareholders’ Equity 2,021.0 1,572.0 1,210.0
Total Liabilities and Shareholders’ Equity
7,462.0 6,579.0 5,661.0
......................................................................................................................................................
Source: Thomson ONE database and Business Analysis and Valuation (BAV) Model V.5.
5-38 PART 2 • Business Analysis and Valuation Tools
Copyright 2012 Cengage Learning. All Rights Reserved. May not be copied, scanned, or duplicated, in whole or in part. Due to electronic rights, some third party content may be suppressed from the eBook and/or eChapter(s).
Editorial review has deemed that any suppressed content does not materially affect the overall learning experience. Cengage Learning reserves the right to remove additional content at any time if subsequent rights restrictions require it.

Nordstrom, Inc.
Standardized Statements of Cash Flows ($ millions)
AS REPORTED
Fiscal year 2010 2009 2008
.....................................................................................................................................................
Net Income 613.0 441.0 401.0
After-tax net interest expense (income) 78.6 87.4 81.1
Non-operating losses (gains) 0.0 0.0 0.0
Long-term operating accruals 465.0 495.0 445.0
Depreciation and amortization 327.0 313.0 302.0
Other
138.0 182.0 143.0
Operating cash flow before working capital
investments
1,156.6 1,023.4 927.1
Net (investments in) or liquidation of operating
working capital
99.0 315.0 2.0
Operating cash flow before investment
in long-term assets
1,255.6 1,338.4 929.1
Net (investment in) or liquidation of operating
long-term assets
(462.0) (541.0) (792.0)
Free cash flow available to debt and equity 793.6 797.4 137.1
After-tax net interest income (expense) (78.6) (87.4) (81.1)
Net debt (repayment) or issuance
179.0 108.0 35.0
Free cash flow available to equity 894.0 818.0 91.0
Dividend (payments) (167.0) (139.0) (138.0)
Net stock issuance (repurchase), and other
equity changes
(16.0) 44.0 (239.0)
Net increase (decrease) in cash balance 711.0 723.0 (286.0)
......................................................................................................................................................
Source: Thomson ONE database and Business Analysis and Valuation (BAV) Model V.5.
Nordstrom, Inc.
Condensed Statements of Income ($ millions)
AS REPORTED
Fiscal year 2010 2009 2008
.....................................................................................................................................................
Sales 9,700.0 8,627.0 8,573.0
Net Operating Profit after Tax 691.6 528.4 482.1
Net Income 613.0 441.0 401.0
þ Net Interest Expense after Tax
78.6 87.4 81.1
¼ Net Operating Profit after Tax 691.6 528.4 482.1
Net Interest Expense after Tax
78.6 87.4 81.1
Interest Expense 133.0 148.0 145.0
Interest Income 6.0 10 14.0
¼ Net Interest Expense (Income) 127.0 138.0 131.0
(1 − Tax Expense/Pre-Tax Income)
0.62 0.63 0.62
¼ Net Interest Expense after Tax 78.6 87.4 81.1
¼ Net Income 613.0 441.0 401.0
Preferred Stock Dividends
0.0 0.0 0.0
¼ Net Income to Common 613.0 441.0 401.0
......................................................................................................................................................
Source: Thomson ONE database and Business Analysis and Valuation (BAV) Model V.5.
Financial Analysis 5-39
Copyright 2012 Cengage Learning. All Rights Reserved. May not be copied, scanned, or duplicated, in whole or in part. Due to electronic rights, some third party content may be suppressed from the eBook and/or eChapter(s).
Editorial review has deemed that any suppressed content does not materially affect the overall learning experience. Cengage Learning reserves the right to remove additional content at any time if subsequent rights restrictions require it.

Nordstrom, Inc.
Condensed Beginning Balance Sheet ($ millions)
AS REPORTED
Fiscal year 2011 2010 2009
.....................................................................................................................................................
Beginning Net Working Capital 1,445.0 1,601.0 1,843.0
Accounts Receivable 2,026.0 2,035.0 1,942.0
þ Inventory 977.0 898.0 900.0
þ Other Current Assets 315.0 326.0 303.0
Accounts Payable 846.0 726.0 563.0
Other Current Liabilities
1,027.0 932.0 739.0
¼ Beginning Net Working Capital 1,445.0 1,601.0 1,843.0
þ Beginning Net Long-Term Assets
1,851.0 1,789.0 1,808.0
Long-Term Tangible Assets 2,585.0 2,472.0 2,391.0
þ Long-Term Intangible Assets 53.0 53.0 53.0
þ Other Long-Term Assets 0.0 0.0 0.0
Minority Interest 0.0 0.0 0.0
Deferred Taxes 0.0 0.0 0.0
Other Long-Term Liabilities
(non-interest bearing)
787.0 736.0 636.0
¼ Beginning Net Long-Term Assets 1,851.0 1,789.0 1,808.0
¼ Total Beginning Net Assets 3,296.0 3,390.0 3,651.0
Beginning Net Debt 1,275.0 1,818.0 2,441.0
Short-Term Debt 6.0 356.0 299.0
þ Long-Term Debt 2,775.0 2,257.0 2,214.0
Cash
1,506.0 795.0 72.0
¼ Beginning Net Debt 1,275.0 1,818.0 2,441.0
þ Beginning Preferred Stock 0.0 0.0 0.0
þ Beginning Shareholders’ Equity
2,021.0 1,572.0 1,210.0
¼ Total Net Capital 3,296.0 3,390.0 3,651.0
......................................................................................................................................................
Source: Thomson ONE database and Business Analysis and Valuation (BAV) Model V.5.
Nordstrom, Inc.
Standardized Statements of Income ($ millions)
AS ADJUSTED
Fiscal Year 2010 2009 2008
.....................................................................................................................................................
Sales 9,700.0 8,627.0 8,573.0
Cost of Sales
5,508.0 5,015.0 5,115.0
Gross Profit 4,191.2 3,612.0 3,458.0
SG&A 2,685.0 2,465.0 2,386.0
Other Operating Expense
327.0 313.0 302.0
Operating Income 1,179.2 834.0 770.0
Investment Income 0.0 0.0 0.0
Other Income, net of Other Expense 0.0 0.0 9.0
Other Income 0.0 0.0 9.0
Other Expense 0.0 0.0 0.0
Net Interest Expense (Income) 163.4 138.0 131.0
Interest Income 6.0 10.0 14.0
Interest Expense 169.4 148.0 145.0
(continued)
5-40 PART 2 • Business Analysis and Valuation Tools
Copyright 2012 Cengage Learning. All Rights Reserved. May not be copied, scanned, or duplicated, in whole or in part. Due to electronic rights, some third party content may be suppressed from the eBook and/or eChapter(s).
Editorial review has deemed that any suppressed content does not materially affect the overall learning experience. Cengage Learning reserves the right to remove additional content at any time if subsequent rights restrictions require it.

Fiscal Year
2010 2009 2008
.....................................................................................................................................................
Minority Interest
0.0 0.0 0.0
Pre-Tax Income 1,015.8 696.0 648.0
Tax Expense 386.7 255.0 247.0
Unusual Gains, Net of Unusual Losses (after tax)
0.0 0.0 0.0
Net Income 629.1 441.0 401.0
Preferred Dividends
0.0 0.0 0.0
Net Income to Common 629.1 441.0 401.0
......................................................................................................................................................
Source: Thomson ONE database and Business Analysis and Valuation (BAV) Model V.5.
Nordstrom, Inc.
Standardized Beginning Balance Sheet ($ millions)
AS ADJUSTED
Fiscal year 2011 2010 2009
.....................................................................................................................................................
Assets
Cash and Marketable Securities 1,506.0 795.0 72.0
Accounts Receivable 2,026.0 2,035.0 1,942.0
Inventory 977.0 898.0 900.0
Other Current Assets
315.0 326.0 303.0
Total Current Assets 4,824.0 4,054.0 3,217.0
Long-Term Tangible Assets 3,294.8 3,050.0 2,391.0
Long-Term Intangible Assets 53.0 53.0 53.0
Other Long-Term Assets
0.0 0.0 0.0
Total Long-Term Assets
3,347.8 3,103.0 2,444.0
Total Assets
8,171.8 7,157.0 5,661.0
Liabilities
Accounts Payable 846.0 726.0 563.0
Short-Term Debt 6.0 356.0 299.0
Other Current Liabilities
1,027.0 932.0 739.0
Total Current Liabilities 1,879.0 2,014.0 1,601.0
Long-Term Debt 3,460.0 2,835.0 2,214.0
Deferred Taxes 8.7 0.0 0.0
Other Long-Term Liabilities (non-interest bearing)
787.0 736.0 636.0
Total Long-Term Liabilities
4,255.7 3,571.0 2,850.0
Total Liabilities 6,134.7 5,585.0 4,451.0
Minority Interest 0.0 0.0 0.0
Shareholders’ Equity
Preferred Stock 0.0 0.0 0.0
Common Shareholders’ Equity
2,037.1 1,572.0 1,210.0
Total Shareholders’ Equity 2,037.1 1,572.0 1,210.0
Total Liabilities and Shareholders’ Equity
8,171.8 7,157.0 5,661.0
......................................................................................................................................................
Source: Thomson ONE database and Business Analysis and Valuation (BAV) Model V.5.
Financial Analysis 5-41
Copyright 2012 Cengage Learning. All Rights Reserved. May not be copied, scanned, or duplicated, in whole or in part. Due to electronic rights, some third party content may be suppressed from the eBook and/or eChapter(s).
Editorial review has deemed that any suppressed content does not materially affect the overall learning experience. Cengage Learning reserves the right to remove additional content at any time if subsequent rights restrictions require it.

Nordstrom, Inc.
Standardized Statements of Cash Flows ($ millions)
AS ADJUSTED
Fiscal year 2010 2009 2008
..................................................................................................................................................
Net Income 629.1 441.0 401.0
After-tax net interest expense (income) 101.2 87.4 81.1
Non-operating losses (gains) 0.0 0.0 0.0
Long-term operating accruals 510.5 495.0 445.0
Depreciation and amortization 363.8 313.0 302.0
Other
146.7 182.0 143.0
Operating cash flow before working capital
investments
1,240.8 1,023.4 927.1
Net (investments in) or liquidation of operating
working capital
99.0 315.0 2.0
Operating cash flow before investment
in long-term assets
1,339.8 1,338.4 929.1
Net (investment in) or liquidation of
operating long-term assets
(630.6) (541.0) (792.0)
Free cash flow available to debt and equity 709.2 797.4 137.1
After-tax net interest income (expense) (101.2) (87.4) (81.1)
Net debt (repayment) or issuance
286.0 108.0 35.0
Free cash flow available to equity 894.0 818.0 91.0
Dividend (payments) (167.0) (139.0) (138.0)
Net stock issuance (repurchase), and other
equity changes
(16.0) 44.0 (239.0)
Net increase (decrease) in cash balance 711.0 723.0 (286.0)
...................................................................................................................................................
Source: Thomson ONE database and analyst calculation.
Nordstrom, Inc.
Condensed Statements of Income ($ millions)
AS ADJUSTED
Fiscal year 2010 2009 2008
.....................................................................................................................................................
Sales 9,700.0 8,627.0 8,573.0
Net Operating Profit after Tax 730.3 528.4 482.1
Net Income 629.1 441.0 401.0
þ Net Interest Expense after Tax
101.2 87.4 81.1
¼ Net Operating Profit after Tax 730.3 528.4 482.1
Net Interest Expense after Tax
101.2 87.4 81.1
Interest Expense 169.4 148.0 145.0
Interest Income 6.0 10 14.0
¼ Net Interest Expense (Income) 163.4 138.0 131.0
(1 Tax Expense/Pre-Tax Income)
0.62 0.63 0.62
¼ Net Interest Expense after Tax 101.2 87.4 81.1
¼ Net Income 629.1 441.0 401.0
Preferred Stock Dividends
0.0 0.0 0.0
¼ Net Income to Common 629.1 441.0 401.0
......................................................................................................................................................
Source: Thomson ONE database and Business Analysis and Valuation (BAV) Model V.5.
5-42 PART 2 • Business Analysis and Valuation Tools
Copyright 2012 Cengage Learning. All Rights Reserved. May not be copied, scanned, or duplicated, in whole or in part. Due to electronic rights, some third party content may be suppressed from the eBook and/or eChapter(s).
Editorial review has deemed that any suppressed content does not materially affect the overall learning experience. Cengage Learning reserves the right to remove additional content at any time if subsequent rights restrictions require it.

Nordstrom, Inc.
Condensed Beginning Balance Sheet ($ millions)
AS ADJUSTED
Fiscal year 2011 2010 2009
.....................................................................................................................................................
Beginning Net Working Capital 1,445.0 1,601.0 1,843.0
Accounts Receivable 2,026.0 2,035.0 1,942.0
þ Inventory 977.0 898.0 900.0
þ Other Current Assets 315.0 326.0 303.0
Accounts Payable 846.0 726.0 563.0
Other Current Liabilities
1,027.0 932.0 739.0
¼ Beginning Net Working Capital 1,445.0 1,601.0 1,843.0
þ Beginning Net Long-Term Assets
2,552.1 2,367.0 1,808.0
Long-Term Tangible Assets 3,294.8 3,050.0 2,391.0
þ Long-Term Intangible Assets 53.0 53.0 53.0
þ Other Long-Term Assets 0.0 0.0 0.0
Minority Interest 0.0 0.0 0.0
Deferred Taxes 8.7 0.0 0.0
Other Long-Term Liabilities
(non–interest bearing)
787.0 736.0 636.0
¼ Beginning Net Long-Term Assets 2,552.1 2,367.0 1,808.0
¼ Total Beginning Net Assets 3,997.1 3,968.0 3,651.0
Beginning Net Debt 1,960.0 2,396.0 2,441.0
Short-Term Debt 6.0 356.0 299.0
þ Long-Term Debt 3,460.0 2,835.0 2,214.0
Cash
1,506.0 795.0 72.0
¼ Beginning Net Debt 1,960.0 2,396.0 2,441.0
þ Beginning Preferred Stock 0.0 0.0 0.0
þ Beginning Shareholders’ Equity 2,037.1 1,572.0 1,210.0
¼ Total Net Capital 3,997.1 3,968.0 3,651.0
......................................................................................................................................................
Source: Thomson ONE database and Business Analysis and Valuation (BAV) Model V.5.
Financial Analysis 5-43
Copyright 2012 Cengage Learning. All Rights Reserved. May not be copied, scanned, or duplicated, in whole or in part. Due to electronic rights, some third party content may be suppressed from the eBook and/or eChapter(s).
Editorial review has deemed that any suppressed content does not materially affect the overall learning experience. Cengage Learning reserves the right to remove additional content at any time if subsequent rights restrictions require it.

Chapter
6
PROSPECTIVE ANALYSIS:
FORECASTING
M
ost financial statement analysis tasks are undertaken with a forward-looking
decision in mind—and much of the time it is useful to summarize the view
developed in the analysis with an explicit forecast. Managers need forecasts to
formulate business plans and provide performance targets; analysts need forecasts to help
communicate their views of the firm’s prospects to investors; and bankers and debt
market participants need forecasts to assess the likelihood of loan repayment.
Moreover, there are a variety of contexts (including but not limited to security analysis)
where the forecast is usefully summarized in the form of an estimate of the firm’s value.
This estimate can be viewed as an attempt to best reflect in a single summary statistic the
manager’s or analyst’s view of the firm’s prospects.
Prospective analysis includes two tasks—forecasting and valuation—that together
represent approaches to explicitly summarizing the analyst’s forward-looking views. In
this chapter we focus on forecasting; valuation is the topic of the next two chapters.
Forecasting is not so much a separate analysis as it is a way of summarizing what has
been learned through business strategy analysis, accounting analysis, and financial
analysis. However, there are certain techniques and knowledge that can help a manager
or analyst to structure the best possible forecast based on what has been learned in the
previous steps. Below we summarize an approach to structuring the forecast, offer
information useful in getting started, explore the relationship between the other
analytical steps and forecasting, and give detailed steps to forecast earnings, balance
sheet data, and cash flows. The key concepts discussed in this chapter are illustrated
using a forecast for TJX, the off-price retailer examined in Chapter 5.
THE OVERA LL STRUCTURE OF TH E FORECAST
The best way to forecast future performance is to do it comprehensively—producing not
only an earnings forecast, but also a forecast of cash flows and the balance sheet. A com-
prehensive approach is useful, even in cases where one might be interested primarily in a
single facet of performance, because it guards against unrealistic implicit assumptions.
For example, if an analyst forecasts growth in sales and earnings for several years with-
out explicitly considering the required increases in working capital and plant assets and
the associated financing, the forecast might possibly imbed unreasonable assumptions
about asset turnover, leverage, or equity capital infusions.
6-1
Copyright 2012 Cengage Learning. All Rights Reserved. May not be copied, scanned, or duplicated, in whole or in part. Due to electronic rights, some third party content may be suppressed from the eBook and/or eChapter(s).
Editorial review has deemed that any suppressed content does not materially affect the overall learning experience. Cengage Learning reserves the right to remove additional content at any time if subsequent rights restrictions require it.
A comprehensive approach involves many forecasts, but in most cases they are all
linked to the behavior of a few key “drivers.” The drivers vary according to the type of
business, but for businesses outside the financial services sector, the sales forecast is nearly
always one of the key drivers; profit margin is another. When asset turnover is expected to
remain stable—often a realistic assumption—working capital accounts and investment in
plants should track the growth in sales closely. Most major expenses also track sales, sub-
ject to expected shifts in profit margins. By linking forecasts of such amounts to the sales
forecast, one can avoid internal inconsistencies and unrealistic implicit assumptions.
In some contexts the manager or analyst is interested ultimately in a forecast of cash
flows, not earnings per se. Nevertheless, in practice even forecasts of cash flows tend to
be grounded on forecasts of accounting numbers, including sales, earnings, assets, and lia-
bilities. Of course it would be possible in principle to move directly to forecasts of cash
flows—inflows from customers, outflows to suppliers and laborers, and so forth—and in
some businesses this is a convenient way to proceed. In most cases, however, the growth
prospects, profitability, and investment and financing needs of the firm are more readily
framed in terms of accrual-based sales, operating earnings, assets, and liabilities. These
amounts can then be converted to cash flow measures by adjusting for the effects of non-
cash expenses and expenditures for working capital and plant, property, and equipment.
A Practical Framework for Forecasting
The most practical approach to forecasting a company’s financial statements is to focus on
projecting “condensed” financial statements, as used in the ratio analysis in Chapter 5,
rather than attempting to project detailed financial statements at the level that the com-
pany reports. There are several reasons for this recommendation. Forecasting condensed
financial statements involves a relatively small set of assumptions about the future of the
firm, so the analyst will have more ability to think about each of the assumptions carefully.
A detailed line-item forecast is likely to be very tedious, and an analyst may not have a
good basis to make all the assumptions necessary for such forecasts. Further, for most pur-
poses, condensed financial statements are all that are needed for analysis and decision
making. We therefore approach the task of financial forecasting with this framework.
Recall that the condensed income statement that we used in Chapter 5 consists of the
following elements: sales, net operating profits after tax (NOPAT), net interest expense
after tax, taxes, and net income. The condensed balance sheet consists of net operating
working capital, net long-term assets, net debt, and equity. Also recall that we start with
a balance sheet at the beginning of the forecasting period. Assumptions about how we
use the beginning balance sheet and run the firm’s operations will lead to the income
statement for the forecasting period; assumptions about investment in working capital
and long-term assets, and how we finance these assets, results in a balance sheet at the
end of the forecasting period.
To forecast the condensed income statement, one needs to begin with an assumption
about next period’s sales. Beyond that, assumptions about NOPAT margin, interest rate
on beginning debt, and tax rate are all that are needed to prepare the condensed income
statement for the period.
To forecast the condensed balance sheet for the end of the period (or the equivalent,
the beginning of the next period), we need to make the following additional assumptions:
(1) the ratio of net operating working capital to sales, to estimate the level of working
capital needed to support those sales; (2) the ratio of net operating long-term assets to
the following year’s sales, to calculate the expected level of net operating long-term
assets; and (3) the ratio of net debt to capital to estimate the levels of debt and equity
needed to finance the estimated amount of assets on the balance sheet.
6-2
PART 2 • Business Analysis and Valuation Tools
Copyright 2012 Cengage Learning. All Rights Reserved. May not be copied, scanned, or duplicated, in whole or in part. Due to electronic rights, some third party content may be suppressed from the eBook and/or eChapter(s).
Editorial review has deemed that any suppressed content does not materially affect the overall learning experience. Cengage Learning reserves the right to remove additional content at any time if subsequent rights restrictions require it.
Once we have the condensed income statement and balance sheet, it is relatively
straightforward to compute the condensed cash flow statement, including cash flow
from operations before working capital investments, cash flow from operations after
working capital investments, free cash flow available to debt and equity, and free cash
flow available to equity.
We discuss how best to make the necessary assumptions to forecast the condensed
income statement, balance sheet, and cash flow statements below.
PERFORMANCE BEHAVIOR: A STARTING POINT
Every forecast has, at least implicitly, an initial benchmark—some notion of how a
particular amount, such as sales or earnings, would be expected to behave in the absence
of detailed information. For example, in beginning to contemplate fiscal 2011 profitabil-
ity for TJX, 2010 performance might be a starting point. Another potential place to begin
might be 2010 performance adjusted for recent trends. A third possibility that might
seem reasonable—but one that generally turns out not to be very useful—is the average
performance over several prior years.
By the time one has completed a business strategy analysis, an accounting analysis,
and a detailed financial analysis, the resulting forecast might differ significantly from
the original point of departure. Nevertheless, for purposes of having a starting point
that can help anchor the detailed analysis, it is also useful to know how certain financial
statistics behave “on average” for all firms.
In the case of some key statistics, such as earnings, a point of departure based only on
prior behavior of the number is more powerful than one might expect. Research demon-
strates that some such benchmarks for earnings are almost as accurate as the forecasts of
professional security analysts, who have access to a rich information set (we return to
this point in more detail later). Thus, the benchmark is often not only a good starting
point but also close to the amount forecast after detailed analysis. Large departures
from the benchmark could be justified only in cases where the firm’s situation is demon-
strably unusual.
Reasonable points of departure for forecasts of key accounting numbers can be based
on the evidence summarized next. Such evidence may also be useful for checking the
reasonableness of a completed forecast.
Sales Gr owth Behavior
Sales growth rates tend to be “mean-reverting”: firms with above-average or below-
average rates of sales growth tend to revert over time to a “normal” level (historically in
the range of 7 to 9 percent for U.S. firms) within three to ten years. Figure 6-1 docu-
ments this mean-reverting effect for the period 1993 through 2010 for all the publicly
traded U.S. firms covered by the Compustat database. All firms are ranked in terms of
their sales growth in 1993 (year 1) and formed into five portfolios based on the relative
ranking of their sales growth in that year. Firms in portfolio 1 are in the top 20 percent
of rankings in terms of their sales growth in 1993, those in portfolio 2 fall into the next
20 percent, while those in portfolio 5 are in the bottom 20 percent when ranked by sales
growth. The sales growth rates of firms in each of these five portfolios are traced from
1993 through the subsequent nine years (years 2 to 10). The same experiment is repeated
with 1997 and then 2001 as the base year (year 1). The results are averaged over the
three experiments, and the resulting sales growth rates of each of the five portfolios for
years 1 through 10 are plotted in Figure 6-1.
The figure shows that the group of firms with the highest growth initially—sales
growth rates of a little over 70 percent—experience a decline to about an 8 percent
Prospective Analysis: Forecasting 6-3
Copyright 2012 Cengage Learning. All Rights Reserved. May not be copied, scanned, or duplicated, in whole or in part. Due to electronic rights, some third party content may be suppressed from the eBook and/or eChapter(s).
Editorial review has deemed that any suppressed content does not materially affect the overall learning experience. Cengage Learning reserves the right to remove additional content at any time if subsequent rights restrictions require it.
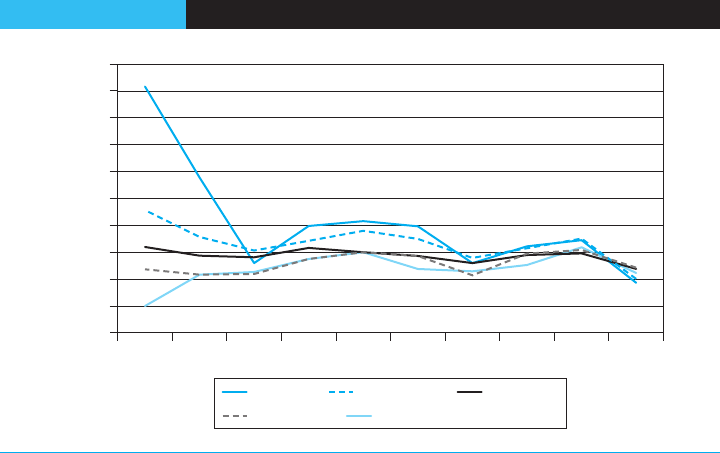
growth rate within three years and are never much above 20 percent in the next seven
years. Those with the lowest initial sales growth rates, negative 10 percent, improve
immediately to a marginally positive sales growth in year 2 and show positive growth
through year 10. One explanation for the pattern of sales growth seen in Figure 6-1 is
that as industries and companies mature, their growth rate slows down due to demand
saturation and intra-industry competition. Therefore, even when a firm is growing rap-
idly at present, it is generally unrealistic to assume that the current high growth will per-
sist indefinitely. Of course, how quickly a firm’s growth rate reverts to the average
depends on the characteristics of its industry and its own competitive position within
an industry.
Earnings Behavior
Earnings have been shown on average to follow a process that can be approximated by
a “random walk” or “random walk with drift.” This implies that the prior year’searn-
ings is a good starting point in considering future earnings potential. Even a simple
random walk forecast—one that predicts next year’s earnings will be equal to last
year’s earnings—is surprisingly useful. One st udy documents that professional analysts’
year-ahead forecasts are only 22 percent more accurate, on average, than a simple ran-
dom walk forecast.
1
Thus a final earnings forecast will usually not differ dramatically
from a random walk benchmark. In addition, it is reasonable to adjust this simple
benchmark for t he earnings changes of the most recent quarter, i.e., changes relative
to the comparable quarter of the prior year after controlling for the long-run trend in
the series.
Although the average level of earnings over several prior years is not useful, long-term
trends in earnings tend to be sustained on average, and so they are also worthy of
consideration. If quarterly data are also included, then some consideration should usually
be given to any departures from the long-run trend that occurred in the most recent
quarter. For most firms, these most recent changes tend to be partially repeated in sub-
sequent quarters.
2
FIGURE 6-1 Behavior of Sales Growth for U.S. Firms, 1993–2010
Top Fifth Second Fifth Third Fifth
Fourth Fifth Bottom Fifth
−20.0%
12345678910
−10.0%
0.0%
10.0%
20.0%
30.0%
40.0%
50.0%
60.0%
70.0%
80.0%
Source: © Cengage Learning 2013
6-4 PART 2 • Business Analysis and Valuation Tools
Copyright 2012 Cengage Learning. All Rights Reserved. May not be copied, scanned, or duplicated, in whole or in part. Due to electronic rights, some third party content may be suppressed from the eBook and/or eChapter(s).
Editorial review has deemed that any suppressed content does not materially affect the overall learning experience. Cengage Learning reserves the right to remove additional content at any time if subsequent rights restrictions require it.
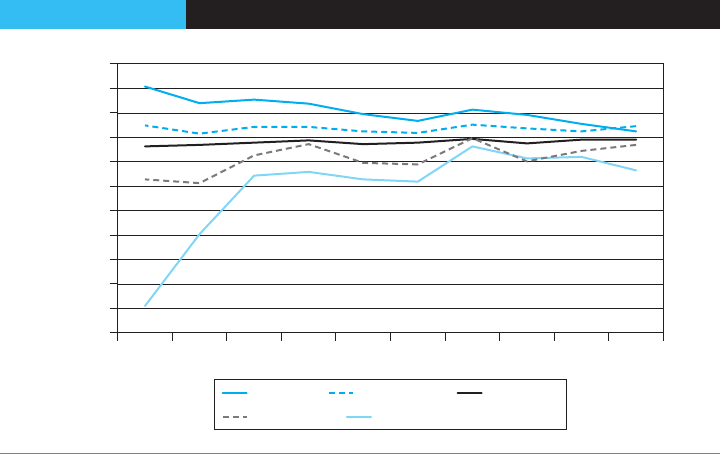
Return on Equity Behavior
Given that prior earnings serve as a useful benchmark for future earnings, one might
expect the same to be true of measures of return on investment such as ROE. That, how-
ever, is not the case for two reasons. First, even though the average firm tends to sustain
the current earnings level, this is not true of firms with unusual levels of ROE. Firms
with abnormally high (low) ROE tend to experience earnings declines (increases).
3
Second, firms with higher ROEs tend to expand their investment bases more quickly
than others, which causes the denominator of the ROE to increase. Of course, if firms
could earn returns on the new investments that match the returns on the old ones,
then the level of ROE would be maintained. However, firms have difficulty continuing
to generate those impressive ROEs. Firms with higher ROEs tend to find that, as time
goes by, their earnings growth does not keep pace with growth in their investment
base, and ROE ultimately falls.
The resulting behavior of ROE and other measures of return on investment is charac-
terized as mean-reverting, a pattern similar to that observed for sales growth rates earlier.
Firms with above-average or below-average rates of return tend to revert over time to a
“normal” level (historically in the range of 10 to 15 percent for U.S. firms) within no
more than ten years.
4
Figure 6-2 documents this mean-reverting effect for U.S. firms
from 1993 through 2010. All firms are ranked in terms of their ROE in 1993 (year 1)
and formed into five portfolios in a similar fashion to the sales growth analysis above.
Firms in portfolio 1 have the top 20 percent ROE rankings in 1993, those in portfolio 2
fall into the next 20 percent, and those in portfolio 5 have the bottom 20 percent. The
average ROE of firms in each of these five portfolios is then traced through nine subse-
quent years (years 2 to 10). The same experiment is repeated with 1997 and 2001 as the
base year (year 1). Figure 6-2 plots the average ROE of each of the five portfolios in years
1 to 10 averaged across these three experiments.
Though the five portfolios start out in year 1 with a wide range of ROEs (60 percent to
þ30 percent), by year 10 the pattern of mean-reversion is clear. The most profitable group of
firms initially—with average ROEs of 30 percent—experience a decline to below 20 percent
FIGURE 6- 2 Behavior of ROE for U.S. Firms, 1993–2010
12345678910
−70.0%
−60.0%
−50.0%
−40.0%
−30.0%
−20.0%
−10.0%
0.0%
10.0%
20.0%
30.0%
40.0%
Top Fifth Second Fifth Third Fifth
Fourth Fifth Bottom Fifth
Source: © Cengage Learning 2013
Prospective Analysis: Forecasting 6-5
Copyright 2012 Cengage Learning. All Rights Reserved. May not be copied, scanned, or duplicated, in whole or in part. Due to electronic rights, some third party content may be suppressed from the eBook and/or eChapter(s).
Editorial review has deemed that any suppressed content does not materially affect the overall learning experience. Cengage Learning reserves the right to remove additional content at any time if subsequent rights restrictions require it.
within five years. By year 10 this group of firms has an ROE of 12 percent. Those with the
lowest initial ROEs (60 percent) experience a dramatic increase in ROE in the first three
years and are marginally profitable or at least close to breakeven by the final four years.
The pattern in Figure 6-2 is not a coincidence—it is exactly what the economics of
competition would predict. The tendency of high ROEs to fall is a reflection of high
profitability attracting competition; the tendency of low ROEs to rise reflects the mobility
of capital away from unproductive ventures toward more profitable ones.
5
Despite the
general tendencies documented in Figure 6-2, there are some firms whose ROEs may
remain above or below normal levels for long periods of time. In some cases the phe-
nomenon reflects the strength of a sustainable competitive advantage, but in other cases
it is purely an artifact of conservative accounting methods. A good example of the latter
phenomenon in the United States is pharmaceutical firms, whose major economic asset,
the intangible value of research and development, is not recorded on the balance sheet
and is therefore excluded from the denominator of ROE. For these firms, one could rea-
sonably expect high ROEs—in excess of 20 percent—over the long run, even in the face
of strong competitive forces.
The Behavior of Components of ROE
The behavior of rates of return on equity can be analyzed further by looking at the
behavior of its key components. Recall from Chapter 5 that ROEs and profit margins
are linked as follows:
ROE ¼ Operating ROE þðOperating ROA Net interest rate after taxÞ
Net financial leverage
¼ NOPAT margin Opearting asset turnover þ Spread
Net financial leverage
The time-series behaviors of the primary components of ROE for U.S. companies for
1993 through 2010 are shown in a series of figures in the appendix to this chapter. Some
major conclusions can be drawn from these figures:
(1) Operating asset turnover tends to be rather stable, in part because it is largely a
function of the technology of the industry. The only exception to this is the set
of firms with very high asset turnover, which tends to decline somewhat over
time before stabilizing;
(2) Net financial leverage also tends to be stable, simply because management policies
on capital structure are not often changed; and
(3) NOPAT margin stands out as the most variable component of ROE. If the forces
of competition drive abnormal ROEs toward more normal levels, the change is
most likely to arrive in the form of changes in profit margins. The change in
NOPAT margin will drive changes in the spread, since the cost of borrowing is
likely to remain stable because leverage tends to be stable.
To summarize, profit margins and ROEs tend to be driven by competition to
normal levels over time. What constitutes normal varies widely according to the technol-
ogy employed within an industry and the corporate strategy pursued by the firm, both
of which influence turnover and leverage.
6
In a fully competitive equilibrium, profit mar-
gins should remain high for firms that must operate with a low turnover, and vice versa.
The above discussion of rates of return and margins implies that a reasonable starting
point for forecasting such statistics should consider more than just the most recent
observation. One should also consider whether that rate or margin is above or below a
normal level. If so, then absent detailed information to the contrary, one would expect
6-6
PART 2 • Business Analysis and Valuation Tools
Copyright 2012 Cengage Learning. All Rights Reserved. May not be copied, scanned, or duplicated, in whole or in part. Due to electronic rights, some third party content may be suppressed from the eBook and/or eChapter(s).
Editorial review has deemed that any suppressed content does not materially affect the overall learning experience. Cengage Learning reserves the right to remove additional content at any time if subsequent rights restrictions require it.
some movement over time toward that norm. Of course this central tendency might be
overcome in some cases—for example, where the firm has erected barriers to competi-
tion that can protect margins, even for extended periods. The lesson from the evidence,
however, is that such cases are unusual.
In contrast to rates of return and margins, it is reasonable to assume that asset turn-
over, financial leverage, and net interest rate remain relatively constant over time. Unless
there is an explicit change in technology or financial policy being contemplated for
future periods, a reasonable starting point for assumptions for these variables is the cur-
rent period level. The only exceptions to this appear to be firms with either very high
asset turns that experience some decline in this ratio before stabilizing, or those firms
with very low (usually negative) net debt to capital that appear to increase leverage
before stabilizing. In addition, firms with very high levels of leverage tend to survive at
a lower rate than more conservatively financed firms, driving down averages over time.
As we proceed with the steps involved in producing a detailed forecast, the reader will
note that we draw on knowledge of the behavior of accounting numbers to some extent.
However, it is important to keep in mind that a knowledge of average behavior will not
fit all firms well. The art of financial statements analysis requires not only knowing what
the “normal” patterns are but also having expertise in identifying those firms that will
not follow the norm.
OTHER FORECASTING CONSIDERATIONS
In general, the mean-reverting behavior of sales growth and return on equity that is dem-
onstrated by the broader market should hold for individual companies over time. The
starting point for any forecast should therefore be the time-series behavior of the various
measures of firm performance, as discussed. However, there are several other factors that
the analyst should consider in making forecasts. These include an understanding of impli-
cations of the three levels of analysis that precede prospective analysis—strategy, account-
ing, and financial performance—and of macroeconomic considerations.
7
Strategy, Accounting, and Financial An alysis and Forecasting
The analysis of a firm’s strategy, accounting, and financial performance discussed
throughout this book can generate important questions and insights about a firm’s future
performance. A projection of the future performance of any company must therefore be
grounded in an understanding of the questions raised by these analyses, such as:
• From business strategy analysis: What are the characteristics of the industry in
which a firm operates? Are there significant barriers to entry that are likely to
deter future competition? If so, how long are they expected to last? What are the
industry’s growth prospects? How are they likely to affect future competition? And,
does the company in question have a clear strategy that positions it for future suc-
cess? For example, following up on the discussion of TJX’s business strategy in
Chapter 2, the analyst might ask whether TJX has succeeded in creating a retailing
infrastructure that will allow it to continue to succeed in the U.S. market? Will it
be able to replicate this market success internationally? At what rate will TJX be
able to grow its sales, both in the short term and the long term, without sacrificing
its margins? Will competitors be able to replicate TJX’s efficiency while competing
with a differentiated product offering?
• From accounting analysis: The accounting analysis discussed in Chapters 3 and 4
provide the analyst with an understanding of how a company’s accounting affects
its reported financial performance. Are assets overstated, requiring a future
Prospective Analysis: Forecasting 6-7
Copyright 2012 Cengage Learning. All Rights Reserved. May not be copied, scanned, or duplicated, in whole or in part. Due to electronic rights, some third party content may be suppressed from the eBook and/or eChapter(s).
Editorial review has deemed that any suppressed content does not materially affect the overall learning experience. Cengage Learning reserves the right to remove additional content at any time if subsequent rights restrictions require it.
write-down? Does the firm have off–balance sheet assets, such as R&D, that over-
state reported rates of return? If so, what are the implications for future accounting
statements? For TJX, we pointed out that the firm’s accounting resulted in the
value and associated liabilities of operating leases being excluded from the firm’s
assets and liabilities.
• From financial analysis: What are the sources of a firm’s poor or strong recent
performance? Is this performance sustainable? Are there any discernible patterns
in the firm’s past performance? If so, are there any reasons why this trend is likely
to continue or to change?
These insights assist the analyst in answering questions of whether and for how long the
firm will be able to maintain any competitive advantage and current performance levels,
which are critical to forecasting. The answers to these questions determine the speed with
which the firm’s performance follows the general mean-reverting trends discussed above.
Macroeconomic Factors and Forecasting
For companies whose financial performance is highly sensitive to the economic cycle, the
analyst will also want to consider macroeconomic conditions when making forecasts.
Such is likely to be the case for TJX, which in the first half of 2011 faced a slow U.S.
economic recovery following the economic crisis of 2008. Despite increased consumer
spending, overall spending had not yet recovered to pre-recession levels. TJX’s focus on
value had helped it to maintain growth during the difficult economic time, with sales
growing at an average of 5 percent per year from FY 2007 through FY 2010.
8
However, several factors are likely to affect TJX’s growth prospects. High gas prices
could temper consumer enthusiasm for driving to suburban stores and reduce consumer
spending. Further, the slow pace of the economic recovery, with unemployment continu-
ing to hover near the 10 percent level and a weak housing market, combined with con-
cerns over U.S. government debt levels and legislative gridlock, raised concerns of the
potential for a “double-dip” recession in the United States. Such economic conditions
generally favor discount retailers such as TJX but also lead to reduced overall consumer
spending.
9
Finally, TJX’s expansion plans in Europe are likely to be affected by a
deteriorating economic climate arising from the financial crises in Greece, Portugal,
Spain, Ireland, and Italy.
While macroeconomic factors certainly will have an impact on TJX’s performance in
the short, medium, and long term, these factors cannot be forecast with a high degree of
certainty. Consequently, for forecasting purposes it is generally advisable to assume that
the impact of changes in the business cycle will even out in the long run.
MAKING FORECASTS
The analysis of TJX’s performance in Chapter 5, and preceding discussions about general
market behavior and TJX’s strategic positioning, leads us to the conclusion that while
TJX has consistently generated above-normal returns for its stakeholders, in the long
run it is likely that a portion of the firm’s abnormal profits will be competed away. The
performance of the firm will revert toward the mean, as has been the general trend that
we have seen earlier in the chapter.
Table 6-1 shows the forecasting assumptions we have made for TJX for years 2011 to
2020. We use as our base the adjusted financial statements detailed in Chapter 5 so that
we can fully incorporate the impact of TJX’s off–balance sheet operating leases into our
forecasts. We have chosen a ten-year forecasting period because we believe that the firm
6-8
PART 2 • Business Analysis and Valuation Tools
Copyright 2012 Cengage Learning. All Rights Reserved. May not be copied, scanned, or duplicated, in whole or in part. Due to electronic rights, some third party content may be suppressed from the eBook and/or eChapter(s).
Editorial review has deemed that any suppressed content does not materially affect the overall learning experience. Cengage Learning reserves the right to remove additional content at any time if subsequent rights restrictions require it.

should reach a relatively steady state of performance by then (discussed in further detail
in Chapter 8). We discuss the forecasting assumptions below.
The forecasts for TJX for the first two or three years of the forecast period are a
straightforward extrapolation of recent performance, which are heavily influenced by
the company’s strategic positioning, existing financials, and other company- specific
metrics. This is generally a valid approach for an established company suc h as TJX
for a few reasons. First, the company’s management gives no indication of any major
restructurings or changes to its operating and financing policies i n the short term.
Second, the beginning balance sheet fo r any forecast period places constraints on oper-
ating activit ies during that forecast period. For example, inventories at the beginning of
the year will determine to some extent the sales activities during the year; stores in
operation at the beginning of the year also determine to some extent the level of sales
achievable during the year. To put it another way, since our discussion above shows
that asset turns for a company do not usually change significantly in a short time,
sales in any period are to s ome extent constrain ed by the begin ning of the period assets
in place in the company’s balance sheet (although a company like TJX with explicit
plans to expand assets through new s tore openings will be able to achieve some flexi-
bility in this regard).
In contrast, when the analysis shifts focus to the later years of the forecast, the analyst
should increasingly incorporate the influence of mean-reverting behavior demonstrated
by the time-series analyses behavior discussed earlier.
Developing a Sales Growth Forecast
Despite the intense competition in retailing, TJX has built an impressive track record of
steady earnings and sales growth, with 15 consecutive years of earnings per share growth
as of 2010 and with annual consolidated comparable store sales increasing every year
except one in its 34 years of business.
10
Given this history, it is reasonable to expect
TABLE 6 -1 Forecasting Assumptions for TJX
Forecast Year 2011 2012 2013 2014 2015 2016 2017 2018 2019 2020
......................................................................................................................................................
Sales growth
rate
5.7% 6.6% 7.1% 6.9% 6.7% 6.5% 6.3% 6.1% 5.9% 5.7%
NOPAT
margin
7.9% 7.5% 7.1% 6.7% 6.3% 5.9% 5.5% 5.0% 4.5% 4.0%
Beginning net
operating
working
capital/sales
0.6% 1.0% 1.0% 1.0% 1.0% 1.0% 1.0% 1.0% 1.0% 1.0%
Beginning net
operating
long-term
assets/sales
33.4% 34.0% 34.3% 34.5% 34.8% 35.0% 35.3% 35.5% 35.8% 36.0%
Beginning
net debt to
capital ratio
57.5% 57.5% 57.5% 57.5% 57.5% 57.5% 57.5% 57.5% 57.5% 57.5%
After-tax
cost of debt
2.73 2.73 2.73 2.73 2.73 2.73 2.73 2.73 2.73 2.73
......................................................................................................................................................
Source: © Cengage Learning 2013
Prospective Analysis: Forecasting 6-9
Copyright 2012 Cengage Learning. All Rights Reserved. May not be copied, scanned, or duplicated, in whole or in part. Due to electronic rights, some third party content may be suppressed from the eBook and/or eChapter(s).
Editorial review has deemed that any suppressed content does not materially affect the overall learning experience. Cengage Learning reserves the right to remove additional content at any time if subsequent rights restrictions require it.
that TJX will continue to deliver growth over the forecast period. TJX has three geo-
graphic segments—the domestic market in the United States, which shows signs of stag-
nating as a result of the intensity of competition and market saturation; the Canadian
market, which at this point seems to be behaving in a similar manner to the U.S. market;
and the European market, where TJX’s initial expansion out of North America into the
markets of the U.K., Ireland, Germany, and Poland are critical components to continued
expansion as the U.S. and Canadian markets approach saturation.
At the beginning of 2011, TJX operated over 2,000 stores in the United States with its
T.J. Maxx, Marshalls, and Home Goods formats, with U.S. sales accounting for roughly
77 percent of total TJX revenue. Sales for T.J. Maxx and Marshalls stores (referred to
collectively as Marmaxx) grew 6 percent in the year ending January 2011, compared to
7.4 percent in the previous year. Comparable store sales grew by 4 percent. Home Goods
store sales (which made up about 12 percent of total U.S. sales) grew 9 percent in the year
ending January 2011, with same store sales increasing 6 percent. Given that TJX has a
fairly comprehensive U.S. retail network (the company estimated that it had achieved
roughly 70 percent market penetration in the U.S. market by 2011), new store openings
would be expected to increasingly cannibalize sales from existing stores in the same area
as full market penetration is approached, reducing growth in comparable store sales.
11
New store openings are also likely to slow as unique attractive locations become increas-
ingly scarce. At the same time, TJX viewed the recent economic downturn as an opportu-
nity to broaden its customer base, perceiving a permanent consumer “shift to value,” and
has worked to attract and retain more affluent customers with store upgrades and targeted
advertising.
12
However, it is unclear whether this shift in consumer sentiment will be per-
manent and whether this initiative will be successful in offsetting a coming slowdown in
same store sales. TJX also faces increasing competition from high-end department stores
that have established their own off-price formats (Nordstrom Rack, Off 5th), as well as
from the growing online channel. Thus, it is reasonable to expect that TJX’s overall
U.S. sales growth will trend downward, though probably at a slower pace than would be
implied by the mean-reverting tendency of sales growth for the overall market.
TJX Canada sales (which accounted for about 12 percent of total TJX sales) increased
16 percent for the year ended January 2011 as compared to the previous year, although
roughly 9 percent of that was due to currency translation—previous year’s sales growth had
been only 1 percent, including currency translation impact, which reduced that level by
3 percent. Same store sales increased by 4 percent for the year ended January 2011 and
2 percent for the previous year. Absent currency translation effect, TJX Canada seems to be
behaving in a similar manner to the U.S. segment. TJX estimates market penetration in
Canada at about 70 percent in early 2011, and thus it is reasonable to expect that TJX
Canada will exhibit similar sales growth characteristics as the U.S. market discussed above.
13
TJX’s European operation presents a more interesting forecasting challenge. The sub-
tleties of local tastes and bureaucr atic complexities in local real estate markets have
made it extremely challenging for nondomestic retailing companies to establish market
leadership outside their home markets. Since its entry into the U.K. in 1994, TJX has
worked to establish its p osition as the only major off-price retailer in Europe, with
operations in 2011 in the U.K., Germany , and Poland. Sales grew by 10 percent from
2009 to 2010, and 13 percent when a negative currency translation impact is excluded.
14
While TJX conti nues to see strong growth potential in Europe, early in 2011 it actually
announced plans to slow its expansion in order to address execution concerns that in
the year ended January 2011, resulted in a decrease in segment profit and a decline in
same store sales.
15
Given TJX’s estimate of 41 perce nt penetration in its European seg-
ment, it is re asonable to assume that once the company sorts out its o perati onal issues,
it will ex perience a rate of growth that may surpass that of its more penetrated marke ts
6-10
PART 2 • Business Analysis and Valuation Tools
Copyright 2012 Cengage Learning. All Rights Reserved. May not be copied, scanned, or duplicated, in whole or in part. Due to electronic rights, some third party content may be suppressed from the eBook and/or eChapter(s).
Editorial review has deemed that any suppressed content does not materially affect the overall learning experience. Cengage Learning reserves the right to remove additional content at any time if subsequent rights restrictions require it.

in the United States and Canada. However, on an overall basis, a higher growth rate in
Europe will likely not be enough to overcome slowing growth in the United Stat es and
Canada, given that as of 2011 the European seg ment contributed only about 11 percent
of total TJX sales revenue and, in our ten year forecast period, ris es only to about
14 percent of total TJX sales revenue.
The projections in Table 6-2 reflect the analysis of TJX’s three geographic segments
discussed above. We have combined the U.S. and Canada segments given that they
appear to have similar growth and saturation characteristics. For TJX overall we show a
gradual improvement in sales growth over the next couple of years, followed by a slow
decline in growth as the impact of mean-reversion pressures are felt. While this pattern
is based on a mixture of business intelligence and a knowledge of long-term trends in the
market, it is important to note that an analyst could capture much of the dynamics of
the projections merely by assuming that TJX will not be immune to the long-run forces
of competition and mean reversion.
Developing a NOPAT Margin Forecast
In the U.S. and Canadian markets, TJX is likely to face increasing direct competitive
pressure from the high-end department stores such as Nordstrom and Saks as they
expand their off-price brands in the United States, and from U.S. and domestic compe-
titors such as Target, Wal-Mart, Nordstrom, and Hudson’s Bay Company as they estab-
lish or expand their Canadian presence. In addition, an improving economy in the
United States would be expected to shift some portion of the more affluent end of
TJX’s customer base back toward the high-end department stores as consumer sentiment
improves. TJX believes that its program of store upgrades and targeted advertising will
be successful in retaining its broader customer base as the economy rebounds. In addi-
tion, it expects its global supply chain infrastructure to help it continue to increase
inventory turns and reduce the need for markdowns by purchasing later in the sales
cycle. This improved merchandising and affluent customer retention, if successfully exe-
cuted, could lead to a narrowing of the margin gap seen in the comparison of TJX and
Nordstrom in Chapter 5. However, over time it is likely that competitive pressures will
have a greater impact, leading to a steady decline in NOPAT margins, although perhaps
at a slower rate than that of less successful competitors.
Slow customer acceptance, start-up costs, and less-developed infrastructure has
resulted in TJX’s European operations generating lower margins than its U.S./Canadian
businesses. In addition, European execution problems and accompanying weak financial
results in 2011 led the company to slow expansion plans until the issues had been
resolved.
16
We anticipate that in the short term TJX’s European margins will continue
to be lower than those in the United States and Canada as the company sorts out its
execution issues and establishes a larger presence in the market. Thereafter, margins in
TABLE 6 -2 Forecasted Sales Growth for TJX
Forecast Year 2011 2012 2013 2014 2015 2016 2017 2018 2019 2020
........................................................................................................................................................
TJX
U.S./Canada
5.7% 6.4% 6.7% 6.5% 6.2% 6.0% 5.8% 5.7% 5.5% 5.3%
TJX Europe 5.0% 8.0% 10.0% 10.0% 10.0% 10.0% 10.0% 9.0% 8.5% 8.0%
Overall Sales
Growth
5.7% 6.6% 7.1% 6.9% 6.7% 6.5% 6.3% 6.1% 5.9% 5.7%
........................................................................................................................................................
Source: © Cengage Learning 2013
Prospective Analysis: Forecasting 6-11
Copyright 2012 Cengage Learning. All Rights Reserved. May not be copied, scanned, or duplicated, in whole or in part. Due to electronic rights, some third party content may be suppressed from the eBook and/or eChapter(s).
Editorial review has deemed that any suppressed content does not materially affect the overall learning experience. Cengage Learning reserves the right to remove additional content at any time if subsequent rights restrictions require it.

Europe will show slow improvement as customer acceptance grows and operational effi-
ciencies are achieved. However, given the costs of managing expected higher growth in
Europe and continued lower levels of consumer acceptance versus the United States, we
expect that margins in Europe will remain lower than those of the U.S. and Canadian
markets throughout the forecast period, further lowering the company’s overall NOPAT
margins. Table 6-3 shows our forecast of TJX’s average NOPAT margins going forward.
While we would have preferred to forecast NOPAT margins by segment, TJX does not
provide fully allocated segment data in order for us to do so. As a result, our overall
NOPAT margin forecast takes into account the analysis above.
Developing a Working Capital to Sales Forecast
As discussed in Chapter 5, TJX had an operating working capital ratio to sales of less
than 1.0 in the year ended January 2011. The primary drivers of this low ratio were its
focus on driving higher inventory turnover and its low accounts receivable levels result-
ing from the strategic decision to outsource the TJX branded credit card operations.
While TJX prides itself in prompt payment to vendors, as reflected in its reasonable
35.3 days accounts payable in 2010, this low ratio implies that TJX is able to fund its
working capital needs—primarily for inventory—through its trade and other short-term
creditors and accruals.
TJX continues to view its opportunistic buying strategy as critical to its success at
maintaining low inventory levels, and it has built its global supplier network to facilitate
this strategy.
17
Working capital needs are also likely to decline as TJX improves opera-
tions in Europe and takes advantage of its growing international presence to negotiate
more favorable terms with its suppliers. Therefore, it is reasonable to expect that its net
operating working capital to sales ratio will remain at or near its current level as the
firm’s market power grows and it continues to invest in its supply chain.
Developing a Long-Term Assets to Sales Forecast
As the pace of TJX’s new store openings in the United States and Canada slows, compa-
rable store sales growth should improve as fewer new stores will open up near existing
stores, reducing the risk of customer cannibalization. This should have a beneficial
impact on the firm’s long-term asset use in the United States and Canada. Counteracting
this improvement is TJX’s recent focus on attracting and retaining more affluent custo-
mers with enhanced stores. Also, with growth in the asset-intensive European segment
outpacing that of the North American businesses, TJX’s ratio of long-term assets to
sales is likely to gradually deteriorate over the forecast horizon.
Developing a Capital Structure Forecast
As we discussed previously (and as can be seen in the historical data on capital structure
found in the appendix), a company’s capital structure would typically be expected to
remain constant over the forecast period, simply because management policies on capital
TABL E 6 -3 Forecasted NOPAT Margins for TJX
Forecast Year 2011 2012 2013 2014 2015 2016 2017 2018 2019 2020
.......................................................................................................................................................
Overall NOPAT
margin
7.9% 7.5% 7.1% 6.7% 6.3% 5.9% 5.5% 5.0% 4.5% 4.0%
.......................................................................................................................................................
Source: © Cengage Learning 2013
6-12 PART 2 • Business Analysis and Valuation Tools
Copyright 2012 Cengage Learning. All Rights Reserved. May not be copied, scanned, or duplicated, in whole or in part. Due to electronic rights, some third party content may be suppressed from the eBook and/or eChapter(s).
Editorial review has deemed that any suppressed content does not materially affect the overall learning experience. Cengage Learning reserves the right to remove additional content at any time if subsequent rights restrictions require it.
structure are slow to change. We would expect this to be true of TJX as well after looking
at recent actions related to capital structure taken by the company. For instance, TJX’s
Board of Directors authorized a $1.0 billion share repurchase program in February
2010, of which $594 million had yet to be repurchased as of January 2011. In addition,
the Board of Directors approved a new stock repurchase program in February 2011
authorizing the repurchase of an additional $1.0 billion of TJX common stock. However,
there was no time limit within which these purchases needed to be completed, and deci-
sions on share repurchases were based on the firm’s assessment of “various factors
including anticipated excess cash flow, liquidity, market conditions, the economic envi-
ronment and prospects for the business and other factors.”
18
Thus, we expect that it is
unlikely that TJX will make any fundamental change in its capital structure so that the
firm’s leverage and debt yield (5.5 percent before tax and 3.4 percent after tax) remain
relatively stable.
Having made the set of key assumptions detailed above, it is a straightforward task to
derive the forecasted income statements and beginning balance sheets for years 2011
through 2020 as shown in Table 6-4. Under these forecasts, TJX’s sales will grow to
$40.6 billion, almost double the level in 2010. By 2020, the firm will have a net operating
asset base of $15.0 billion and shareholders ’ equity of $6.4 billion. Consistent with
market-wide patterns of mean-reversion in returns, TJX’s return on equity and operating
return on assets will decline steadily—ROE from 55.4 percent in 2010 to 21.7 percent by
2020, and Operating ROA from 27.8 percent to 10.8 percent over the same period.
Cash Flow Foreca sts
Once we have forecasted income statements and balance sheets, we can derive cash flows
for the years 2011 through 2020. Note that we need to forecast the beginning balance sheet
for 2021 to compute the cash flows for 2020. This balance sheet is not shown in Table 6-4.
For the purpose of illustration, we assume that the sales growth and the balance sheet
ratios remain the same in 2021 as in 2020. Based on this, we project a beginning balance
sheet for 2021 and compute the cash flows for 2020. Cash flow to capital is equal to
NOPAT minus increases in net working capital and net long-term assets. As Table 6-4
shows, the free cash flow to all providers of capital decreases from $1.1 billion in 2011 to
$0.8 billion by 2020, while cash flow to equity, which adds/deducts cash inflows/outflows
to debt holders, decreases from $1.4 billion to $1.0 billion over the same period.
SENSITIVITY ANALYSIS
The projections discussed thus far represent nothing more than an estimation of a most
likely scenario for TJX. Managers and analysts are typically interested in a broader range
of possibilities. An analyst estimating the value of TJX would typically consider the sen-
sitivity of projections to the key assumptions about sales growth, profit margins, and
asset utilization. What if TJX is able to retain more of its competitive advantage in the
United States than assumed in the above forecasts? Alternatively, what if it is unable to
successfully address its operational issues in Europe and is unable to replicate its success
in the United States in other markets? It is wise to also generate projections based on a
variety of assumptions to determine the sensitivity of the forecasts to these assumptions.
There is no limit to the number of possible scenarios that can be considered. One
systematic approach to sensitivity analysis is to start with the key assumptions underly-
ing a set of forecasts, and then examine the sensitivity to the assumptions with greatest
uncertainty in a given situation. For example, if a company has experienced a variable
pattern of gross margins in the past, it is important to make projections using a range
Prospective Analysis: Forecasting 6-13
Copyright 2012 Cengage Learning. All Rights Reserved. May not be copied, scanned, or duplicated, in whole or in part. Due to electronic rights, some third party content may be suppressed from the eBook and/or eChapter(s).
Editorial review has deemed that any suppressed content does not materially affect the overall learning experience. Cengage Learning reserves the right to remove additional content at any time if subsequent rights restrictions require it.

TABL E 6 -4 Forecasted Financial Statements for TJX
Forecast Year 2011 2012 2013 2014 2015 2016 2017 2018 2019 2020
.................................................................................................................................................................................................................................................................
Beginning Balance Sheet
Beg. net working capital 144.1 247.2 264.8 283.1 302.0 321.7 341.9 362.8 384.2 406.1
þ Beg. net long-term assets 7,754.4 8,406.0 9,069.1 9,765.6 10,495.4 11,258.0 12,052.7 12,878.7 13,734.5 14,618.9
= net operating assets 7,898.5 8,653.3 9,333.9 10,048.7 10,797.4 11,579.7 12,394.7 13,241.4 14,118.7 15,025.0
Net Debt 4,541.4 4,975.3 5,366.6 5,777.6 6,208.1 6,657.9 7,126.5 7,613.4 8,117.8 8,638.9
þ Preferred stock 0.0 0.0 0.0 0.0 0.0 0.0 0.0 0.0 0.0 0.0
þ Shareholders’ equity 3,357.1 3,677.6 3,967.2 4,271.0 4,589.3 4,921.8 5,268.2 5,628.1 6,001.0 6,386.2
= Net capital 7,898.5 8,653.3 9,333.9 10,048.7 10,797.4 11,579.7 12,394.7 13,241.4 14,118.7 15,025.0
Income Statement
Sales 23,192.9 24,723.6 26,479.0 28,306.1 30,202.6 32,165.7 34,192.2 36,277.9 38,418.3 40,608.2
Net operating profits after tax 1,832.2 1,854.3 1,880.0 1,896.5 1,902.8 1,897.8 1,880.6 1,813.9 1,728.8 1,624.3
Net interest expense after tax 123.9 135.7 146.4 157.6 169.4 181.6 194.4 207.7 221.5 235.7
= Net income 1,708.4 1,718.6 1,733.6 1,738.9 1,733.4 1,716.2 1,686.2 1,606.2 1,507.4 1,388.7
Preferred dividends 0 0 0 0 0 0 0 0 0 0
= Net income to common 1,708.4 1,718.6 1,733.6 1,738.9 1,733.4 1,716.2 1,686.2 1,606.2 1,507.4 1,388.7
Operating return on assets 23.2% 21.4% 20.1% 18.9% 17.6% 16.4% 15.2% 13.7% 12.2% 10.8%
Return on common equity 50.9% 46.7% 43.7% 40.7% 37.8% 34.9% 32.0% 28.5% 25.1% 21.7%
Book value of assets growth rate 23.7% 9.6% 7.9% 7.7% 7.5% 7.2% 7.0% 6.8% 6.6% 6.4%
Book value of common equity
Growth rate
16.2% 9.6% 7.9% 7.7% 7.5% 7.2% 7.0% 6.8% 6.6% 6.4%
Net operating asset turnover 2.9 2.9 2.8 2.8 2.8 2.8 2.8 2.7 2.7 2.7
Cash Flow Data
Net income 1,708.4 1,718.6 1,733.6 1,738.9 1,733.4 1,716.2 1,686.2 1,606.2 1,507.4 1,388.7
Change in net working capital 103.1 17.6 18.3 19.0 19.6 20.3 20.9 21.4 21.9 23.2
Change in net long-term assets 651.6 663.0 696.5 729.8 762.6 794.7 825.9 855.9 884.4 833.3
þ Change in net debt 434.0 391.3 411.0 430.5 449.8 468.6 486.9 504.4 521.1 492.4
= Free cash flow to equity 1,387.6 1,429.3 1,429.8 1,420.6 1,400.9 1,369.8 1,326.3 1,233.3 1,122.2 1,024.7
Net operating profit after tax 1,832.2 1,854.3 1,880.0 1,896.5 1,902.8 1,897.8 1,880.6 1,813.9 1,728.8 1,624.3
Change in net working capital 103.1 17.6 18.3 19.0 19.6 20.3 20.9 21.4 21.9 23.2
Change in net long-term assets 651.6 663.0 696.5 729.8 762.6 794.7 825.9 855.9 884.4 833.3
= Free cash flow to capital 1,077.5 1,173.7 1,165.2 1,147.7 1,120.5 1,082.8 1,033.8 936.6 822.5 767.9
.................................................................................................................................................................................................................................................................
Source: © Cengage Learning 2013
..................................................................................................................................................
.................................................................................................................................................
..................................................................................................................................................
6-14 PART 2 • Business Analysis and Valuation Tools
Copyright 2012 Cengage Learning. All Rights Reserved. May not be copied, scanned, or duplicated, in whole or in part. Due to electronic rights, some third party content may be suppressed from the eBook and/or eChapter(s).
Editorial review has deemed that any suppressed content does not materially affect the overall learning experience. Cengage Learning reserves the right to remove additional content at any time if subsequent rights restrictions require it.
of margins. Alternatively, if a company has announced a significant change in its expan-
sion strategy, asset utilization assumptions might be more uncertain. In determining
where to invest one’s time in performing sensitivity analysis, it is therefore important to
consider historical patterns of performance, changes in industry conditions, and changes
in a company’s competitive strategy.
In the case of TJX, two likely alternatives to the forecast can be readily envisioned.
The forecast presented above expects that TJX’s above average success in the U.S. market
gradually diminishes, while the European division addresses its operational issues and
contributes stronger growth and improvement in performance. An upside case for TJX
would have the firm continuing to achieve strong results in the United States and resist-
ing the mean-reverting trends that characterize the market in general, in addition to the
increased contribution from European operations. On the downside, the projected
improvement in the European business could fail to materialize, hastening the decline
in TJX’s overall performance toward the market averages.
Seasonality and Inter im Forecasts
Thus far, we have concerned ourselves with annual forecasts. However, especially for
security analysts in the United States, forecasting is very much a quarterly exercise. Fore-
casting quarter-by-quarter raises a new set of questions. How important is seasonality?
What is a useful starting point—the most recent quarter’s performance? The comparable
quarter of the prior year? Some combination of the two? How should quarterly data be
used to produce an annual forecast? Does the item-by-item approach to forecasting used
for annual data apply equally well to quarterly data? Full consideration of these questions
lies outside the scope of this chapter, but we can begin to answer some of them.
Seasonality is a more important phenomenon in sales and earning behavior than one might
guess. It is present for more than just the retail sector firms that benefit from holiday sales.
Seasonality also results from weather-related phenomena (e.g., for electric and gas utilities,
construction firms, and motorcycle manufacturers), new product introduction patterns (e.g.,
for the automobile industry), and other factors. Analysis of the time series behavior of earnings
for U.S. firms suggests that at least some seasonality is present in nearly every major industry.
The implication for forecasting is that one cannot focus only on performance of the
most recent quarter as a starting point. In fact, the evidence suggests that, in forecasting
earnings, if one had to choose only one quarter’s performance as a basis for forecasting,
it would be the comparable quarter of the prior year, not the most recent quarter. Note
how this finding is consistent with the reports of analysts or the financial press; when
they discuss a quarterly earnings announcement, it is nearly always evaluated relative to
the performance of the comparable quarter of the prior year, not the most recent quarter.
Research has produced models that forecast sales, earnings, or EPS based solely on prior
quarters’ observations. These models are not used by many analysts since they have access
to much more information than such simple models contain. However, the models are
useful for helping those unfamiliar with the behavior of earnings data to understand how
it tends to evolve over time. Such an understanding can provide useful general back-
ground, a point of departure in forecasting that can be adjusted to reflect details not
revealed in the history of earnings, or a “reasonableness” check on a detailed forecast.
One model of the earnings process that fits well across a variety of industries is the
so-called Foster model.
19
Using Q
t
to denote earnings (or EPS) for quarter t, and E(Q
t
)
as its expected value, the Foster model predicts that
EðQ
t
Þ¼Q
t4
þ δ þ φðQ
t1
Q
t5
Þ
Foster shows that a model of the same form also works well with quarterly sales data.
Prospective Analysis: Forecasting 6-15
Copyright 2012 Cengage Learning. All Rights Reserved. May not be copied, scanned, or duplicated, in whole or in part. Due to electronic rights, some third party content may be suppressed from the eBook and/or eChapter(s).
Editorial review has deemed that any suppressed content does not materially affect the overall learning experience. Cengage Learning reserves the right to remove additional content at any time if subsequent rights restrictions require it.

The form of the Foster model confirms the importance of seasonality because it shows
that the starting point for a forecast for quarter t is the earnings four quarters ago, Q
t4
.
It states that, when constrained to using only prior earnings data, a reasonable forecast of
earnings for quarter t includes the following elements:
• the earnings of the comparable quarter of the prior year (Q
t4
);
• a long-run trend in year-to-year quarterly earnings increases (δ); and
• a fraction (φ) of the year-to-year increase in quarterly earnings experienced most
recently (Q
t 1
Q
t 5
).
The p arameters δ and φ can easily be estimated for a given firm with a simple linear
regression model available in most spreadsheet software.
20
For most firms the parame-
ter φ tends to be in the range of . 25 to .50, indic ating that 25 to 50 percent of an
increase in quarterly earnings tends to persist in the form of another increase in the
subsequent quarter. T he parameter δ reflects in part the average year-to-year change
in quarterly earnings over past years, and it varies considerably from firm to firm.
Research indicates that the Foster model produces one quarter ahead forecasts that
vary from actual results by $.30 to $.35 per share, on average. Such a degree of accuracy
stacks up surprisingly well with that of security analysts, who obviously have access to
much information ignored in the model. As one would expect, most of the evidence sup-
ports analysts’ forecasts being more accurate, but the models are good enough to be a
reasonable approximation in most circumstances. While it would certainly be unwise to
rely completely on such a mechanistic model, an understanding of the typical earnings
behavior reflected by the model is useful.
SUMMARY
Forecasting represents the first step of prospective analysis and serves to summarize the
forward-looking view that emanates from business strategy analysis, accounting analysis,
and financial analysis. Although not every financial statement analysis is accompanied by
such an explicit summarization of a view of the future, forecasting is still a key tool for
managers, consultants, security analysts, investment bankers, commercial bankers, and
other credit analysts, among others.
The best approach to forecasting future performance is to do it comprehensively—
producing not only an earnings forecast but also a forecast of cash flows and the balance
sheet as well. Such a comprehensive approach provides a guard against internal inconsis-
tencies and unrealistic implicit assumptions. The approach described here involves a
condensed, line-by-line analysis, so as to recognize that different items on the income
statement and balance sheet are influenced by different drivers. Nevertheless, it remains
the case that a few key projections—such as sales growth and profit margin—usually
drive most of the projected numbers.
The forecasting process should be embedded in an understanding of how various
financial statistics tend to behave on average and what might cause a firm to deviate
from that average. Absent detailed information to the contrary, one would expect sales
and earnings numbers to persist at their current levels, adjusted for overall trends of
recent years. However, rates of return on investment (ROEs) tend, over several years, to
move from abnormal to normal levels—close to the cost of equity capital—as the forces
of competition come into play. Profit margins also tend to shift to normal levels, but for
this statistic “normal” varies widely across firms and industries, depending on the levels
of asset turnover and leverage. Some firms are capable of creating barriers to entry that
6-16
PART 2 • Business Analysis and Valuation Tools
Copyright 2012 Cengage Learning. All Rights Reserved. May not be copied, scanned, or duplicated, in whole or in part. Due to electronic rights, some third party content may be suppressed from the eBook and/or eChapter(s).
Editorial review has deemed that any suppressed content does not materially affect the overall learning experience. Cengage Learning reserves the right to remove additional content at any time if subsequent rights restrictions require it.

enable them to fight these tendencies toward normal returns, even for many years, but
such firms are the unusual cases.
Forecasting should be preceded by a comprehensive business strategy, accounting, and
financial analysis. It is important to understand the dynamics of the industry in which
the firm operates and its competitive positioning within that industry. Therefore, while
general market trends provide a useful benchmark, it is critical that the analyst incorpo-
rate the views developed about the firm’s prospects to guide the forecasting process.
For some purposes, including short-term planning and security analysis, forecasts for
quarterly periods are desirable. One important feature of quarterly data is seasonality; at
least some seasonality exists in the sales and earnings data of nearly every industry. An
understanding of a firm’ s intra-year peaks and valleys is a necessary ingredient of a good
forecast of performance on a quarterly basis.
Forecasts provide the input for estimating a firm’s value, which can be viewed as the
best attempt to reflect in a single summary statistic the manager’s or analyst’s view of the
firm’s prospects. The process of converting a forecast into a value estimate is labeled val-
uation and is discussed in the next chapter.
DISCUSSION QUESTIONS
1. Merck is one of the largest pharmaceutical firms in the world, and over an extended
period of time in the recent past, it consistently earned higher ROEs than the phar-
maceutical industry as a whole. As a pharmaceutical analyst, what factors would you
consider to be important in making projections of future ROEs for Merck? In par-
ticular, what factors would lead you to expect Merck to continue to be a superior
performer in its industry, and what factors would lead you to expect Merck’s future
performance to revert to that of the industry as a whole?
2. John Right, an analyst with Stock Pickers, Inc., claims, “ It is not worth my time to
develop detailed forecasts of sales growth, profit margins, et cetera, to make earnings
projections. I can be almost as accurate, at virtually no cost, using the random walk
model to forecast earnings.” What is the random walk model? Do you agree or dis-
agree with John Right’s forecast strategy? Why or why not?
3. Which of the following types of businesses do you expect to show a high degree of
seasonality in quarterly earnings? Explain why.
• a supermarket
• a pharmaceutical company
• a software company
• an auto manufacturer
• a clothing retailer
4. What factors are likely to drive a firm’ s outlays for new capital (such as plant, prop-
erty, and equipment) and for working capital (such as receivables and inventory)?
What ratios would you use to help generate forecasts of these outlays?
5. How would the following events (reported this year) affect your forecasts of a firm’s
future net income?
• an asset write-down
• a merger or acquisition
• the sale of a major division
• the initiation of dividend payments
Prospective Analysis: Forecasting 6-17
Copyright 2012 Cengage Learning. All Rights Reserved. May not be copied, scanned, or duplicated, in whole or in part. Due to electronic rights, some third party content may be suppressed from the eBook and/or eChapter(s).
Editorial review has deemed that any suppressed content does not materially affect the overall learning experience. Cengage Learning reserves the right to remove additional content at any time if subsequent rights restrictions require it.

6. Consider the following two earnings forecasting models:
EðEPS
tþ1
Þ¼ EPS
t
Model 1:
EðEPS
tþ1
Þ¼
1
5
X
5
t ¼1
EPS
t
E(EPS
tþ1
) is the expected forecast of earnings per share for year t þ 1, given information
available at t. Model 1 is usually called a random walk model for earnings, whereas
Model 2 is called a mean-reverting model. The earnings per share for TJX for the fiscal
years ending January 2006 (FY2005) through January 2010 (FY2009) are as follows:
Fiscal Year 2005 2006 2007 2008 2009
..........................................................................................................................................
EPS $1.40 $1.60 $1.70 $2.00 $2.80
...........................................................................................................................................
a. What would the forecast for earnings per share in FY2010 be for each model?
b. Actual earnings per share for TJX in FY2010 were $3.30. Given this information,
what would be the FY2011 forecast for earnings per share for each model? Why
do the two models generate quite different forecasts? Which do you think would
better describe earnings per share patterns? Why?
7. Joe Fatcat, an investment banker, states, “It is not worth my while to worry about
detailed long-term forecasts. Instead, I use the following approach when forecasting
cash flows beyond three years: I assume that sales grow at the rate of inflation, capi-
tal expenditures are equal to depreciation, and that net profit margins and working
capital to sales ratios stay constant.” What pattern of return on equity is implied by
these assumptions? Is this reasonable?
NOTES
1. See P. O’Brien, “Analysts’ Forecasts as Earnings Expectations,” Journal of Accounting
and Economics ( January 1988): 53–83.
2. See G. Foster, “Quarterly Accounting Data: Time Series Properties and Predictive
Ability Results,” The Accounting Review (January 1977): 1–21.
3. See R. Freeman, J. Ohlson, and S. Penman, “Book Rate-of-Return and Prediction of
Earnings Changes: An Empirical Investigation,” Journal of Accounting Research
(Autumn 1982): 639–53.
4. See S. Penman, “An Evaluation of Accounting Rate-of-Return,” Journal of Account-
ing, Auditing, and Finance (Spring 1991): 233–56; E. Fama and K. French, “Size and
Book-to-Market Factors in Earnings and Returns,” Journal of Finance (March 1995):
131–56; and V. Bernard, “Accounting-Based Valuation Methods: Evidence on the
Market-to-Book Anomaly and Implications for Financial Statements Analysis,”
(working paper, University of Michigan, 1994). Ignoring the effects of accounting
artifacts, ROEs should be driven in a competitive equilibrium to a level approximat-
ing the cost of equity capital.
5. The pattern of ROE mean reversion is not just a U.S. phenomenon. It is also com-
mon among non-U.S. firms. Research finds that the pattern persists across a wide
range of countries, and that mean reversion is faster in countries with more compet-
itive product and capital markets, and with less efficient governments. See P. Healy,
G. Serafeim, S. Srinivasan, and G. Yu, “Market Competition, Government Efficiency,
and Profitability Around the World,” HBS Working Paper, No. 12-010, 2011.
6-18 PART 2 • Business Analysis and Valuation Tools
Copyright 2012 Cengage Learning. All Rights Reserved. May not be copied, scanned, or duplicated, in whole or in part. Due to electronic rights, some third party content may be suppressed from the eBook and/or eChapter(s).
Editorial review has deemed that any suppressed content does not materially affect the overall learning experience. Cengage Learning reserves the right to remove additional content at any time if subsequent rights restrictions require it.
6. A “normal” profit margin is that which, when multiplied by the turnover achievable
within an industry and with a viable corporate strategy, yields a return on invest-
ment that just covers the cost of capital. However, as mentioned above, accounting
artifacts can cause returns on investment to deviate from the cost of capital for long
periods, even in a competitive equilibrium.
7. A recent paper by B. Groysberg, P. Healy, N. Nohria, and G. Serafeim, “What Fac-
tors Drive Analyst Forecasts?” Financial Analysts Journal 67, no. 4 (July–August
2011) finds that, controlling for prior year performance, the most important factors
explaining analysts’ revenue and earnings forecasts are their assessments of its
industry’s growth prospects, followed by their evaluations of the quality of its top
management, the firm’s ability to execute its strategy, whether its judged to have a
performance-driven culture, and the competitiveness of its industry.
8. Thomson ONE, accessed May 2011.
9. For instance, see Tim Fernholz, “With Debt Ceiling Reached, Tensions Rise First in
Washington,” National Journal, May 26, 2011, http://www.nationaljournal.com/
budget/with-debt-limit-reached-tensions-rise-first-in-washington-20110516, accessed
May 2011, and Simon Constable, “ Economist Shiller Sees Potential for “Double Dip’
Recession,” Wall Street Journal, August 28, 2010, http://online.wsj.com/article/
SB10001424052748704147804575455370525902224.html, accessed May 2011.
10. TJX Companies, Inc., 2010 Annual Report, p. 1, http://www.tjx.com/investor_landing.
asp, accessed May 2011.
11. TJX Companies, Inc., January 29, 2011, Form 10-K (filed March 30, 2011), pp. 5–6,
http://www.tjx.com/investor_landing.asp, accessed May 2011.
12. TJX Companies, Inc., 2009 Annual Report, pp. 3–4, http://www.tjx.com/investor_
landing.asp, accessed May 2011.
13. TJX Companies, Inc., January 29, 2011, Form 10-K (filed March 30, 2011), pp. 27–28,
http://www.tjx.com/investor_landing.asp, accessed May 2011.
14. TJX Companies, Inc., 2009 Annual Report, p. 8, http://www.tjx.com/investor_landing.
asp, accessed May 2011.
15. TJX Companies, Inc., January 29, 2011, Form 10-K (filed March 30, 2011), p. 28,
http://www.tjx.com/investor_landing.asp, accessed May 2011.
16. Ibid, p. 28.
17. TJX Companies, Inc., 2009 Annual Report, http://www.tjx.com/investor_landing.asp,
accessed May 2011.
18. TJX Companies, Inc., 2010 Annual Report, p. 31, http://www.tjx.com/investor_landing.
asp, accessed May 2011.
19. See Foster, op. cit. A somewhat more accurate model is furnished by Brown and
Rozeff, but it requires interactive statistical techniques for estimation. See L. Brown
and M. Rozeff, “Univariate Time Series Models of Quarterly Accounting Earnings
per Share,” Journal of Accounting Research (Spring 1979): 179–89.
20. To estimate the model, we write in terms of realized earnings (as opposed to
expected earnings) and move Q
t−4
to the left-hand side:
Q
t
Q
t4
¼ þ ðQ
t1
Q
t5
Þþe
t
We now have a regression where (Q
t
Q
t4
) is the dependent variable, and its lagged
value—(Q
t 1
Q
t5
)—is the independent variable. Thus, to estimate the equation,
prior earnings data must first be expressed in terms of year-to-year changes; the change
for one quarter is then regressed against the change for the most recent quarter. The
intercept provides an estimate of δ, and the slope is an estimate of φ. The equation is
typically estimated using 24 to 40 quarters of prior earnings data.
Prospective Analysis: Forecasting 6-19
Copyright 2012 Cengage Learning. All Rights Reserved. May not be copied, scanned, or duplicated, in whole or in part. Due to electronic rights, some third party content may be suppressed from the eBook and/or eChapter(s).
Editorial review has deemed that any suppressed content does not materially affect the overall learning experience. Cengage Learning reserves the right to remove additional content at any time if subsequent rights restrictions require it.
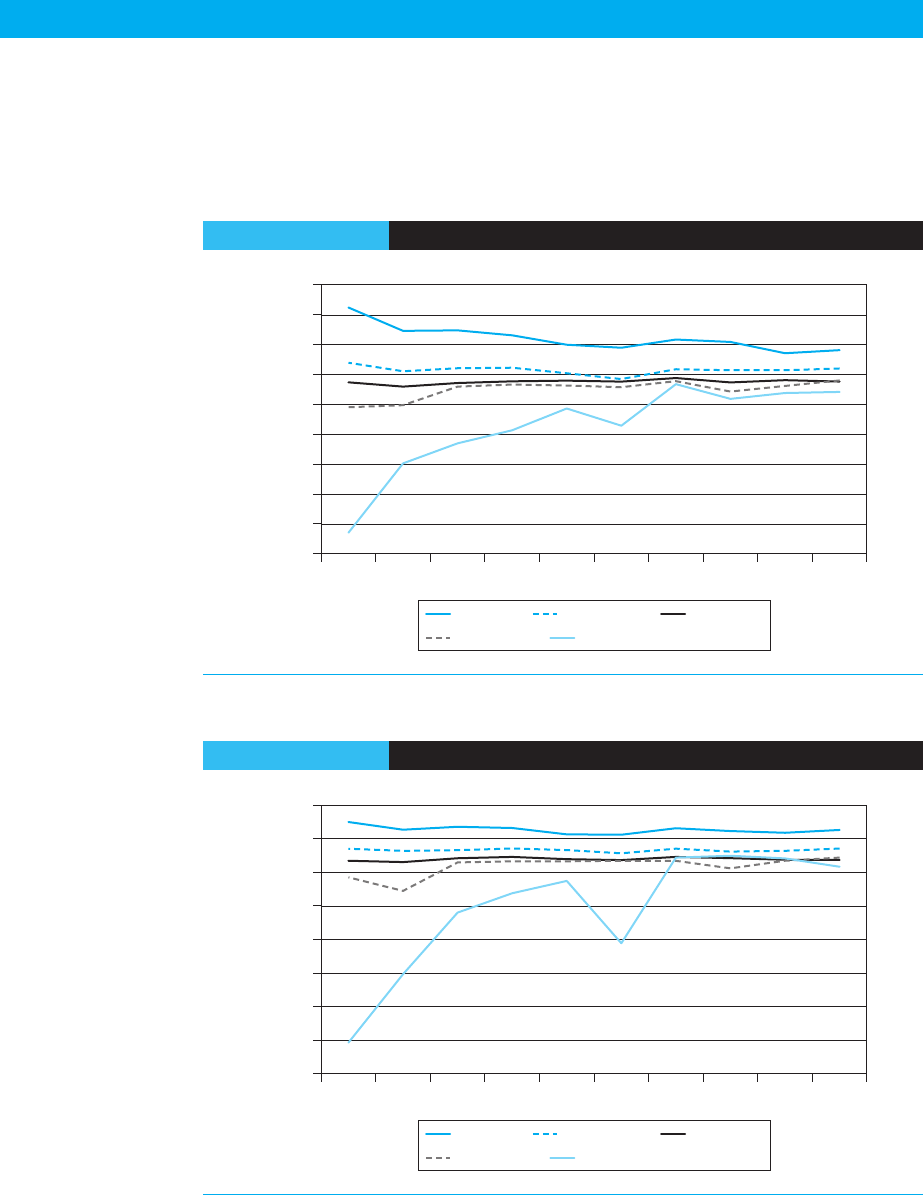
APPENDIX The Behavior of Components of ROE
In Figure 6-2 we show that ROEs tend to be mean-reverting. In this appendix we show
the behavior of the key components of ROE—operating ROA, operating margin, operat-
ing asset turnover, and net financial leverage. These ratios are computed using the same
portfolio approach described in the chapter, based on the data for all publicly listed U.S.
firms for the time period 1993 through 2010 as listed in the Compustat database.
FIGURE A-1 Behavior of Operating ROA for U.S. Firms, 1993–2010
−50.0%
12345678910
−40.0%
−30.0%
−20.0%
−10.0%
0.0%
10.0%
20.0%
30.0%
40.0%
Top Fifth Second Fifth Third Fifth
Fourth Fifth Bottom Fifth
Source: © Cengage Learning 2013
FIGURE A-2 Behavior of NOPAT Margin for U.S. Firms, 1993–2010
12345678910
−60.0%
−50.0%
−40.0%
−30.0%
−20.0%
−10.0%
0.0%
10.0%
20.0%
Top Fifth Second Fifth Third Fifth
Fourth Fifth Bottom Fifth
Source: © Cengage Learning 2013
6-20 PART 2 • Business Analysis and Valuation Tools
Copyright 2012 Cengage Learning. All Rights Reserved. May not be copied, scanned, or duplicated, in whole or in part. Due to electronic rights, some third party content may be suppressed from the eBook and/or eChapter(s).
Editorial review has deemed that any suppressed content does not materially affect the overall learning experience. Cengage Learning reserves the right to remove additional content at any time if subsequent rights restrictions require it.
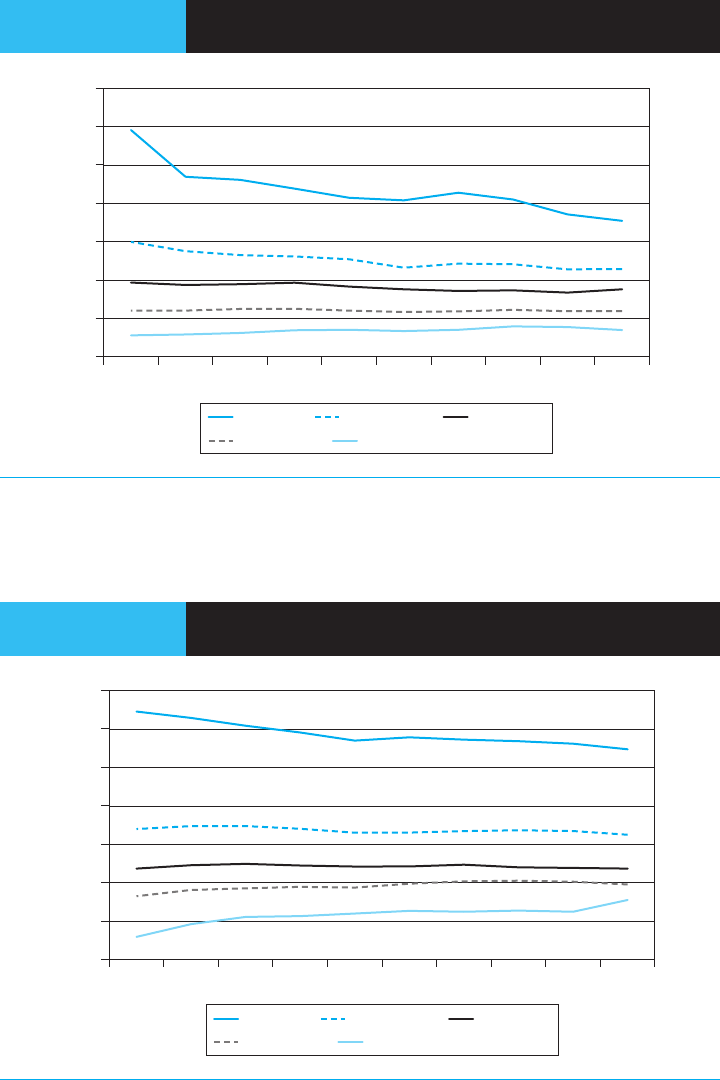
FIGURE A- 3 Behavior of Operating Asset Turnover for U.S. Firms,
1993–2010
12345678910
0.0
1.0
2.0
3.0
4.0
5.0
6.0
7.0
Top Fifth Second Fifth Third Fifth
Fourth Fifth Bottom Fifth
Source: © Cengage Learning 2013
FIGURE A- 4 Behavior of Net Financial Leverage for U.S. Firms,
1993–2010
12345678910
− 1.0
− 0.5
0.0
0.5
1.0
1.5
2.0
2.5
Top Fifth Second Fifth Third Fifth
Fourth Fifth Bottom Fifth
Source: © Cengage Learning 2013
Prospective Analysis: Forecasting 6-21
Copyright 2012 Cengage Learning. All Rights Reserved. May not be copied, scanned, or duplicated, in whole or in part. Due to electronic rights, some third party content may be suppressed from the eBook and/or eChapter(s).
Editorial review has deemed that any suppressed content does not materially affect the overall learning experience. Cengage Learning reserves the right to remove additional content at any time if subsequent rights restrictions require it.

Chapter
7
PROSPECTIVE ANALYSIS:
VALUATION THEORY
AND CONCEPTS
T
he previous chapter introduced forecasting, the first stage of prospective
analysis. In this and the following chapter we describe valuation, the second
and final stage of prospective analysis. This chapter focuses on valuation theory
and concepts, and the following chapter discusses implementation issues.
Valuation is the process of converting forecasts into an estimate of the value of the firm’s
assets or equity. At some level, nearly every business decision involves valuation, at least
implicitly. Within the firm, capital budgeting involves considering how a particular project
will affect firm value. Strategic planning focuses on how value is influenced by larger sets of
actions. Outside the firm, security analysts conduct valuation to support their buy/sell
recommendations, and potential acquirers (often with the assistance of investment
bankers) estimate the value of target firms and the synergies they might offer. Even credit
analysts, who typically do not explicitly estimate firm value, must at least implicitly consider
the value of the firm’sequity“cushion” if they are to maintain a complete view of the risk
associated with lending activity.
In practice, a wide variety of valuation approaches are employed. For example, in
evaluating the fairness of a takeover bid, investment bankers commonly use five to ten
different methods of valuation. Among the available methods are the following:
• Valuation based on price multiples. Under this approach, a current measure of per-
formance or single forecast of performance is converted into value by applying an
appropriate price multiple derived from the value of comparable firms. For exam-
ple, firm value can be estimated by applying a price-to-earnings ratio to a forecast
of the firm’s earnings for the coming year. Other commonly used multiples include
price-to-book ratios and price-to-sales ratios.
• Discounted dividends. This approach expresses the value of the firm’s equity as the
present value of forecasted future dividends.
• Discounted abnormal earnings. Under this approach, the value of the firm’s equity
is expressed as the sum of its current book value and present value of forecasted
abnormal earnings.
• Discounted cash flow (DCF) analysis. This approach involves the production of
detailed, multiple-year forecasts of cash flows. The forecasts are then discounted
at the firm’s estimated cost of capital to arrive at an estimated value.
These methods are developed throughout the chapter, and their pros and cons
discussed. To simplify our discussion, we illustrate valuation for a firm that is exclusively
7-1
Copyright 2012 Cengage Learning. All Rights Reserved. May not be copied, scanned, or duplicated, in whole or in part. Due to electronic rights, some third party content may be suppressed from the eBook and/or eChapter(s).
Editorial review has deemed that any suppressed content does not materially affect the overall learning experience. Cengage Learning reserves the right to remove additional content at any time if subsequent rights restrictions require it.
equity-financed. Chapter 8 discusses valuation implementation challenges, including
valuing firms that are financially leveraged.
VALUATION USING PRICE MUL TIPL ES
Valuations based on price multiples are widely used by analysts. The primary reason for
their popularity is their simplicity. The approach typically involves the following steps:
Step 1: Select a measure of performance or value (e.g., earnings, sales, cash flows,
book equity, book assets) as the basis for the multiple. The two most com-
monly used performance measures are earnings and book equity.
Step 2: For firms that are comparable to the firm analyzed, deflate their stock prices
by their selected performance measure to generate multiples, such as price-
earnings multiples or the price-to-book multiples.
Step 3: Apply the average multiple for the comparable firms to the performance or
value measure of the firm being analyzed.
Under this approach, the analyst relies on the market to undertake the difficult task of
considering the short- and long-term prospects for growth and profitability and their
implications for the values of the comparable firms. Then the analyst assumes that the
pricing of the comparable firms is applicable to the firm at hand.
Key Issues with Multiples-Based Valuation
On the surface, using multiples seems straightforward. Unfortunately, in practice it is not as
simple as it would appear. Identification of “comparable” firms is often quite difficult. There
are also some choices to be made concerning how multiples will be calculated. Finally,
explaining why multiples vary across firms, and how applicable another firm’s multiple is to
the one at hand, requires a sound understanding of the determinants of each multiple.
Sele cting C omparable Firms
Ideally, price multiples used in a comparable firm analysis are those for firms with similar
operating and financial characteristics. Firms within the same industry are the most obvious
candidates. But even within narrowly defined industries, it is often difficult to identify com-
parable firms. Many firms are in multiple industries, making it difficult to identify represen-
tative benchmarks. In addition, firms within the same industry frequently have different
strategies, growth opportunities, and profitability, creating comparability problems.
One way of dealing with these issues is to average across all firms in the industry. The
analyst implicitly hopes that the various sources of non-comparability cancel each other
out, so that the firm being valued is comparable to a “typical” industry member. Another
approach is to focus on only those firms within the industry that are most similar.
For example, consider using multiples to value TJX. Business databases such as
OneSource and Hoover’s classify TJX as belonging to sectors such as retail apparel,
department stores, and family clothing stores. As we discussed in Chapter 2, given its
broad demographic customer base, its competitors include Neiman Marcus, Saks Fifth
Avenue, and Nordstrom on the high end, Sears, Dillards, Macy’s, and J.C. Penney in the
mid-market, and Wal-Mart and Target at the discount level. The average price-earnings
ratio for TJX’s publicly listed competitors in 2010 was 23.7 and the average price-to-book
ratio was 2.1. However, it is unclear whether these multiples are useful benchmarks for
valuing TJX. TJX attracts a broader demographic than the full-line stores of its more
narrowly focused high-end competitors, offers a more targeted value proposition
(high-end merchandise at discount prices) than mid-market players such as Sears and
7-2
PART 2 • Business Analysis and Valuation Tools
Copyright 2012 Cengage Learning. All Rights Reserved. May not be copied, scanned, or duplicated, in whole or in part. Due to electronic rights, some third party content may be suppressed from the eBook and/or eChapter(s).
Editorial review has deemed that any suppressed content does not materially affect the overall learning experience. Cengage Learning reserves the right to remove additional content at any time if subsequent rights restrictions require it.
J.C. Penney, and presents a more specific product offering (apparel and home goods)
than its discount competitors Wal-Mart and Target. In addition, it competes against
specialized apparel and home goods retailers both online and off.
Multiples for Firms with Poor Performance
Price multiples can be affected when the denominator variable is temporarily performing
poorly. This is especially common when the denominator is a flow measure, such as
earnings or cash flows. For example, Sears Holding Corp., one of TJX’s mid-market
competitors, was barely profitable in the fiscal years ended January 2009, 2010, and
2011. Its 2010 price-earnings ratio of 63.9, which was well above the industry average,
indicated that investors expected the company to experience a performance turnaround.
Consequently, including Sears as one of the benchmark firms in computing an industry
price-earnings multiple for TJX would probably be misleading.
Analysts have numerous options for handling the problems for multiples created by tran-
sitory shocks to the denominator. One option is to simply exclude firms with large transitory
effects from the set of comparable firms. If Sears Holding Corp. were excluded from TJX’s
peer group, the average price-earnings ratio for the industry grouping used declines from
23.7 to 17.9, which is much closer to the industry median ratio of 15.0. The magnitude of
this effect illustrates how sensitive price-earnings multiples can be to transitory shocks. If
transitory poor performance is due to a one-time write-down or special item, analysts can
simply exclude the effect from their computation of the comparable multiple. Finally, analysts
can reduce the effect of temporary problems in past performance on multiples by using a
denominator that is a forecast of future performance rather than the past measure itself.
Multiples based on forecasts are termed leading multiples, whereas those based on historical
data are called trailing multiples. Leading multiples are less likely to include one-time gains
and losses in the denominator, simply because such items are difficult to anticipate.
Adju sting Multiples for Levera ge
Price multiples should be calculated in a way that preserves consistency between the
numerator and denominator. Consistency is an issue for those ratios where the denomi-
nator reflects performance before servicing debt. Examples include the price-to-sales
multiple and any multiple of operating earnings or operating cash flows. When calculat-
ing these multiples, the numerator should include not just the market value of equity but
the value of debt as well.
THE DISCO UNTED DIVIDEND VA LUATION METHOD
Finance theory holds that the value of any financial claim is the present value of the cash
payoffs that its claimholders receive. Since shareholders receive cash payoffs from a com-
pany in the form of dividends, the value of their equity is the present value of future
dividends (including any liquidating dividend).
Equity value ¼ PVðExpected future dividendsÞ
The present value concept is used to make it possible to sum up future dividends received
in different time periods. A dollar of dividends received today is worth more than a dollar
received in the future because the dollar received today can be reinvested, enabling the inves-
tor to receive the reinvested dollar plus a return on that investment in the future. For exam-
ple, suppose a dollar received today can be invested to earn an annual return of 10 percent.
After one year, the original dollar is worth $1.10 ($1 þ $1 10%), and after two years it
is worth $1.21 ($1.10 þ $1.10 10%). This process of converting dollars today into future
dollars is called compounding.
Pro spec tive Analysis: Valuation Theory and Concepts 7-3
Copyright 2012 Cengage Learning. All Rights Reserved. May not be copied, scanned, or duplicated, in whole or in part. Due to electronic rights, some third party content may be suppressed from the eBook and/or eChapter(s).
Editorial review has deemed that any suppressed content does not materially affect the overall learning experience. Cengage Learning reserves the right to remove additional content at any time if subsequent rights restrictions require it.
The conversion of future dollars into today’s dollars is called discounting. Using the
above example, $1 received in one year’s time is equivalent to $0.909 today ($1/$1.10).
One dollar received in two years is worth $0.826 ($1/$1.21). Appendix A provides a more
comprehensive review of the present value concept.
To better understand how the discounted dividend approach works, consider the
following simplified example. At the beginning of year 1, Down Under Company raises
$60 million of equity and uses the proceeds to buy a fixed asset. Operating profits before
depreciation (all received in cash) are expected to be $40 million in year 1, $50 million in
year 2, and $60 million in year 3. The firm pays out all operating profits as dividends
and pays no taxes. At the end of year 3, the company terminates and has no remaining
value. If the firm’s shareholders expect to earn a 10 percent return, the value of the
firm’s equity (after the initial equity has been raised and the fixed asset purchased) is
$122.8 million, computed as follows:
Year
Dividend
(1)
PV Factor
(2)
PV of Dividend
(1 2)
........................................................................................................................................
1 $40 m 0.909 $36.4 m
2 50 m 0.826 41.3 m
3 60 m 0.751 45.1 m
........................................................................................................................................
Equity value $122.8 m
.........................................................................................................................................
Of course, in reality firms’ lives are not three years but indefinite. How does the
dividend discount model capture an indefinite stream of future dividends? The typical
way is to assume that after some time the owner sells the stock, generating a terminating
dividend or terminal value. But what would the terminating value of the stock be worth?
Several simplifying assumptions can be used to answer this question and are discussed in
the following chapter.
In summary, the dividend discount model is the basis for most of the popular theo-
retical approaches for stock valuation. It resolves many of the limitations discussed for
multiples. But it also has its own shortcomings, particularly for firms that pay no divi-
dends or very low dividends, where it is difficult to forecast future dividends. We there-
fore turn to modifications of the dividend discount model.
THE DISCO UNTED ABNORMAL EARNINGS VALUATION METHOD
There is a direct link between dividends and earnings. If all equity (other than capital
transactions) flows through the income statement,
1
the ending book value of equity for
existing shareholders is simply the beginning book value plus net income less dividends.
2
This relation can be rewritten as follows:
Dividends ¼ Net Income þ Beginning book equity Ending book equity
By using this identity, we can rewrite the dividend discount formula so that the equity
value is as follows:
3
Equity value ¼ Book equity þ PV ðExpected abnormal earningsÞ
Book equity is simply the latest book value of equity. Abnormal earnings are net income
less a capital charge and are computed as follows:
Abnormal earnings ¼ Net income ðExpected return Beginning book equityÞ
The capital charge recognizes that shareholders have an opportunity cost for the equity
funds invested in the business. At the beginning of a year (or quarter) on a book basis
7-4
PART 2 • Business Analysis and Valuation Tools
Copyright 2012 Cengage Learning. All Rights Reserved. May not be copied, scanned, or duplicated, in whole or in part. Due to electronic rights, some third party content may be suppressed from the eBook and/or eChapter(s).
Editorial review has deemed that any suppressed content does not materially affect the overall learning experience. Cengage Learning reserves the right to remove additional content at any time if subsequent rights restrictions require it.
funds equal to the beginning book equity are invested in the firm on the shareholders’
behalf. They expect to earn a return on this investment, their expected return. Abnormal
earnings arise when the firm is able to produce earnings that exceed this capital charge.
The earnings-based formulation has intuitive appeal. If a firm can earn only the
required rate of return on its book value, then investors should be willing to pay no
more than book value for the stock. Investors should pay more or less than book value
if earnings are above or below this normal level. Thus, the deviation of a firm ’s market
value from book value depends on its ability to generate “abnormal earnings.” The for-
mulation also implies that a firm’s stock value reflects the cost of its existing net assets
(i.e., its book equity) plus the present value of future growth options (represented by
cumulative abnormal earnings).
To illustrate the earnings-based valuation approach, let us return to the Down Under
Company three-year example. Assuming the company depreciates its fixed assets using
the straight-line method, its accounting-based earnings will be $20 million lower than
dividends in each of the three years. Year 1 earnings are therefore expected to be
$20 million (the projected cash inflows/dividends of $40 million net of depreciation).
The capital charge is $6 million, representing investors’ required return of 10 percent
times the book value of assets at the beginning of year 1 ($60 million, the cost of fixed
assets). Consequently, expected abnormal earnings for year 1 are $14 million ($20 mil-
lion less the $6 million capital charge). The firm’ s beginning book equity, earnings, capi-
tal charges, abnormal earnings, and valuation will be as follows:
Year
Expected
Beginning
Book Value
Expected
Earnings
Capital
Charge
Expected
Abnormal
Earnings PV Factor
PV of
Expected
Abnormal
Earnings
....................................................................................................................................................
1 $60 m $20 m $6 m $14 m 0.909 $12.7 m
2 40 m 30 m 4 m 26 m 0.826 21.5 m
3 20 m 40 m 2 m 38 m 0.751 28.6 m
....................................................................................................................................................
Cumulative PV of abnormal earnings 62.8 m
þ Beginning book value 60.0 m
....................................................................................................................................................
¼ Equity value $122.8 m
....................................................................................................................................................
This stock valuation of $122.8 million is identical to the value estimated when the
expected future dividends are discounted directly.
Accounting Methods and Discounted Abnormal Earn ings
One question that arises when valuation is based directly on earnings and book values is
how the estimate is affected by managers’ choice of accounting methods and accrual esti-
mates. Would estimates of value differ for two otherwise identical firms if one used more
conservative accounting methods than the other? We will see that, provided analysts recog-
nize the impact of differences in accounting methods on future earnings (and hence their
earnings forecasts), the accounting effects per se should have no influence on their value
estimates. There are two reasons. First, double-entry bookkeeping is self-correcting. Inflated
earnings for one period ultimately have to be reversed in subsequent periods. Second,
accounting choices that affect a firm’s current earnings also affect its book value, and there-
fore affect the capital charges used to estimate future abnormal earnings. For example, con-
servative accounting lowers a firm’s current earnings and book equity, but also reduces
future capital charges and inflates its future abnormal earnings.
Pro spec tive Analysis: Valuation Theory and Concepts 7-5
Copyright 2012 Cengage Learning. All Rights Reserved. May not be copied, scanned, or duplicated, in whole or in part. Due to electronic rights, some third party content may be suppressed from the eBook and/or eChapter(s).
Editorial review has deemed that any suppressed content does not materially affect the overall learning experience. Cengage Learning reserves the right to remove additional content at any time if subsequent rights restrictions require it.

To see how these two effects undo the effect of differences in accounting methods or
accrual estimates let us return to Down Under Company and see what happens if its man-
agers choose to be conservative and expense some unusual costs that could have been capital-
ized as inventory at year 1. This accounting decision causes earnings and ending book value
to be lower by $10 million. The inventory is then sold in year 2. For the time being, let us say
the accounting choice has no influence on the analyst’s view of the firm’s real performance.
Management’s choice reduces abnormal earnings in year 1 and book value at the begin-
ning of year 2 by $10 million. However, future earnings will be higher, for two reasons. First,
future earnings will be higher by $10 million when the inventory is sold in year 2. Second, the
capital charge for normal earnings in year 2 will be $1 million lower, representing 10 percent
(investors’ required return) times $10 million decline in book value of equity at the beginning
of year 2. The $10 million decline in abnormal earnings in year 1 is therefore perfectly offset
(on a present value basis) by the $11 million higher abnormal earnings in year 2. As a result,
the value of Down Under Company under conservative reporting is identical to the value
under the earlier accounting method ($122.8 million).
Year
Expected
Beginning
Book Value
Expected
Earnings
Expected
Abnormal
Earnings PV Factor
PV of
Expected
Abnormal
Earnings
......................................................................................................................................................
1 $60 m $10 m $4 m 0.909 $3.6 m
2 30 m 40 m 37 m 0.826 30.6 m
3 20 m 40 m 38 m 0.751 28.6 m
......................................................................................................................................................
Cumulative PV of abnormal earnings 62.8 m
þ Beginning book value 60.0 m
......................................................................................................................................................
¼ Equity value $122.8 m
......................................................................................................................................................
Provided the analyst is aware of biases in accounting data that arise from managers’
using aggressive or conservative accounting choices, abnormal earnings-based valuations
are unaffected by variation in accounting decisions. This shows that strategic and
accounting analyses are critical precursors to abnormal earnings valuation. The strategic
and accounting analysis tools help the analyst to identify whether abnormal earnings
arise from sustainable competitive advantage or from unsustainable accounting manipu-
lations. For example, consider the implications of failing to understand the reasons for a
decline in earnings from a change in inventory policy for Down Under Company. If an
analyst mistakenly interpreted the decline as indicating that the firm was having diffi-
culty moving its inventory, rather than that it had used conservative accounting, the ana-
lyst might reduce expectations of future earnings. The estimated value of the firm would
then be lower than that reported in our example.
Key Analysis Questions
Valuation of equity under the discounted abnormal earnings method requires the
analyst to answer the following questions:
• Is the firm reporting using conservative or aggressive accounting that will be
reversed in subsequent years, and which should be reflected in the analyst’s
forecasts of net income and book equity?
• What are expected future net income, book values of equity, and therefore
abnormal earnings over a finite forecast horizon (usually 5 to 10 years) given
7-6
PART 2 • Business Analysis and Valuation Tools
Copyright 2012 Cengage Learning. All Rights Reserved. May not be copied, scanned, or duplicated, in whole or in part. Due to electronic rights, some third party content may be suppressed from the eBook and/or eChapter(s).
Editorial review has deemed that any suppressed content does not materially affect the overall learning experience. Cengage Learning reserves the right to remove additional content at any time if subsequent rights restrictions require it.

the firm’s industry competitiveness, the firm’s positioning, and its accounting
conservatism?
• What is expected future abnormal net income beyond the final year of the
forecast horizon (called the “terminal year”) based on some simplifying
assumption? If abnormal returns are expected to persist, what are the barriers
to entry that deter competition?
• What is the firm’s cost of equity used to compute the present value of abnor-
mal earnings?
REVISITING PR ICE MULTIP LE VALUATIONS
As noted earlier in this chapter, despite their relative simplicity and popularity, valuation
multiples are difficult to implement given wide differences in multiples even for firms
that are in the same industry. The abnormal earnings valuation method provides insight
into factors that lead to differences in the leading multiples, value-to-book and value-
to-earnings, across firms.
Value-to-Book Equity Multiple
If the abnormal earnings valuation formula is scaled by book value, the left-hand
side becomes the equity value-to-book ratio as opposed to the equity value itself. The
right-hand side variables can be rearranged to reflect three multiple drivers (i) expected
future earnings deflated by beginning book value, or our old friend return on equity
(ROE), discussed in Chapter 5; (ii) the expected growth in equity book value over time;
and (iii) the return required by equity investors. The actual valuation formula is as
follows:
Equity value
Book equity
¼ 1 þ PVðExpected abnormal ROE
Expected beginning book equity growthÞ
Abnormal ROE is the firm’s ROE less the return required by equity investors. As
discussed in financial analysis (Chapter 5), ROEs can be expressed as the product of
three components (profit margins, sales turnover, and leverage). The ROE projections
used to compute the equity value-to-book ratio, therefore, reflect these same
components.
Firms with positive abnormal ROEs are able to invest their net assets to create value
for shareholders and will have equity value-to-book ratios greater than one. In contrast,
firms with negative abnormal ROEs are unable to invest shareholder funds at a rate
greater than shareholders’ required return and have ratios below one.
The magnitude of a firm’s value-to-book multiple also depends on its expected book
equity growth, defined as forecasted beginning book equity deflated by the current book
equity. Firms can grow their equity base by issuing new equity or by reinvesting profits.
If this new equity is invested in positive valued projects for shareholders, that is, projects
with ROEs that exceed the cost of capital, the firm will boost its equity value-to-book
multiple. Conversely, for firms with ROEs that are less than the cost of capital, equity
growth further lowers the multiple.
Pro spec tive Analysis: Valuation Theory and Concepts 7-7
Copyright 2012 Cengage Learning. All Rights Reserved. May not be copied, scanned, or duplicated, in whole or in part. Due to electronic rights, some third party content may be suppressed from the eBook and/or eChapter(s).
Editorial review has deemed that any suppressed content does not materially affect the overall learning experience. Cengage Learning reserves the right to remove additional content at any time if subsequent rights restrictions require it.

The valuation task can now be framed in terms of two key questions about the firm’s
“value drivers”:
• Will the firm be able to generate ROEs that exceed its shareholders’ required
return, and if so, for how long?
• How quickly will the firm’s investment base (book value) grow?
Returning to the three-year Down Under Company example, the implied equity
value-to-book multiple can be estimated as follows:
Year 1 Year 2 Year 3
....................................................................................................................................................
Beginning book value $60 m $40 m $20 m
Earnings $20 m $30 m $40 m
....................................................................................................................................................
ROE 0.33 0.75 2.00
Cost of capital 0.10 0.10 0.10
....................................................................................................................................................
¼ Abnormal ROE 0.23 0.65 1.90
(Beg. Book equity growth) 1.00 0.67 0.33
....................................................................................................................................................
¼ Abnormal ROE scaled by book value growth 0.23 0.43 0.63
PV factor 0.909 0.826 0.751
....................................................................................................................................................
¼ PV of abnormal ROE scaled by book value growth 0.212 0.358 0.476
....................................................................................................................................................
Cumulative PV of abnormal ROE scaled by book
value growth
1.046
þ 1.00 1.000
¼ Equity value-to-book multiple 2.046
....................................................................................................................................................
There are several points to note from these calculations. First, ROE is earnings deflated
by beginning, not ending or average equity. Year 1 ROE is therefore 33 percent, computed
as earnings of $20 million deflated by beginning book value of $60 million. The ROE
grows over time, reflecting increasing earnings and declining beginning book equity. Sec-
ond, beginning book equity growth is forecasted beginning book equity deflated by current
book equity. For Down Under, the current book equity and beginning book equity for year
1 are both $60 million, implying that the year 1 growth multiple is 1. Year 2 beginning
book equity is $40 million, 67 percent of the current $60 million. And in year 3, it is $20
million, 33 percent of current book equity. The decline in beginning book equity growth
over time reflects the finite life of the project. Finally, the equity value-to-book multiple for
Down Under of 2.046 implies that the stock value is $122.8 (current book equity of $60
times 2.046), once again identical to the dividend discount model value.
Value-to-Earnings Mult iple
The equity value-to-book formulation can also be used to construct the equity value-
earnings multiple as follows:
Equity value-to-earnings
multiple
¼
Equity value-to-book
multiple
Book value of equity
Earnings
¼
Equity value-to-book multiple
ROE
In other words, the same factors that drive a firm’s equity value-to-book multiple
also explain its equity value-earnin gs multiple. The key difference between the two
7-8
PART 2 • Business Analysis and Valuation Tools
Copyright 2012 Cengage Learning. All Rights Reserved. May not be copied, scanned, or duplicated, in whole or in part. Due to electronic rights, some third party content may be suppressed from the eBook and/or eChapter(s).
Editorial review has deemed that any suppressed content does not materially affect the overall learning experience. Cengage Learning reserves the right to remove additional content at any time if subsequent rights restrictions require it.

multiples is that the value-earnings multiple is affected by the firm’s current level of
ROE performance, whereas the value-to-book multiple is not. Firms that have low
current ROEs relative to investor expectations reflec ted in the equity value-to-book
multiple, that is firms predicted to have strong i ncreases in ROE, will have very high
value-earnings multiples and vice versa. If a firm has a zero or n egative ROE, its PE
multiple is not defined. Value-earnings multiples are therefore more volatile than
value-to-book multiples.
The following data for a subset of firms in the retail apparel/department store indus-
try illustrate the relation among return on beginning equity (ROE), book equity growth,
the price-to-book ratio, and the price-earnings ratio:
Company ROE
Book Equity
Growth
Price-to-Book
Ratio
Price-Earnings
Ratio
..................................................................................................................................................
TJX Companies, Inc. 46.5% 10.5% 6.0 14.5
Nordstrom, Inc. 39.0% 28.6% 4.4 14.9
Sears Holding Corp. 1.5% 1.2% 1.0 63.9
Target Corp. 19.0% 6.3% 2.5 13.6
..................................................................................................................................................
TJX and Nordstrom have high price-to-book multiples, both relative to their peers
and to other listed U.S. firms, implying that investors expect the two firms will continue
to generate ROEs that exceed their required return and to show strong growth. Target
has a respectable price-to-book multiple that exceeds one, indicating that it is also
expected to continue to generate positive abnormal ROEs and growth, albeit lower than
for TJX and Nordstrom. The comparable price-earnings ratios for the three firms imply
that investors do not anticipate any major differences in their future ROE growth relative
to current ROE.
In contrast, Sears has by far the lowest price-to-book multiple. Its value of one indi-
cates that investors expect it to generate future ROEs that just meet their required return.
Sears’ very high price-to-earnings multiple of 63.9 implies that investors expect that the
current ROE of 1.5 percent (certainly lower than the required return) will likely increase
in the future to match their required return.
Key Analysis Questions
To value a firm using multiples, an analyst has to assess the quality of the variable
used as the multiple basis, and to determine the appropriate peer firms to include in
the benchmark multiple. Analysts are therefore likely to be interested in answering
the following questions:
• How well does the denominator used in the multiple reflect the firm’s perfor-
mance? For example, if earnings or book equity are used as the denominator,
has the firm made conservative or aggressive accounting choices that affect
these variables and that are likely to unwind in the coming years? Is the firm
likely to show strong growth in earnings or book equity? If earnings are the
denominator, does the firm have temporarily poor or strong performance?
• What is the sustainability of the firm’s growth and ROE based on the compet-
itive dynamics of its industry and product market and its own competitive
position?
Pro spec tive Analysis: Valuation Theory and Concepts 7-9
Copyright 2012 Cengage Learning. All Rights Reserved. May not be copied, scanned, or duplicated, in whole or in part. Due to electronic rights, some third party content may be suppressed from the eBook and/or eChapter(s).
Editorial review has deemed that any suppressed content does not materially affect the overall learning experience. Cengage Learning reserves the right to remove additional content at any time if subsequent rights restrictions require it.

• Which are the most suitable peer companies to include in the benchmark
multiple computation? Have these firms had comparable growth (earnings or
book values), profitability, and quality of earnings to the firm being analyzed?
Do they have the same risk characteristics?
SHORTCUT FORM S OF EARNINGS-BA SED VALUATION
The discounted abnormal earnings valuation formula can be simplified by making
assumptions about the relation between a firm’s current and future abnormal earnings.
Similarly, the equity value-to-book formula can be simplified by making assumptions
about long-term ROEs and growth.
Abnormal Earnings Simplification
Several assumptions about the relation between current and future net income are popu-
lar for simplifying the abnormal earnings model. First, abnormal earnings can be
assumed to follow what is known as a random walk. This implies that an analyst’s best
guess about future expected abnormal earnings are current abnormal earnings. The
model assumes that past shocks to abnormal earnings continue forever, but that future
shocks are random or unpredictable. The random walk model can be written as follows:
Forecasted abnormal earnings ¼ Current abnormal earnings
Under the model, the best guess of abnormal earnings in any future year is just current
abnormal earnings. It is also possible to include a drift term in the model, allowing abnor-
mal earnings to grow or decline by a constant amount, or at a constant rate in each period.
How does the above assumption about future abnormal earnings simplify the discounted
abnormal earnings valuation model? If abnormal earnings follow a random walk, all future
forecasts of abnormal earnings are simply current abnormal earnings. Consequently, the
present value of future abnormal earnings can be calculated by valuing the current level of
abnormal earnings as a perpetuity. It is then possible to rewrite value as follows:
Equity value ¼ Book equity þ
Current abnormal earnings
Expected return
The equity value is the current book value of equity plus current abnormal earnings
divided by the expected return for equity investors. The perpetuity formula can be
adjusted to incorporate expectations of constant growth in future abnormal earnings.
In reality, of course, shocks to abnormal earnings are unlikely to persist forever. Firms
that have positive shocks are likely to attract competitors that will reduce opportunities
for future abnormal performance. Firms with negative abnormal earnings shocks are
likely to fail or to be acquired by other firms that can manage their resources more effec-
tively. The persistence of abnormal performance will therefore depend on strategic fac-
tors such as barriers to entry and switching costs, discussed in Chapter 2. To reflect this,
analysts frequently assume that current shocks to abnormal earnings decay over time.
Under this assumption, abnormal earnings are said to follow an autoregressive model.
Forecasted abnormal earnings are then:
Forecasted abnormal earnings ¼ Current abnormal earnings
β is a parameter that captures the speed with which abnormal earnings decay over time.
If there is no decay, β is one and abnormal earnings follow a random walk. If β is zero,
abnormal earnings decay completely within one year. Estimates of β using actual
7-10
PART 2 • Business Analysis and Valuation Tools
Copyright 2012 Cengage Learning. All Rights Reserved. May not be copied, scanned, or duplicated, in whole or in part. Due to electronic rights, some third party content may be suppressed from the eBook and/or eChapter(s).
Editorial review has deemed that any suppressed content does not materially affect the overall learning experience. Cengage Learning reserves the right to remove additional content at any time if subsequent rights restrictions require it.

company data indicate that for a typical U.S. firm, β is approximately 0.6, implying that
on average abnormal ROEs decline by around 40 percent per year. However, the rate of
decline varies by industry and is smaller for firms with large accruals and one-time
accounting charges.
4
The autoregressive model implies that stock values can again be written as a function
of current abnormal earnings and book values:
5
Equity value ¼ Book equity þ
Current abnormal earnings
Expected return ð1 Þ
This formulation implies that stock values are simply the sum of current book value plus
current abnormal earnings weighted by the cost of equity capital and persistence in
abnormal earnings.
ROE and Growth Simplifications
It is also possible to make simplifications about long-term ROEs and equity growth to
reduce forecast horizons for estimating the equity value-to-book multiple. Firms’ long-
term ROEs are affected by such factors as barriers to entry in their industries, change
in production or delivery technologies, and quality of management. As discussed in
Chapter 6, these factors tend to force abnormal ROEs to decay over time. One way to
model this decay is to assume that ROEs revert to the mean. Forecasted ROE after one
period then takes the following form:
Forecast ROE ¼ Current ROE þ ðCurrent ROE Steady State ROEÞ
Steady state ROE could either be the firm’s required return for equity investors or its
long-term industry ROE. β is a “speed of adjustment factor” that reflects how quickly it
takes the ROE to revert to its steady state.
6
Growth rates in the book value of equity are driven by several factors. First, the size
of the f irm is important. Small firms can sustain very high growth rates for an
extended period, whereas large firms find it more difficult to do so. Second, firms
with high rates of growth are likely to attract competitors, which reduces their growth
rates. As a result, steady-state rates of growth in book equity are likely to be similar
to rates of growth in the overall economy, which in the United States have averaged
3 to 4 percent per year.
The long-term patterns in ROE and book equity growth rates imply that for most
companies there is limited value in making forecasts for valuation beyond a relatively
short horizon, generally five to ten years. Powerful economic forces tend to lead firms
with superior or inferior performance early in the forecast horizon to revert to a level
that is comparable to that of other firms in the industry or the economy. For a firm in
steady state, that is, expected to have a stable ROE and book equity growth rate, the
value-to-book multiple formula simplifies to the following:
Equity value
Book equity
¼ 1 þ
Expected ROE Required return
Required return book growth
Consistent with this simplified model, there is a strong relationship between price-
to-book ratios and current ROEs. Figure 7-1 shows the relation between these variables
for firms in the retail apparel/department store industry we discussed earlier. The corre-
lation between the two variables is 0.97.
Of course, analysts can make a variety of simplifying assumptions about a firm’s ROE
and growth. For example, they can assume that they decay slowly or rapidly to the cost
of capital and the growth rate for the economy. They can assume that the rates decay to
Prospective Analysis: Valuation Theory and Concepts 7-11
Copyright 2012 Cengage Learning. All Rights Reserved. May not be copied, scanned, or duplicated, in whole or in part. Due to electronic rights, some third party content may be suppressed from the eBook and/or eChapter(s).
Editorial review has deemed that any suppressed content does not materially affect the overall learning experience. Cengage Learning reserves the right to remove additional content at any time if subsequent rights restrictions require it.
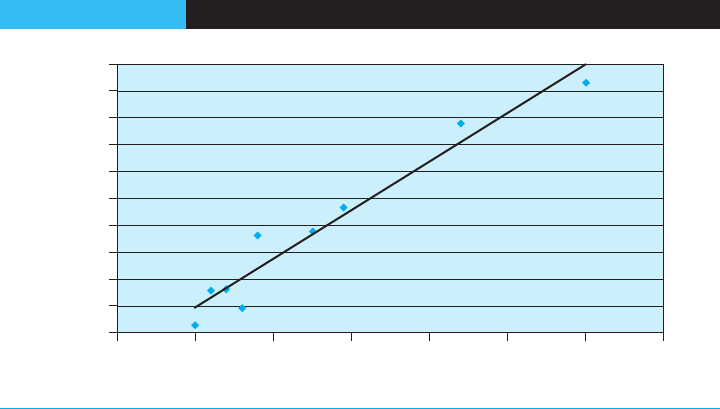
the industry or economy average ROEs and book value growth rates. The valuation for-
mula can easily be modified to accommodate these assumptions.
THE DISCO UNTED CASH FLOW MODEL
The final valuation method discussed here is the discounted cash flow approach. This is
the valuation method taught in most finance classes. Like the abnormal earnings
approach, it is derived from the dividend discount model. It is based on the insight that
dividends can be recast as free cash flows:
7
Dividends ¼ Operating cash flow Capital outlays þ Net cash flows from debt owners
As discussed in Chapter 5, operating cash flows to equity holders are simply net
income plus depreciation less changes in working capital accruals. Capital outlays are
capital expenditures less asset sales. Finally, net cash flows from debt owners are issues
of new debt less retirements less the after-tax cost of interest.
8
The dividend discount model can therefore be written as the present value of free cash
flows to equity. Under this formulation, value to shareholders is estimated as follows:
Equity value ¼ PVðExpected free cash flows to equity Þ
Valuation under the discounted cash flow method therefore involves the following
steps:
Step 1: Forecast free cash flows available to equity holders over a finite forecast hori-
zon (usually 5 to 10 years),
Step 2: Forecast free cash flows beyond the terminal year based on some simplifying
assumption, and
Step 3: Discount free cash flows to equity holders at the cost of equity. The discounted
amount represents the estimated value of free cash flows available to equity.
Returning to the Down Under Company example, there is no debt, so that the free
cash flows to owners are simply the operating profits before depreciation. Since the
FIGURE 7-1 Relationship between ROE and Price-to-Book Multiples
50%
45%
40%
35%
30%
25%
20%
15%
10%
5%
0%
01234
Price-to-Book Ratio
ROE
567
Source: © Cengage Learning 2013
7-12 PART 2 • Business Analysis and Valuation Tools
Copyright 2012 Cengage Learning. All Rights Reserved. May not be copied, scanned, or duplicated, in whole or in part. Due to electronic rights, some third party content may be suppressed from the eBook and/or eChapter(s).
Editorial review has deemed that any suppressed content does not materially affect the overall learning experience. Cengage Learning reserves the right to remove additional content at any time if subsequent rights restrictions require it.
company’s required return for shareholders is assumed to be 10 percent, the present
value of the free cash flows is calculated as follows:
Year
Expected Free
Cash Flows PV Factor
PV of Expected
Free Cash Flows
........................................................................................................................................
1 $40 m 0.909 $36.4 m
2 50 m 0.826 41.3 m
3 60 m 0.751 45.1 m
........................................................................................................................................
Equity value $122.8 m
.........................................................................................................................................
Notice that the value of Down Under’s equity is exactly the same as that estimated
using the discounted abnormal earnings method. This should not be surprising. Both
methods are derived from the dividend discount model. And in estimating value under
the two approaches, we have used the same underlying assumptions to forecast earnings
and cash flows.
COMPARING VALUATION METHODS
We have discussed three methods of valuation derived from the dividend discount model:
discounted dividends, discounted abnormal earnings (or abnormal ROEs), and discounted
cash flows. Since the methods are all derived from the same underlying model, no one ver-
sion can be considered superior to the others. As long as analysts make the same assump-
tions about firm fundamentals, value estimates under all three methods will be identical.
However, there are important differences between the models that are discussed below:
Differences in Focus
The methods frame the valuation task differently and can in practice focus the analyst’s
attention on different issues. The earnings-based approaches frame the issues in terms of
accounting data such as earnings and book values rather than cash flows. Analysts spend
considerable time analyzing historical income statements and balance sheets, and their
primary forecasts are typically for these accounting variables.
Defining values in terms of ROEs has the advantage that it focuses analysts’ attention
on ROE, the same key measure of performance that is decomposed in a standard finan-
cial analysis. Furthermore, because ROEs control for firm scale, it is likely to be easier for
analysts to evaluate the reasonableness of their forecasts by benchmarking them with
ROEs of other firms in the industry and the economy. This type of benchmarking is
more challenging for free cash flows and abnormal earnings.
Differences in Required Structure
The methods differ in the amount of analysis and structure required for valuation. The
discounted abnormal earnings and ROE methods require analysts to construct both pro
forma income statements and balance sheets to forecast future earnings and book values.
In contrast, the discounted cash flow method requires analysts to forecast income state-
ments and changes in working capital and long-term assets to generate free cash flows.
Finally, the discounted dividend method requires analysts to forecast dividends.
The discounted abnormal earnings, ROE, and free cash flow models all require more
structure for analysis than the discounted dividend approach. They therefore help ana-
lysts avoid structural inconsistencies in their forecasts of future dividends by specifically
requiring a prediction of firms’ future performance and investment opportunities.
Prospective Analysis: Valuation Theory and Concepts 7-13
Copyright 2012 Cengage Learning. All Rights Reserved. May not be copied, scanned, or duplicated, in whole or in part. Due to electronic rights, some third party content may be suppressed from the eBook and/or eChapter(s).
Editorial review has deemed that any suppressed content does not materially affect the overall learning experience. Cengage Learning reserves the right to remove additional content at any time if subsequent rights restrictions require it.
Similarly, the discounted abnormal earnings/ROE method requires more structure and
work than the discounted cash flow method to build full pro forma balance sheets. This
permits analysts to avoid inconsistencies in the firm’s financial structure.
Differences in Terminal Value Imp lications
A third difference between the methods is in the effort required for estimating terminal
values. Terminal value estimates for the abnormal earnings and ROE methods tend to
represent a much smaller fraction of total value than under the discounted cash flow or
dividend methods. On the surface, this would appear to mitigate concerns about the
aspect of valuation that leaves the analyst most uncomfortable. Is this apparent advan-
tage real? As explained below, the answer turns on how well value is already reflected
in the accountant’s book value.
The abnormal earnings valuation does not eliminate the discounted cash flow termi-
nal value problem, but it does reframe it. Discounted cash flow terminal values include
the present value of all expected cash flows beyond the forecast horizon. Under abnor-
mal earnings valuation, that value is broken into two parts: the present values of normal
earnings and abnormal earnings beyond the terminal year. The terminal value in the
abnormal earnings technique includes only the abnormal earnings. The present value of
normal earnings is already reflected in the original book value.
The abnormal earnings approach, then, recognizes that current book value and earn-
ings over the forecast horizon already reflect many of the cash flows expected to arrive
after the forecast horizon. The approach builds directly on accrual accounting. For exam-
ple, under accrual accounting book equity can be thought of as the minimum recover-
able future benefits attributable to the firm’s net assets. In addition, revenues are
typically realized when earned, not when cash is received. The discounted cash flow
approach, on the other hand, “unravels” all of the accruals, spreads the resulting cash
flows over longer horizons, and then reconstructs its own “accruals” in the form of dis-
counted expectations of future cash flows. The essential difference between the two
approaches is that abnormal earnings valuation recognizes that the accrual process may
already have performed a portion of the valuation task, whereas the discounted cash flow
approach ultimately moves back to the primitive cash flows underlying the accruals.
The usefulness of the acc ountin g-based pe rspective thus hinges on how well the
accrual process reflects future cash flows. The approach is most convenient whe n the
accrual process is “unbiased,” so that earnings can be abnormal only as the result of
economic rents and not as a product of accounting itself.
9
The forecast horizon then
extendstothepointwherethefirmisexpected to approach a competitive equilibrium
and earn only normal earnings on its projects. Subsequent abnormal earnings would
be zero, and the terminal value at that point would be zero. In this case, all of the
firm’s value is reflected in the book value and earnings projected over the forecast
horizon.
Of course, accounting rarely works so well. For example, in most countries research and
development costs are expensed, and book values fail to reflect any research and develop-
ment assets. As a result, firms that spend heavily on research and development—such as
pharmaceutical companies—tend on average to generate abnormally high earnings even in
the face of stiff competition. Purely as an artifact of research and development accounting,
abnormal earnings would be expected to remain positive indefinitely for such firms, and
the terminal value could represent a substantial fraction of total value.
If desired, the analyst can alter the accounting approach used by the firm in his or her
own projections. “Better” accounting would be viewed as that which reflects a larger frac-
tion of the firm’s value in book values and earnings over the forecast horizon.
10
This
7-14
PART 2 • Business Analysis and Valuation Tools
Copyright 2012 Cengage Learning. All Rights Reserved. May not be copied, scanned, or duplicated, in whole or in part. Due to electronic rights, some third party content may be suppressed from the eBook and/or eChapter(s).
Editorial review has deemed that any suppressed content does not materially affect the overall learning experience. Cengage Learning reserves the right to remove additional content at any time if subsequent rights restrictions require it.

same view underlies analysts’ attempts to “normalize” earnings; the adjusted numbers are
intended to provide better indications of value, even though they reflect performance
only over a short horizon.
Recent research has focused on the performance of earnings-based valuation relative
to discounted cash flow and discounted dividend methods. The findings indicate that
over relatively short forecast horizons, ten years or less, valuation estimates using the
abnormal earnings approach generate more precise estimates of value than either the dis-
counted dividend or discounted cash flow models. This advantage for the earnings-based
approach persists for firms with conservative or aggressive accounting, indicating that
accrual accounting in the United States does a reasonably good job of reflecting future
cash flows.
11
Research also indicates that abnormal earnings estimates of value outperform traditional
multiples, such as price-earnings ratios, price-to-book ratios, and dividend yields, for predict-
ing future stock movements.
12
Firms with high abnormal earnings model estimates of value
relative to current price show positive abnormal future stock returns, whereas firms with low
estimated value-to-price ratios have negative abnormal stock performance.
Key Analysis Questions
The above discussion on the trade-offs between different methods of valuing a com-
pany raises several questions for analysts about how to compare methods and to
consider which is likely to be most reliable for their analysis:
• What are the key performance parameters that the analyst forecasts? Is more
attention given to forecasting accounting variables, such as earnings and book
values, or to forecasting cash flow variables?
• Has the analyst linked forecasted income statements and balance sheets? If
not, is there any inconsistency between the two statements, or in the implica-
tions of the assumptions for future performance? If so, what is the source of
this inconsistency and does it affect discounted earnings-based and discounted
cash flow methods similarly?
• How well does the firm’s accounting capture its underlying assets and obliga-
tions? Does it do a good enough job that we can rely on book values as the
basis for long-term forecasts? Alternatively, does the firm rely heavily on off-
balance-sheet assets, such as R&D, which make book values a poor lower
bound on long-term performance?
• Has the analyst made very different assumptions about long-term perfor-
mance in the terminal value computations under the different valuation meth-
ods? If so, which set of assumptions is more plausible given the firm’s
industry and its competitive positioning?
SUMMARY
Valuation is the process by which forecasts of performance are converted into estimates
of price. A variety of valuation techniques are employed in practice, and there is no sin-
gle method that clearly dominates others. In fact, since each technique involves different
advantages and disadvantages, there are gains to considering several approaches
simultaneously.
Prospective Analysis: Valuation Theory and Concepts 7-15
Copyright 2012 Cengage Learning. All Rights Reserved. May not be copied, scanned, or duplicated, in whole or in part. Due to electronic rights, some third party content may be suppressed from the eBook and/or eChapter(s).
Editorial review has deemed that any suppressed content does not materially affect the overall learning experience. Cengage Learning reserves the right to remove additional content at any time if subsequent rights restrictions require it.

For shareholders, a stock’s value is the present value of future dividends. This chapter
described three valuation techniques directly based on this dividend discount definition
of value: discounted dividends, discounted abnormal earnings/ROEs, and discounted free
cash flows. The discounted dividend method attempts to forecast dividends directly. The
abnormal earnings approach expresses the value of a firm’s equity as book value plus
discounted expectations of future abnormal earnings. Finally, the discounted cash flow
method represents a firm’s stock value by expected future free cash flows discounted at
the cost of capital.
Although these three methods were derived from the same dividend discount model,
they frame the valuation task differently. In practice they focus the analyst’s attention on
different issues and require different levels of structure in developing forecasts of the
underlying primitive, future dividends.
Price multiple valuation methods were also discussed. Under these approaches, ana-
lysts estimate ratios of current price to historical or forecasted measures of performance
for comparable firms. The benchmarks are then used to value the performance of the
firm being analyzed. Multiples have traditionally been popular, primarily because they
do not require analysts to make multiyear forecasts of performance. However, it can be
difficult to identify comparable firms to use as benchmarks. Even across highly related
firms, there are differences in performance that are likely to affect their multiples.
The chapter discussed the relation between two popular multiples, value-to-book and
value-earnings ratios, and the discounted abnormal earnings valuation. The resulting for-
mulations indicate that value-to-book multiples are a function of future abnormal ROEs,
book value growth, and the firm’s cost of equity. The value-earnings multiple is a func-
tion of the same factors and also the current ROE.
DISCUSSION QUESTI ONS
1. Joe Watts, an analyst at EMH Securities, states: “I don’t know why anyone would
ever try to value earnings. Obviously, the market knows that earnings can be manip-
ulated and therefore it only values cash flows.” Discuss.
2. Explain why terminal values in accounting-based valuation are significantly less than
those for DCF valuation.
3. Manufactured Earnings is a “darling” of Wall Street analysts. Its current market
price is $15 per share, and its book value is $5 per share. Analysts forecast that the
firm’s book value will grow by 10 percent per year indefinitely, and the cost of
equity is 15 percent. Given these facts, what is the market’s expectation of the firm’s
long-term average ROE?
4. Given the information in question 3, what will be Manufactured Earnings’
stock price if the market revises its expectations of long-term average ROE to
20 percent?
5. Analysts reassess Manufactured Earnings’ future performance as follows: growth in
book value increases to 12 percent per year, but the ROE of the incremental book
value is only 15 percent. What is the impact on the market-to-book ratio?
6. How can a company with a high ROE have a low PE ratio?
7. What types of companies have
• a high PE and a low market-to-book ratio?
• a high PE ratio and a high market-to-book ratio?
• a low PE and a high market-to-book ratio?
• a low PE and a low market-to-book ratio?
7-16
PART 2 • Business Analysis and Valuation Tools
Copyright 2012 Cengage Learning. All Rights Reserved. May not be copied, scanned, or duplicated, in whole or in part. Due to electronic rights, some third party content may be suppressed from the eBook and/or eChapter(s).
Editorial review has deemed that any suppressed content does not materially affect the overall learning experience. Cengage Learning reserves the right to remove additional content at any time if subsequent rights restrictions require it.

8. Free cash flows (FCF) used in DCF valuations discussed in the chapter are defined
as follows:
FCF to debt and equity ¼ Earnings before interest and taxes ð1 tax rateÞ
þ Depreciation and deferred taxes Capital
expenditures =þ Increase=decrease in working capital
FCF to equity ¼ Net income þ Depreciation and deferred taxes
Capital expenditures =þ Increase=decrease in working
capital þ= Increase=decrease in debt
Which of the following items affect free cash flows to debt and equity holders?
Which affect free cash flows to equity alone? Explain why and how.
• An increase in accounts receivable
• A decrease in gross margins
• An increase in property, plant, and equipment
• An increase in inventory
• Interest expense
• An increase in prepaid expenses
• An increase in notes payable to the bank
9. Starite Company is valued at $20 per share. Analysts expect that it will generate free
cash flows to equity of $4 per share for the foreseeable future. What is the firm’s
implied cost of equity capital?
10. Janet Stringer argues that “the DCF valuation method has increased managers’ focus
on short-term rather than long-term performance, since the discounting process
places much heavier weight on short-term cash flows than long-term ones.”
Comment.
NOTES
1. The incorporation of all non-capital equity transactions into income is called clean
surplus accounting. It is analogous to comprehensive income, the concept defined in
FAS 130.
2. Changes in book value also include new capital contributions. However, the divi-
dend discount model assumes that new capital is issued at fair value. As a result,
any incremental book value from capital issues is exactly offset by the discounted
value of future dividends to new shareholders. Capital transactions, therefore, do
not affect firm valuation.
3. Appendix C to this chapter provides a simple proof of the earnings-based valuation
formula.
4. See P. M. Dechow, A. P. Hutton, and R. G. Sloan, “An empirical assessment of the resid-
ual income valuation model,” Journal of Accounting and Economics 23, January 1999.
5. This formulation is a variant of a model proposed by J. Ohlson, “Earnings, book
values, and dividends in security valuation,” Contemporary Accounting Research
11, Spring 1995. Ohlson includes in his forecasts of future abnormal earnings a
variable that reflects relevant i nformation other than current abnormal earnings.
This variable then also appears i n the stock valuation formula. Empirical research
by Dechow, Hutton, and Sloan, “An empirical assessment of the residual income
valuation mod el,” Journal of Accounting and Economics 23, January 1999, indi-
cates that financial analysts’ forecasts of abnormal earnings do reflect
Prospective Analysis: Valuation Theory and Concepts 7-17
Copyright 2012 Cengage Learning. All Rights Reserved. May not be copied, scanned, or duplicated, in whole or in part. Due to electronic rights, some third party content may be suppressed from the eBook and/or eChapter(s).
Editorial review has deemed that any suppressed content does not materially affect the overall learning experience. Cengage Learning reserves the right to remove additional content at any time if subsequent rights restrictions require it.

considerable information other than current abnormal earnings, and that this
information is useful for valuation.
6. This specification is similar to the model for dividends developed by J. Lintner, “ Dis-
tribution of incomes of corporations among dividends, retained earnings, and taxes,”
American Economic Review 46 (May 1956): 97–113.
7. In practice, firms do not have to pay out all of their free cash flows as dividends;
they can retain surplus cash in the business. The conditions under which a firm’s
dividend decision affects its value are discussed by M. H. Miller and F. Modigliani
in “Dividend Policy, Growth and the Valuation of Shares,” Journal of Business 34
(October 1961): 411–33.
8. Most finance texts implement the discounted cash flow model using cash flows
attributable to all the firm’s investors, both debt and equity. This generates the
value of the firm’s assets rather than the value of its equity. However, the value of
the equity can easily be computed using this approach by deducting the value of the
outstanding debt from the estimated value of the assets. Indeed, all of the valuation
approaches discussed in this chapter can be structured to estimate the value of a
firm’s assets rather than its equity. Further discussion of these methods is shown in
Appendix D.
9. Unbiased accounting is that which, in a competitive equilibrium, p roduces an
expected ROE equal to the cost of capital. The actual ROE thus r eveals the pres -
ence of economic rents. Market-value accounting is a special case of unbiased
accounting that produces an e xpected ROE equal to the cost of capital, even
when the firm i s not in a competitive equilibrium. That is, market-value account-
ing reflects the present value of future economic rents in book value, driving the
expected ROEs to a normal level. For a discussion of unbiased and biased account-
ing, see G. Feltham and J. Ohlson, “Valuation and Clean Surplus Accounting for
Operating and Financial Activities,” Contemporary Accounting Research 11, No. 2
(Spring 1995): 689–731.
10. In Bennett Stewart’s book on EVA valuation, The Quest for Value (New York:
Harper Business, 1999), he recommends a number of accounting adjustments,
including the capitalization of research and development.
11. S. Penman and T. Sougiannis, “A Comparison of Dividend, Cash Flow, and Earn-
ings Approaches to Equity Valuation,” Contemporary Accounting Research (Fall
1998): 343–83, compares the valuation methods using actual realizations of earnings,
cash flows, and dividends to estimate prices. J. Francis, P. Olsson, and D. Oswald,
“Comparing Accuracy and Explainability of Dividend, Free Cash Flow and Abnor-
mal Earnings Equity Valuation Models,” Journal of Accounting Research 38 (Spring
2000): 45–70, estimates values using Value Line forecasts.
12. See C. Lee, J. Myers, and B. Swaminathan, “What is the Intrinsic Value of the Dow?”
Journal of Finance (October 1999): 1693–1741.
APPENDIX A Time Value of Money: Present and Future Values
The notion that $1 today is worth more than $1 received in one year is fundamental to
finance. You may view this notion as obvious—after all, inflation reduces the value of nom-
inal dollars over time and uncertainty about the receipt of future dollars increases the value
of dollars already received today. But the finance concept does not rest upon these princi-
ples. Instead, it arises from the fact that the $1 received today can be invested at a positive
7-18
PART 2 • Business Analysis and Valuation Tools
Copyright 2012 Cengage Learning. All Rights Reserved. May not be copied, scanned, or duplicated, in whole or in part. Due to electronic rights, some third party content may be suppressed from the eBook and/or eChapter(s).
Editorial review has deemed that any suppressed content does not materially affect the overall learning experience. Cengage Learning reserves the right to remove additional content at any time if subsequent rights restrictions require it.
interest rate to generate an amount greater than $1 in one year. This concept is known as
the time value of money and is reflected in future and present value computations.
Future Values and Compounding
To understand future values, consider an opportunity to invest $1 in a bank (an invest-
ment that has no risk) that generates a 10 percent annual return. The amount you
can expect to receive in one year is called the future value of $1 in one year at 10 percent
FV($1, 10%, 1), and is computed as follows:
FVð$1, 10%, 1Þ¼$1 þ $1 10%
¼ $1 ð1 þ 10%Þ
¼ $1:10:
Similarly, the future value of a dollar at 10% in two years is
FVð$1, 10%, 2Þ¼$1 þ $1 10% þð$1 þ $1 10%Þ10%
¼ $1 ð1 þ 10%Þ
2
¼ $1:121
More generally, we can write the future value of $1 at any interest rate R for any number
of periods N as follows:
FVð$1, R, NÞ¼$ ð1 þ RÞ
N
This process of converting dollars today into future dollars is called compounding. Among
other things, it is useful for helping us to compute how much our savings will be worth
upon retirement. For example, if I expect to retire in five years’ time, my savings account
that currently has a balance of $10,000 earning 5 percent per year will have grown to:
FVð$10,000, 5%, 5Þ¼$10,000 ð1 þ 5%Þ
5
¼ $10,000 1:2763 ¼ $12,763
Notice that as interest rates increase, future values also increase. For example, if rates rise from
5 percent to 10 percent, the future value of my savings account will increase from $12,763 to
$16,051, since I am now able to earn a much higher return on the savings.
Present Values and Discounting
The process of converting future dollars into today’s dollars is called discounting. Using
the examples above, $1.10 received in one year has a present value of $1 and $1.21
received in two years has a present value of $1. The present value of $1 received in
one year, PV($1, 10%, 1), is therefore the amount that when invested today for one
year at 10 percent would generate exactly $1, or PV($1, 10%, 1) (1 þ 10%) ¼ $1.
This implies that the present value itself is:
PVð1, 10%, 1Þ¼$1=ð1 þ 10%Þ¼$0:909
Similarly, the present value of $1 received in two years is PV($1, 10%, 2) (1 þ 10%)
2
¼ $1,
so the present value itself is
PVð$1, 10%, 2Þ¼$1=ð1 þ 10%Þ
2
¼ $0:826
More generally, we can write the present value of $1 at any interest rate R for any num-
ber of periods N as follows:
PVð$1, R, NÞ¼$1=ð1 þ RÞ
N
Prospective Analysis: Valuation Theory and Concepts 7-19
Copyright 2012 Cengage Learning. All Rights Reserved. May not be copied, scanned, or duplicated, in whole or in part. Due to electronic rights, some third party content may be suppressed from the eBook and/or eChapter(s).
Editorial review has deemed that any suppressed content does not materially affect the overall learning experience. Cengage Learning reserves the right to remove additional content at any time if subsequent rights restrictions require it.
The present value concept can also help us to plan for our retirement. For example, if we
decided that we wanted a nest egg of $1,000,000 for our planned retirement in twenty
years, it can help us determine how much we would need to set aside in savings today
to meet our goal. This is just the present value of $1,000,000 received in 20 years. If
interest rates are 10 percent, this amount is
PVð$1,000,000, 10%, 20Þ¼$1,000,000=ð1 þ 10%Þ
20
¼ $148:644
This means that if we invest $148,644 today, the interest that compounds on our invest-
ment will make it worth $1,000,000 in 20 years.
Notice that as interest rates decrease, the present value of dollars received in the
future increase. For example, if interest rates fall from 10 percent to 5 percent, the pres-
ent value of $1,000,000 in 20 years increases from $148,644 to $376,889. This arises
because the lower interest rates require us to invest a greater amount today to generate
$1,000,000 in the future.
As discussed in this chapter, the present value concept allows us to value stocks by
discounting future dividends, cash flows, or earnings that the stock is expected to gener-
ate for shareholders. It also allows us to value bonds by discounting future receipts of
bond interest and principal repayments.
Present Value of a Perpetuity
Some bonds, (such as British Consol bonds) pay off an identical amount each year. This
is called a perpetuity. How do we value a perpetuity? It is actually remarkably simple.
The perpetuity value (P) is simply the perpetuity amount (X) divided by the interest
(or discount rate, as it is often called).
P ¼ X=R
For example, if interest rates are 10 percent, a perpetual bond that pays interest of $10
per year is worth $100 ($10/0.10). Each year the investor receives $10 interest from the
bond, generating a 10 percent return on the investment value of $100.
The perpetuity value is also very useful in valuing stocks, particularly for the terminal
value computations. When a firm is in a stable steady state, its dividends, cash flows, or
earnings may resemble a perpetuity. Stock perpetuities can also incorporate a constant
growth rate over time. For example, a firm may generate cash flows of $10 for the first
year, and these grow by 4 percent per year thereafter, perhaps re flecting the nominal
rate of growth in the economy. A perpetuity with a constant growth rate is also rela-
tively simple to value. If the first payment is X and the growth rate g, the perpetuity is
valued as:
P ¼ X=ðR gÞ
Hence, the perpetuity with a first payment of $10 and a constant growth rate of 4 per-
cent is worth $10/(10%4%) or $166.67. This implies that the value of the
growth component of the perpetuity is worth $66.67, since the non-growth perpetuity
is worth $100.
Notice that the denominator for the growth perpetuity is Rg, the discount rate net
of the growth rate. If the growth rate equals or exceeds the discount rate, the denominator
is zero or negative and the perpetuity value is undefined or not meaningful. However, in
practice once a firm has reached a steady state, this should not be expected to happen as
firms that grow indefinitely at a rate that is much higher than the overall growth of the
economy will soon dominate the economy.
7-20
PART 2 • Business Analysis and Valuation Tools
Copyright 2012 Cengage Learning. All Rights Reserved. May not be copied, scanned, or duplicated, in whole or in part. Due to electronic rights, some third party content may be suppressed from the eBook and/or eChapter(s).
Editorial review has deemed that any suppressed content does not materially affect the overall learning experience. Cengage Learning reserves the right to remove additional content at any time if subsequent rights restrictions require it.

APPENDIX B Valuation Formulas
All of the valuation approaches discussed in this chapter can be expressed mathemati-
cally. The formulas for the various approaches are presented below:
Abnormal Earnings Valuation
Under the earnings-based approach, the value of the equity is
Equity value ¼ BE
0
þ
NI
1
R
e
BE
0
ð1 þ R
e
Þ
þ
NI
2
R
e
BE
1
ð1 þ R
e
Þ
2
þ
BE
0
is the firm’s current book equity, BE
t
is the expected beginning book equity in
period t, NI
t
is expected net income for period t, and R
e
is the return required by the
firm’s equity investors.
Valua tion Using Price Multiple s
The abnormal earnings valuation can be restructured into the equity value-to-book value
multiple by deflating the equity value by book equity by scaling. The valuation formula
then becomes:
Equity value
Book equity
¼ 1 þ
ðROE
1
R
e
ÞGBE
0
ð1 þ R
e
Þ
þ
ðROE
2
R
e
ÞGBE
1
ð1 þ R
e
Þ
2
þ
ðROE
3
R
e
ÞGBE
2
ð1 þ R
e
Þ
3
þ
ROE
t
is net income in year t deflated by beginning book equity; GBE
t
is expected
book equity growth, defined as expected beginning book equity in year t (BE
t
) deflated
by the current book equity (BE
0
); and R
e
is the required return for equity investors.
Disco unted Cash Flow Model
Under the free cash flow method, the value of equity is as follows:
Equity value ¼ PVðExpected free cash flows to equity Þ
¼
NI
1
ΔBVA
1
þ ΔBVND
1
ð1 þ R
e
Þ
þ
NI
2
ΔBVA
2
þ ΔBVND
2
ð1 þ R
e
Þ
2
þ
NI is expected net income, ΔBVA is the change in expected book value of net operating
assets (including changes in working capital plus capital expenditures less depreciation
expense), ΔBVND is the change in expected book value of net debt (interest-bearing
debt less excess cash), and R
e
is the required return for equity investors.
APPENDIX C Reconciling the Discounted Dividends and Discounted
Abnormal Earnings Models
To derive the earnings-based valuation from the dividend discount model, consider the
following two-period valuation:
Equity value ¼
DIV
1
ð1 þ r
e
Þ
þ
DIV
2
ð1 þ r
e
Þ
2
With clean surplus accounting, dividends (DIV) can be expressed as a function of net
income (NI) and the book value of equity (BVE):
DIV
t
¼ NI
t
þ BVE
t1
BVE
t
Prospective Analysis: Valuation Theory and Concepts 7-21
Copyright 2012 Cengage Learning. All Rights Reserved. May not be copied, scanned, or duplicated, in whole or in part. Due to electronic rights, some third party content may be suppressed from the eBook and/or eChapter(s).
Editorial review has deemed that any suppressed content does not materially affect the overall learning experience. Cengage Learning reserves the right to remove additional content at any time if subsequent rights restrictions require it.

Substituting this expression into the dividend discount model yields the following:
Equity value ¼
NI
1
þ BVE
0
BVE
1
ð1 þ r
e
Þ
þ
NI
2
þ BVE
1
BVE
2
ð1 þ r
e
Þ
2
This can be rewritten as follows:
Equity value ¼
NI
1
r
e
BVE
0
þ BVE
0
ð1 þ r
e
ÞBVE
1
ð1 þ r
e
Þ
þ
NI
2
r
e
BVE
1
þ BVE
1
ð1 þ r
e
ÞBVE
2
ð1 þ r
e
Þ
2
¼ BVE
0
þ
NI
1
r
e
BVE
0
ð1 þ r
e
Þ
þ
NI
2
r
e
BVE
1
ð1 þ r
e
Þ
2
BVE
2
ð1 þ r
e
Þ
2
As the forecast horizon expands, the final term (the present value of liquidating book
value) becomes inconsequential. The value of equity is therefore the current book value
plus the present value of future abnormal earnings.
APPENDIX D Asset Valuation Methodologies
All of the valuation approaches discussed in this chapter can also be structured to esti-
mate the value of a firm’s assets (or the combined debt and equity) rather than its equity.
Switching from equity valuation to asset valuation is often as simple as substituting
financial measures related to equity for financial measures related to the entire firm.
For example, in the earnings-based valuation model, Net Income (the earnings flow to
equity) is replaced by NOPAT (the earnings available for debt and equity), and book
values of net operating assets replace the book value of equity. Value multiples are
based on ROEs for the equity formulation and on ROAs for valuing asset multiples.
And the discount rate for equity models is the required return for equity owners com-
pared to the weighted average cost of debt and equity owners, called the weighted aver-
age cost of capital (or WACC) for asset valuation models.
The formulas used for asset valuation under the various approaches are presented below:
Abnormal Earnings Valuation
Under the earnings-based approach, the value of the assets is
Asset value ¼ Book assets þ PVðExpected abnormal NOPATÞ
¼ BA
0
þ
NOPAT
1
WACC BA
0
ð1 þ WACCÞ
þ
NOPAT
2
WACC BA
1
ð1 þ WACCÞ
2
þ
BA is the book value of the firm’s assets, NOPAT is net operating profit (before interest)
after tax, and WACC is the firm’s weighted-average cost of debt and equity. From this
asset value, the analyst can deduct the market value of net debt to generate an estimate
of the value of equity.
Valuation Using Price Multiples
The multiple valuation can be structured as the debt plus equity value-to-book assets
ratio by scaling the abnormal NOPAT formula by book value of net operating assets.
The valuation formula then becomes
7-22
PART 2 • Business Analysis and Valuation Tools
Copyright 2012 Cengage Learning. All Rights Reserved. May not be copied, scanned, or duplicated, in whole or in part. Due to electronic rights, some third party content may be suppressed from the eBook and/or eChapter(s).
Editorial review has deemed that any suppressed content does not materially affect the overall learning experience. Cengage Learning reserves the right to remove additional content at any time if subsequent rights restrictions require it.

Asset value
Book assets
¼ 1 þ PVðExpected abnormal ROA Expected beg : book asset growthÞ
¼ 1 þ
ðROA
1
WACC ÞGBA
0
ð1 þ WACCÞ
þ
ðROA
2
WACCÞGBA
1
ð1 þ WACCÞ
2
þ
where ROA ¼ Expected operating return on assets ¼ NOPAT/(Operating working cap-
tial þ Net long-term assets)
WACC ¼ Weighted average cost of capital (debt and equity)
GBA ¼ Book asset growth factor, defined as expected beginning book equity in
year t (BE
t
) deflated by the current book equity (BE
0
).
The value of a firm’s debt and equity to net operating assets multiple therefore depends
on its ability to generate asset returns that exceed its WACC, and on its ability to grow
its asset base. The value of equity under this approach is then the estimated multiple
times the current book value of assets less the market value of debt.
Disco unted Cash Flow Model
The free cash flow formulation can be structured by estimating the value of claims to net
debt and equity and then deducting the market value of net debt. This approach is more
widely used in practice because it does not require explicit forecasts of changes in debt
balances. The value of debt plus equity is computed as follows:
Asset value ¼ PVðExpected free cash flows to net debt and equity ownersÞ
¼
NOPAT
1
ΔBVA
1
ð1 þ WACCÞ
þ
NOPAT
2
ΔBVA
2
ð1 þ WACCÞ
2
þ
The firm ’s asset valuation therefore depends on the expected free cash flows to debt and
equity holders during the forecast horizon, the forecasted terminal value of free cash
flows, and the weighted average cost of capital.
Prospective Analysis: Valuation Theory and Concepts 7-23
Copyright 2012 Cengage Learning. All Rights Reserved. May not be copied, scanned, or duplicated, in whole or in part. Due to electronic rights, some third party content may be suppressed from the eBook and/or eChapter(s).
Editorial review has deemed that any suppressed content does not materially affect the overall learning experience. Cengage Learning reserves the right to remove additional content at any time if subsequent rights restrictions require it.

Chapter
8
PROSPECTIVE ANALYSIS:
VALUATION
IMPLEMENTATION
T
o move from the valuation theory discussed in the previous chapter to the actual
task of valuing a company, we have to deal with a number of issues. First, we
have to make forecasts of financial performance stated in terms of abnormal
earnings and book values, or free cash flows over the life of the firm. The forecasting
task itself is divided into two subcomponents: (1) detailed forecasts over a finite
number of years, and (2) a forecast of “terminal value,” which represents a summary of
performance beyond the detailed forecast horizon. And second, we have to estimate the
cost of capital to discount our forecasts.
Continuing with our TJX example, this chapter builds on the forecasts developed in
Chapter 6 and provides guidance on estimating the value of a firm’s equity by computing
a terminal value, calculating cost of equity, and synthesizing the different pieces of the
analytical process to estimate the value of equity. We focus on valuing equity directly
since this is typically the analyst’s primary objective. However, as discussed in
Appendix D of Chapter 7 and in the Appendix of this chapter, we recognize that a
similar approach can be used to value a firm ’s assets (both debt and equity).
DETAILED FORECASTS OF PERFORMANCE
The horizon over which detailed forecasts are to be made is itself a choice variable. We
will discuss later in this chapter how the analyst might make this choice. Once it is made,
the next step is to consider the set of assumptions regarding a firm’s performance that
are needed to arrive at the forecasts. We described in Chapter 6 the general framework
of financial forecasting and illustrated the approach using TJX.
The key to sound forecasts is that the underlying assumptions are grounded in a company’s
business reality. Strategy analysis provides a critical understanding of a company’svalue
proposition and whether current performance is likely to be sustainable in the future. Acco-
unting analysis and ratio analysis provide a deep understanding of a company’s current per-
formance and whether the ratios themselves are reliable indicators of performance. It is,
therefore, important to see the valuation forecasts as a continuation of the earlier steps in busi-
ness analysis rather than as a discrete and unconnected exercise from the rest of the analysis.
Since valuation involves forecasting over a long time horizon, it is not practical to
forecast all the line items in a company’s financial statements. Instead, the analyst has
to focus on the key elements of a firm’s performance. Specifically, we forecasted TJX’s
condensed income statement, beginning balance sheet, and free cash flows for a period
8-1
Copyright 2012 Cengage Learning. All Rights Reserved. May not be copied, scanned, or duplicated, in whole or in part. Due to electronic rights, some third party content may be suppressed from the eBook and/or eChapter(s).
Editorial review has deemed that any suppressed content does not materially affect the overall learning experience. Cengage Learning reserves the right to remove additional content at any time if subsequent rights restrictions require it.

of ten years starting in fiscal year 2011 (year beginning in February 2011), using as a
base the adjusted financial statements detailed in Chapter 5. We will use these same fore-
casting assumptions and financial forecasts, which are repeated here in Tables 8-1 and
8-2, as a starting point to value TJX as of February 1, 2011.
Maki ng Perfo rmance Fo recasts for Valuing T JX
As discussed in Chapter 7, under the different approaches to valuation, the key forecasts
required to convert the financial forecasts shown above into estimates of equity value are:
• Abnormal earnings: net income less shareholders’ equity at the beginning of the
year times shareholders’ required return, termed the cost of equity,
• Abnormal ROE: abnormal ROE, or the difference between ROE and cost of equity,
adjusted for growth in book equity, or
• Free cash flows to equity: net income less any increases in operating working capi-
tal and net long-term assets plus any increase in net debt.
In order to generate the forecasts of abnormal earnings and abnormal ROE, we need
to establish an estimated cost of equity for the firm. For the purposes of this discussion
we will take TJX’s cost of equity as given at 8.8 percent; the detailed calculation of this
estimate is discussed later in the chapter.
Table 8-3 shows TJX’s performance forecasts for these three financial statement vari-
ables for the ten-year period 2011 to 2020.
As discussed earlier, to derive cash flows in 2020, we need to make assumptions about
sales growth rate and balance sheet ratios in 2021. The cash flow forecasts shown in
Table 8-3 are based on the assumption that the sales growth and beginning balance
sheet ratios in 2021 remain the same as in 2020. We discuss the sensitivity of this
assumption and the terminal value assumption later in the chapter.
TJX’s projected abnormal ROE declines steadily over the forecast horizon, from 42.1
percent in 2011 to 13.0 percent in 2020, in keeping with the gradual attrition due to the
forces of competition. A similar pattern is seen for abnormal earnings, which declines
steadily over the course of the forecast period.
TER MINAL VALUES
Explicit forecasts of the various elements of a firm’s performance generally extend for a
period of five to ten years. The final year of this forecast period is labeled the “terminal
year.” Selection of an appropriate terminal year is discussed later in this section.
TABL E 8 -1 Forecasting Assumptions for TJX
Forecast Year 2011 2012 2013 2014 2015 2016 2017 2018 2019 2020
..............................................................................................................................................................................................
Sales growth rate 5.7% 6.6% 7.1% 6.9% 6.7% 6.5% 6.3% 6.1% 5.9% 5.7%
NOPAT margin 7.9% 7.5% 7.1% 6.7% 6.3% 5.9% 5.5% 5.0% 4.5% 4.0%
Beginning net operating
working capital/sales
0.6% 1.0% 1.0% 1.0% 1.0% 1.0% 1.0% 1.0% 1.0% 1.0%
Beginning net operating
long-term assets/sales
33.4% 34.0% 34.3% 34.5% 34.8% 35.0% 35.3% 35.5% 35.8% 36.0%
Beginning net debt to
capital ratio
57.5% 57.5% 57.5% 57.5% 57.5% 57.5% 57.5% 57.5% 57.5% 57.5%
After-tax cost of debt 2.73 2.73 2.73 2.73 2.73 2.73 2.73 2.73 2.73 2.73
..............................................................................................................................................................................................
Source: © Cengage Learning 2013
8-2 PART 2 • Business Analysis and Valuation Tools
Copyright 2012 Cengage Learning. All Rights Reserved. May not be copied, scanned, or duplicated, in whole or in part. Due to electronic rights, some third party content may be suppressed from the eBook and/or eChapter(s).
Editorial review has deemed that any suppressed content does not materially affect the overall learning experience. Cengage Learning reserves the right to remove additional content at any time if subsequent rights restrictions require it.

TABL E 8 -2 Forecasted Financial Statements for TJX
Forecast Year 2011 2012 2013 2014 2015 2016 2017 2018 2019 2020
...........................................................................................................................................................................................................................................................
Beginning Balance Sheet
Beg. net working capital 144.1 247.2 264.8 283.1 302.0 321.7 341.9 362.8 384.2 406.1
þ Beg. net long-term assets 7,754.4 8,406.0 9,069.1 9,765.6 10,495.4 11,258.0 12,052.7 12,878.7 13,734.5 14,618.9
= net operating assets 7,898.5 8,653.3 9,333.9 10,048.7 10,797.4 11,579.7 12,394.7 13,241.4 14,118.7 15,025.0
Net Debt 4,541.4 4,975.3 5,366.6 5,777.6 6,208.1 6,657.9 7,126.5 7,613.4 8,117.8 8,638.9
þ Preferred stock 0.0 0.0 0.0 0.0 0.0 0.0 0.0 0.0 0.0 0.0
þ Shareholders’ equity 3,357.1 3,677.6 3,967.2 4,271.0 4,589.3 4,921.8 5,268.2 5,628.1 6,001.0 6,386.2
= Net capital 7,898.5 8,653.3 9,333.9 10,048.7 10,797.4 11,579.7 12,394.7 13,241.4 14,118.7 15,025.0
Income Statement
Sales 23,192.9 24,723.6 26,479.0 28,306.1 30,202.6 32,165.7 34,192.2 36,277.9 38,418.3 40,608.2
Net operating profits after tax 1,832.2 1,854.3 1,880.0 1,896.5 1,902.8 1,897.8 1,880.6 1,813.9 1,728.8 1,624.3
Net interest expense after tax 123.9 135.7 146.4 157.6 169.4 181.6 194.4 207.7 221.5 235.7
= Net income 1,708.4 1,718.6 1,733.6 1,738.9 1,733.4 1,716.2 1,686.2 1,606.2 1,507.4 1,388.7
Preferred dividends 0 0 0 0 000000
= Net income to common 1,708.4 1,718.6 1,733.6 1,738.9 1,733.4 1,716.2 1,686.2 1,606.2 1,507.4 1,388.7
Operating return on assets 23.2% 21.4% 20.1% 18.9% 17.6% 16.4% 15.2% 13.7% 12.2% 10.8%
Return on common equity 50.9% 46.7% 43.7% 40.7% 37.8% 34.9% 32.0% 28.5% 25.1% 21.7%
Book value of assets growth rate 23.7% 9.6% 7.9% 7.7% 7.5% 7.2% 7.0% 6.8% 6.6% 6.4%
Book value of common equity
Growth rate
16.2% 9.6% 7.9% 7.7% 7.5% 7.2% 7.0% 6.8% 6.6% 6.4%
Net operating asset turnover 2.9 2.9 2.8 2.8 2.8 2.8 2.8 2.7 2.7 2.7
Cash Flow Data
Net income 1,708.4 1,718.6 1,733.6 1,738.9 1,733.4 1,716.2 1,686.2 1,606.2 1,507.4 1,388.7
Change in net working capital 103.1 17.6 18.3 19.0 19.6 20.3 20.9 21.4 21.9 23.2
Change in net long-term assets 651.6 663.0 696.5 729.8 762.6 794.7 825.9 855.9 884.4 833.3
þ Change in net debt 434.0 391.3 411.0 430.5 449.8 468.6 486.9 504.4 521.1 492.4
= Free cash flow to equity 1,387.6 1,429.3 1,429.8 1,420.6 1,400.9 1,369.8 1,326.3 1,233.3 1,122.2 1,024.7
Net operating profit after tax 1,832.2 1,854.3 1,880.0 1,896.5 1,902.8 1,897.8 1,880.6 1,813.9 1,728.8 1,624.3
Change in net working capital 103.1 17.6 18.3 19.0 19.6 20.3 20.9 21.4 21.9 23.2
Change in net long-term assets 651.6 663.0 696.5 729.8 762.6 794.7 825.9 855.9 884.4 833.3
= Free cash flow to capital 1,077.5 1,173.7 1,165.2 1,147.7 1,120.5 1,082.8 1,033.8 936.6 822.5 767.9
...........................................................................................................................................................................................................................................................
Source: © Cengage Learning 2013
.............................................................................................................................................
.............................................................................................................................................
.............................................................................................................................................
Pro spec tive Analysis: Valuatio n Implement ation 8-3
Copyright 2012 Cengage Learning. All Rights Reserved. May not be copied, scanned, or duplicated, in whole or in part. Due to electronic rights, some third party content may be suppressed from the eBook and/or eChapter(s).
Editorial review has deemed that any suppressed content does not materially affect the overall learning experience. Cengage Learning reserves the right to remove additional content at any time if subsequent rights restrictions require it.

Terminal value is then the present value of either abnormal earnings or free cash flows
occurring beyond the terminal year. Since this involves forecasting performance over the
remainder of the firm’s life, the analyst must adopt some assumption that simplifies the
process of forecasting. A key question is whether it is reasonable to assume a continua-
tion of the terminal year performance or whether some other pattern is expected.
Clearly, the continuation of sales growth that is significantly greater than the average
growth rate of the economy is unrealistic over a very long horizon. That rate would
likely outstrip inflation in the dollar and the real growth rate of the world economy.
Over many years, it would imply that the firm would grow to a size greater than that
of all other firms in the world combined. But what would be a suitable alternative
assumption? Should we expect the firm ’s sales growth rate to ultimately settle down to
the rate of inflation? Or to a higher rate, such as the nominal GDP growth rate? And
perhaps equally importantly, will a firm that earns abnormal profits continue to do so
by maintaining its profit margins on a growing, or even existing, base of sales?
Ultimately, to answer these questions, we must consider how much longer the rate of
growth in industry sales can outstrip overall economic growth and how long a firm’s
competitive advantages can be sustained. Clearly, looking eleven or more years into the
future, any forecast is likely to be subject to considerable error.
Below we discuss a variety of alternative approaches to the task of calculating a termi-
nal value.
Terminal Values with the Competitive Equilibrium Assumption
Fortunately, in many—if not most—situations, how we deal with the seemingly impon-
derable questions about long-range growth in sales simply does not matter very much! In
fact, under plausible economic assumptions, there is no practical need to consider sales
growth beyond the terminal year. Such growth may be irrelevant, so far as the firm’s
current equity value is concerned!
How can long-range growth in sales not matter? The reasoning revolves around the
forces of competition. One impact of competition is that it tends to constrain a firm’s
ability to identify, on a consistent basis, growth opportunities that generate supernormal
profits. The other dimension that competition tends to impact is a firm’s margins.
Ultimately, we would expect high profits to attract enough competition to drive down a
firm’s margins, and therefore its returns, to a normal level. At this point, the firm will
earn its cost of capital, with no abnormal returns or terminal value. (Recall the evidence
TABL E 8 -3 Performance Forecast for TJX
Forecast Year 2011 2012 2013 2014 2015 2016 2017 2018 2019 2020
..............................................................................................................................................................................................
Equity Valuation
Abnormal
earnings
1,413.9 1,396.0 1,385.7 1,364.3 1,330.9 1,284.5 1,224.1 1,112.6 981.1 828.6
Abnormal ROE 42.1% 38.0% 34.9% 31.9% 29.0% 26.1% 23.2% 19.8% 16.4% 13.0%
Free cash flow
to equity
1,387.6 1,429.3 1,429.8 1,420.6 1,400.9 1,369.8 1,326.3 1,233.3 1,122.2 1,024.7
Equity discount
factor
0.92 0.85 0.78 0.71 0.66 0.60 0.56 0.51 0.47 0.43
Equity growth
factor
1.00 1.10 1.18 1.27 1.37 1.47 1.57 1.68 1.79 1.90
..............................................................................................................................................................................................
Source: © Cengage Learning 2013
8-4 PART 2 • Business Analysis and Valuation Tools
Copyright 2012 Cengage Learning. All Rights Reserved. May not be copied, scanned, or duplicated, in whole or in part. Due to electronic rights, some third party content may be suppressed from the eBook and/or eChapter(s).
Editorial review has deemed that any suppressed content does not materially affect the overall learning experience. Cengage Learning reserves the right to remove additional content at any time if subsequent rights restrictions require it.
in Chapter 6 concerning the reversion of ROEs to normal levels over a horizon of five to
ten years.)
Certainly, a firm may at a point in time maintain a competitive advantage that per-
mits it to achieve returns in excess of the cost of capital. When that advantage is pro-
tected with patents or a strong brand name, the firm may even be able to maintain it
for many years, perhaps indefinitely. With hindsight, we know that some such
firms—Coca-Cola and Wal-Mart, for instance—were able not only to maintain their
competitive edge but also to expand it across a dramatically increasing investment base.
However, with a few exceptions, it is reasonable to assume that the terminal value of the
firm will be zero under the competitive equilibrium assumption, obviating the need to
make assumptions about long-term growth rates.
Competitive Equilibrium Assump tion Only on Incremental Sales
An alternative version of the competitive equilibrium assumption is to assume that a
firm will continue to earn abnormal earnings forever on the sales it had in the terminal
year, but there will be no abnormal earnings on any incremental sales beyond that level.
If we invoke the competitive equilibrium assumption on incremental sales beyond the
terminal, then it does not matter what sales growth rate we use beyond that year, and
we may as well simplify our arithmetic by treating sales as if they will be constant at
the terminal year level. Then ROE, net income, and free cash flow to equity will all
remain constant at the terminal year level.
For example, by treating TJX as if its competitive advantage can be maintained only
on the nominal sales level achieved in the year 2020, we will be assuming that in real
terms its competitive advantage will shrink. Under this scenario, it is simple to estimate
the terminal value by dividing the 2020 level of abnormal earnings, abnormal ROEs, or
free cash flow to equity by the appropriate discount rate. As one would expect, termi-
nal values in this scenario will be higher than those with no abnormal returns on all
sales in years 2021 and beyond. This is entirely due to the fact that we are now assum-
ing that TJX can retain i ts superior performance on its existing base of sales
indefinitely.
Terminal Value with Persistent Abnormal Performance and Growth
Each of the approaches described above appeals in some way to the competitive equilib-
rium assumption. However, there are circumstances where the analyst is willing to
assume that the firm may defy competitive forces and earn abnormal rates of return on
new projects for many years. If the analyst believes supernormal profitability can be
extended to larger markets for many years, it can be accommodated within the context
of a valuation analysis.
One possibility is to project earnings and cash flows over a longer horizon, i.e., until the
competitive equilibrium assumption can reasonably be invoked. In the case of TJX, for
example, we could assume that the supernormal profitability will continue for five years
beyond 2020 (for a total forecasting horizon of 15 years from the beginning of the fore-
casting period), but after that period, the firm’s ROE will equal its cost of equity.
Another possibility is to project growth in abnormal earnings or cash flows at some
constant rate. For instance, one could expect TJX to maintain its advantage on a sales
base that remains constant in real terms, implying that sales grow beyond the year
2020 at the long-run average U.S. inflation rate of 3.0 percent. Beyond our terminal
year, 2020, as the sales growth rate remains constant at 3.0 percent, abnormal earnings,
free cash flows, and book value of equity also grow at this same constant rate. This is
Pro spec tive Analysis: Valuatio n Implement ation 8-5
Copyright 2012 Cengage Learning. All Rights Reserved. May not be copied, scanned, or duplicated, in whole or in part. Due to electronic rights, some third party content may be suppressed from the eBook and/or eChapter(s).
Editorial review has deemed that any suppressed content does not materially affect the overall learning experience. Cengage Learning reserves the right to remove additional content at any time if subsequent rights restrictions require it.
simply because we held all other performance ratios constant in this period. As a result,
abnormal ROE remains constant at the same level as in the terminal year.
This approach is more aggressive than the preceding assumptions about terminal value,
but it may be more realistic. After all, there is no obvious reason why the real size of the
investment base on which TJX earns abnormal returns should depend on inflation rates.
The approach, however, still relies to some extent on the competitive equilibrium assump-
tion. The assumption is now invoked to suggest that supernormal profitability can be
extended only to an investment base that remains constant in real terms. In rare situations,
if the company has established a market dominance that the analyst believes is immune to
the threat of competition, the terminal value can be based on both positive real sales
growth and abnormal profits. When we assume that the abnormal performance persists
at the same level as in the terminal year, projecting abnormal earnings and free cash
flows is a simple matter of growing them at the assumed sales growth rate. Since the rate
of abnormal earnings and cash flows growth is constant starting in the year after the ter-
minal year, it is also straightforward to discount those flows. The present value of the flow
stream is the flow at the end of the first year divided by the difference between the dis-
count rate and steady state growth rate, provided that the discount rate exceeds the growth
rate. There is nothing about this valuation method that requires any reliance on the com-
petitive equilibrium assumption; it could be used with any sales growth rate less than the
discount rate. The question is not whether the arithmetic is available to handle such an
approach, but rather how realistic it is.
Terminal Value Based on a Price Multiple
A popular approach to terminal value calculation is to apply a multiple to abnormal
earnings, cash flows, or book values of the terminal period. The approach is not as
ad hoc as it might first appear. Note that under the assumption of no sales growth,
abnormal earnings or cash flows beyond the terminal year remain constant. Capitalizing
these flows in perpetuity by dividing by the cost of capital is equivalent to multiplying
them by the inverse of the cost of capital. For example, in the case of TJX, capitalizing
free cash flows to equity at its cost of equity of 8.8 percent is equivalent to assuming a
terminal cash flow multiple of 11.4. Thus, applying a multiple in this range to TJX is
similar to discounting all free cash flows beyond 2020 while invoking the competitive
equilibrium assumption on incremental sales.
The mistake to avoid here is to capitalize the future abnormal earnings or cash flows
using a multiple that is too high. The earnings or cash flow multiples might be high cur-
rently because the market anticipates abnormally profitable growth. However, once that
growth is realized, the PE multiple should fall to a normal level. It is that normal PE,
applicable to a stable firm or one that can grow only through making investments that
generate the cost of capital, that should be used in the terminal value calculation. Thus
multiples in the range of 11.4—close to the reciprocal of cost of equity —should be used
here. Higher multiples are justifiable only when there are still abnormally profitable
growth opportunities beyond the terminal year. A similar logic applies to the estimation
of terminal values using book value multiples.
Selecting the Terminal Year
A critical question posed by the above discussion is how long to make the detailed fore-
cast horizon. When the competitive equilibrium assumption is used, the answer is what-
ever time is required for the firm’s returns on incremental investment projects to reach
that equilibrium—an issue that turns on the sustainability of the firm’s competitive
advantage. As indicated in Chapter 6, historical evidence indicates that most firms in
8-6
PART 2 • Business Analysis and Valuation Tools
Copyright 2012 Cengage Learning. All Rights Reserved. May not be copied, scanned, or duplicated, in whole or in part. Due to electronic rights, some third party content may be suppressed from the eBook and/or eChapter(s).
Editorial review has deemed that any suppressed content does not materially affect the overall learning experience. Cengage Learning reserves the right to remove additional content at any time if subsequent rights restrictions require it.

the United States should expect ROEs to revert to normal levels within five to ten years.
But for the typical firm, we can justify ending the forecast horizon even earlier—note
that the return on incremental investment can be normal even while the return on total
investment (and therefore ROE) remains abnormal. Thus a five- to ten-year forecast
horizon should be more than sufficient for most firms. Exceptions would include firms
so well insulated from competition (perhaps due to the power of a brand name) that
they can extend their investment base to new markets for many years and still expect
to generate supernormal returns.
Estimates of TJX’s Terminal Value
Choosing a Termina l Year
Based on the foregoing strategic assessment of TJX, we have seen that the firm is facing
challenges in both its established U.S. market and in the new markets where it sees its
potential for long-term expansion. Despite those challenges, we have argued that TJX
has created a competitive advantage that will resist a full reversion to the mean in the
near term. With that in mind, we have chosen a ten-year forecast period beyond which
we believe the firm’s performance will have reached a steady state. Expanding the fore-
cast horizon will therefore not provide further insights into how market dynamics will
impact TJX’s long-term performance. Table 8-2 shows that the ROE is forecasted to
decline gradually over those ten years, from 50.9 percent in 2011 to 21.7 percent by
2020. At the 2020 level the company will earn an abnormal return on equity of approxi-
mately 13 percent, since its cost of equity is estimated to be 8.8 percent.
Terminal Value Under Varying Assumptions
Table 8-4 shows TJX’s terminal value under the various theoretical approaches we dis-
cussed above. Scenario 1 of this table shows the terminal value if we assume that TJX
will continue to grow its sales at 5.7 percent beyond fiscal year 2020, and that it will
continue to earn the same level of abnormal returns as in 2020 (that is, we assume that
all the other forecasting assumptions will be the same as in 2020). This scenario essen-
tially summarizes TJX performance in perpetuity under the assumption that the firm
will continue to make persistent abnormal returns and leads to a terminal value of
$12.3 billion. Scenario 2 assumes that TJX is able to maintain its abnormal returns only
TABL E 8 -4 Terminal Values Under Various Assumptions (Using Abnormal Earnings
Methodology)
Approach Scenario
Terminal
Sales
Growth
Terminal
NOPAT
Margins
Value Beyond
Forecast Horizon
(Terminal Value
$ in billions)
..............................................................................................................................................................................................
Persistent Abnormal Performance Sales growth and margins based on
detailed analysis and forecast
5.7% 4.0% 12.3
Abnormal Returns on Constant Sales
(Real Terms)
Sales grow at the rate of inflation,
margins maintained
3.0% 4.0% 6.4
Abnormal Returns on Constant Sales
(Nominal Terms)
Essentially zero sales growth, margins
maintained
0.0% 4.0% 4.1
Competitive Equilibrium Margins reduced so no abnormal
earnings
5.7% 2.0% 0.0
..............................................................................................................................................................................................
Source: © Cengage Learning 2013
Pro spec tive Analysis: Valuatio n Implement ation 8-7
Copyright 2012 Cengage Learning. All Rights Reserved. May not be copied, scanned, or duplicated, in whole or in part. Due to electronic rights, some third party content may be suppressed from the eBook and/or eChapter(s).
Editorial review has deemed that any suppressed content does not materially affect the overall learning experience. Cengage Learning reserves the right to remove additional content at any time if subsequent rights restrictions require it.
on a base of sales that is constant in real terms. Scenario 2 calculates the terminal value
assuming that TJX will maintain its margins only on sales that grow at the long-run
expected rate of inflation, assumed to be 3.0 percent, reducing the terminal value to
$6.4 billion. Scenario 3 shows the terminal value if we assume that the company’s com-
petitive advantage can be maintained only on the nominal sales level achieved in 2020.
As a result, sales growth beyond the terminal year is assumed to be zero, which is equiv-
alent to assuming that incremental sales do not produce any abnormal returns. The ter-
minal value under this scenario drops to $4.1 billion. The final scenario invokes the
competitive equilibrium assumption: margins will be eroded such that the firm will
have no abnormal returns irrespective of the rate of sales growth, leading to no terminal
value. For the sake of illustration, the expected sales growth of 5.7 percent is maintained.
To represent the competitive equilibrium, margins are lowered to eliminate any of TJX’s
competitive advantage.
COMPUTI NG A DIS COUNT RATE
To value a company’s equity, the analyst discounts abnormal earnings or cash flows
available to equity holders using the cost of equity, which is the return required by equity
investors. In our calculation of Abnormal Returns, Abnormal ROE, and Terminal Value
above, we have assumed a cost of equity for TJX of 8.8 percent.
Estimating the cost of equity can be difficult, and a full discussion of the topic lies
beyond the scope of this chapter. Even an extended discussion would not supply answers
to all the questions that might be raised in this area because the field of finance is in a
state of flux over what constitutes an appropriate measure of the cost of equity.
One common approach is to use the capital asset pricing model (CAPM), which
expresses the cost of equity as the sum of a required return on riskless assets plus a pre-
mium for beta or systematic risk:
Cost of equity ¼ Riskless rate of return þðBeta risk Market risk premiumÞ
To estimate the required return on riskless assets, analysts often use the rate on
intermediate-term treasury bonds, based on the observation that it is cash flows beyond
the short term that are being discounted.
1
The systematic or beta risk of a stock reflects the sensitivity of its cash flows and
earnings (and hence stock price) to economy-wide m arket movements.
2
A firm whose
performance increases or decreases at the same r ate as changes in the economy as a
whole will have a beta of one. Firms whose performance is highly sensitive to
economy-wide changes, such as luxury good producers, capital good manufacturers,
and c onstruction firms, will have betas that exceed one. And firms whose earnings
and cash flows are less s ensitive to economic changes, such as regulated utilities or
supermarkets, will have betas that are lower than one. Financial services firms, such
as Standard & Poor’s and Value Line, provide e stimates of bet a for publicly listed c om-
panies that are based on the historical relation be tween their stock returns and the
returns on the market index. These estimates, which are also reported on standard
online financial sites such as Yahoo Finance and Google Finance, provide a useful
way to assess publicly traded firms’ beta risks.
3
For firms that are not publicly traded,
analysts can use betas for publicly traded firms in the same industries as an indicator
of their likely beta risks.
Finally, the market risk premium is the amount that investors demand as additional
return for bearing beta risk. It is the excess of the expected return on the market index
over the riskless rate. Over the 1926–2010 period, returns to the Standard and Poor’s 500
index have exceeded the rate on intermediate-term treasury bonds by 6.7 percent.
4
As a
8-8
PART 2 • Business Analysis and Valuation Tools
Copyright 2012 Cengage Learning. All Rights Reserved. May not be copied, scanned, or duplicated, in whole or in part. Due to electronic rights, some third party content may be suppressed from the eBook and/or eChapter(s).
Editorial review has deemed that any suppressed content does not materially affect the overall learning experience. Cengage Learning reserves the right to remove additional content at any time if subsequent rights restrictions require it.

result, many analysts assume that the market risk premium is around 7 percent. Others
argue that a variety of changes in the U.S. economy make the historical risk premium an
invalid basis for forecasting expected risk premium going forward. Evidence from some
recent academic research suggests that the expected risk premium in the market in
recent years has declined substantially to between 3 and 5 percent, leading some analysts
to use these lower rates in their valuations.
5
However, questions have arisen about these
approaches. In our calculation of TJX’s cost of equity we therefore use the historic mar-
ket risk premium of 6.7 percent.
Although the CAPM is often used to estimate the cost of equity, evidence indicates
that the model is incomplete. Assuming stocks are priced competitively, stock returns
should be expected just to compensate investors for the cost of their capital. Thus long-
run average returns should be close to the c ost of equity and should (according to the
CAPM) vary across stocks according to their systematic risk. However, factors beyond
just systematic risk seem to play some role in explaining variation in long-run average
returns. The most important such factor is labeled the “size eff ect”:smallerfirms(as
measured by market capitalization) tend to generate higher returns in subsequent per-
iods. Why this is so is unclear. It could mean either that smaller firms are riskier than
indicated by the CAPM or that they are underpriced at the point their market capitali-
zation is measured, or some combination of both. Average stock returns for U.S. firms
(including NYSE, AMEX, and NASDAQ firms) varied across size deciles from 1926 to
2010, as shown in Table 8-5. The table shows that, historically, investors in firms in the
top two deciles of the size distribution have realized returns of 10.9 and 12.9 percent
compared to significantly higher returns for firms in the smallest two size deciles, 17.2
to 21.0 percent re spectively. Not surprisingly, large stocks have been significantly less
risky than smaller stocks. Stocks in the largest decile have a beta of less than one com-
pared to 1.41 for the smallest decile. After controllingforthisdifferenceinbetarisk,
we see that firm s in the smallest decile have earned an average of 6.4 percent more
than the theoretical CAPM return over time. Finance theorists have not developed a
well-accepted explanation for why t hat should be the case.
TABL E 8 -5 Stock Returns, Volatility, and Firm Size
Size Decile
Market value of
largest company
in decile in 2010
($ millions)
Fraction of total
market value
represented by decile
in 2010 (%)
Average annual
stock return
1926–2010 (%)
Beta,
1926–2010
Size premium
(return in excess
of CAPM - %)
..............................................................................................................................................................................................
1 – smallest 235.6 1.0 21.0 1.41 6.4
2 477.5 1.3 17.2 1.35 2.9
3 771.8 1.7 16.5 1.30 2.7
4 1,212.3 2.2 15.4 1.24 1.9
5 1,776.0 2.6 15.0 1.19 1.8
6 2,509.2 3.5 14.8 1.16 1.8
7 3,711.0 4.3 13.9 1.12 1.2
8 6,793.9 7.4 13.6 1.10 1.0
9 15,079.5 13.6 12.9 1.03 0.8
10 – largest 314,622.6 62.3 10.9 0.91 0.4
..............................................................................................................................................................................................
Source: Ibbotson and Associates, Market Results for Stocks, Bonds, Bills, and Inflation, 1926–2010 (2011)
Pro spec tive Analysis: Valuatio n Implement ation 8-9
Copyright 2012 Cengage Learning. All Rights Reserved. May not be copied, scanned, or duplicated, in whole or in part. Due to electronic rights, some third party content may be suppressed from the eBook and/or eChapter(s).
Editorial review has deemed that any suppressed content does not materially affect the overall learning experience. Cengage Learning reserves the right to remove additional content at any time if subsequent rights restrictions require it.
In recognition of their importance, we can use both the CAPM and the “size factors”
to estimate a firm’s cost of equity. The approach adjusts the CAPM-based cost of equity
using the difference between the average return on the market index used in the CAPM
(the Standard and Poor’s 500) and the average return on firms of a size comparable to
the firm being evaluated. The resulting cost of equity is the following:
Cost of equity ¼ Riskless rate of return þðBeta Risk Market risk PremiumÞ
þ Size premium
In light of the continuing debate on how to measure the cost of equity, it is not sur-
prising that managers and analysts often consider a range of estimates. Debates continue
about whether or not the historical risk premium of approximately 7 percent is valid
today, whether beta is a relevant measure of risk, and whether other metrics such as
size should be reflected in cost of equity estimates. Since these debates are still unre-
solved, it is prudent for analysts to use a range of risk premium estimates in computing
a firm’s cost of equity.
Estimati ng TJX’sCostofEquity
To estimate the cost of equity for TJX, we note that the company’s equity beta was
reported by Value Line to be 0.8, and the ten-year Treasury bond in February/March
2011 was yielding roughly 3.4 percent. Using the historical risk premium for equities of
6.7 percent discussed above, we can calculate the cost of equity for TJX to be 8.8 percent
as follows:
Cost of equity ¼ Riskless rate of return þðBeta Risk Market risk PremiumÞ
8:8 ¼ 3:4 þð0:8 6:7Þ
We do not include a size factor in computing TJX’s cost of equity, since its market capi-
talization falls into the tenth decile, where the size premium is modest. However, it is
important to remember that the 8.8 percent cost of equity used to discount forecasts of
abnormal earnings and cash flows available to TJX’s equity owners is only a starting
point, and that the analyst can change the estimate by changing the assumed market
risk premium or by making size effects adjustments.
Adjusting Cost of Equity for Changes in Lev erage
The cost of equity changes as a function of a firm’s leverage. As leverage increases, debt
and equity become more risky and therefore more costly. If an analyst is contemplating
making significant changes to the firm’s capital structure during the forecasting time
period relative to its historical capital structure, it is important to re-estimate the cost
of debt and equity to take these changes into account.
6
This is not a straightforward task. It requires estimating the changes in the costs of
debt and equity that are likely to arise from changing the firm’s capital structure. The
change in the cost of debt can be estimated by examining the cost of debt for firms in
the same or comparable industries that have the revised capital structure.
The change in the cost of equity can be estimated by computing the beta of the firm’s
assets, that is, the weighted average beta risk of its debt and equity, and then re-levering
the firm using its new capital structure. The first step in this process is to infer the old
and revised debt betas using the capital asset pricing model and given information on the
former and revised costs of debt, the risk premium, and the risk-free rate. To compute
the revised cost of debt, the analyst can estimate how the revised capital structure would
8-10
PART 2 • Business Analysis and Valuation Tools
Copyright 2012 Cengage Learning. All Rights Reserved. May not be copied, scanned, or duplicated, in whole or in part. Due to electronic rights, some third party content may be suppressed from the eBook and/or eChapter(s).
Editorial review has deemed that any suppressed content does not materially affect the overall learning experience. Cengage Learning reserves the right to remove additional content at any time if subsequent rights restrictions require it.
change its debt rating (as discussed in Chapter 10). Higher or lower rated debt would
increase or decrease the firm’s cost of debt.
The second step is to estimate the firm’s asset beta under the current (or old) capital
structure, using the current betas for debt and equity, and the weightings of debt and
equity in its market value:
Asset beta risk ¼ Equity beta risk
old
% Equity
old
þ Debt beta risk
old
% Debt
old
ð1 tax rateÞ
The asset beta risk represents the extent to which the cash flows generated by the
firm’s assets fluctuate with economic cycles. The %Equityold and %Debtold are the share
of the firm’s enterprise market or fair value currently financed by equity and debt,
respectively, with an adjustment for the differential tax treatment of debt financing costs
(1tax rate).
We are then in position to infer the revised equity beta under the new capital struc-
ture. To do so, we assume that the firm’s asset beta is unchanged by the change in capital
structure. Since we know the asset beta, the revised debt beta, and the new capital struc-
ture, we can solve for the new equity beta as follows:
Equity beta risk
new
¼ðAsset beta risk Debt beta risk
new
% Debt
new
ð1 tax rateÞÞ=ð% Equity
new
Þ
Finally, we can use the CAPM and the revised equity beta to compute the new cost of
equity under the revised capital structure.
Given the complexity of this process, we recommend its use only when there are
likely to be significant changes in a firm’ s capital structure.
COMPUTING EQUITY VALUE
Table 8-6 shows the estimated value of TJX’s equity using the three different methods
discussed in Chapter 7 (Abnormal earnings, Abnormal ROE, and Free cash flows to
equity). To compute these values, TJX’s cost of equity of 8.8 percent is first used to dis-
count the performance forecasts in Table 8-3 and the terminal value forecast using the
four scenarios presented above in Table 8-4. Those discounted forecasts are then added
together with beginning book value (except in the free cash flows to equity calculation,
which does not depend on beginning book value) to arrive at a total estimated value of
TJX’s equity under the various scenarios we have discussed. Depending on which
assumption of TJX’s earnings behavior over the long term we are examining, we can
see that estimates of TJX’s share price range from $29.78 to $61.36.
As discussed in Chapter 7, the Abnormal earnings, Abnormal ROE, and the Free cash
flow methods generate the same equity values. Note also that TJX’s terminal value repre-
sents a larger fraction of the total value of equity under the free cash flow method rela-
tive to the other methods. As discussed in Chapter 7, this is because the abnormal
earnings and ROE methods rely on a company’s book value of equity, so the terminal
value forecasts are for incremental value over book value. In contrast, the free cash flow
approach ignores the book value, implying that the terminal value forecasts represent
total value during this period.
As a final note, the primary calculations in the above estimates treat all flows as if they
arrive at the end of the year. In reality they will typically arrive throughout the year. If we
choose to assume for the sake of simplicity that cash flows arrive at mid-year, then we
should adjust our value estimates upward by [1 þ (R/2)], where R is the discount rate.
This would increase the equity value estimates to a range of $31.09 to $64.06.
Prospective Analysis: Valuation Implementation 8-11
Copyright 2012 Cengage Learning. All Rights Reserved. May not be copied, scanned, or duplicated, in whole or in part. Due to electronic rights, some third party content may be suppressed from the eBook and/or eChapter(s).
Editorial review has deemed that any suppressed content does not materially affect the overall learning experience. Cengage Learning reserves the right to remove additional content at any time if subsequent rights restrictions require it.

Value Estimates Versus Market Values
As the discussion above shows, valuation involves a substantial number of assumptions
by analysts. Therefore, the estimates of value will vary from one analyst to the other. The
only way to ensure that one’s estimates are reliable is to make sure that the assumptions
are grounded in the economics of the business being valued. It is also useful to check the
assumptions against the time-series trends for performance ratios discussed in Chapter 6.
While it is quite legitimate for an analyst to make assumptions that differ markedly from
these trends in any given case, it is important for the analyst to be able to articulate the
business and strategy reasons for making such assumptions.
When a company being valued is publicly traded, it is possible to compare one’sown
estimated value with the market value of a company. When an estimated value differs
substantially from a company’s market value, it is useful for the analyst to understand
why such differences arise. A way to accomplish this is to reframe the valuation exercise
to figure out what valuation assumptions are needed to arrive at the observed stock price.
One can then examine whether the market’s assumptions are more or less valid relative to
one’s own assumptions. As we discuss in the next chapter, such an analysis can be invalu-
able in using valuation to make buy or sell decisions in the security analysis context.
In the case of TJX, the observed value of the firm’s equity on February 1, 2011 (the
beginning of TJX’s fiscal year 2011), was $47.94, placing it very close to our Scenario 2
value of $46.15 shown in Table 8-6.
TABL E 8 -6 Equity Valuation Summary for TJX Under Varying Scenarios
($000,000s)
Beginning
Book Value
Value from
Forecasts for
2011–2020
Value from
Forecasts
Beyond 2020
(Terminal Value) Total Value
Value per
Share ($)
1
..............................................................................................................................................................................................
Scenario 1 – Persistent Abnormal
Performance
Abnormal Earnings 3,357.1 8,246.7 12,308.0 23,911.8 61.36
Abnormal ROE 3,357.1 8,246.7 12,308.0 23,911.8 61.36
Free Cash Flows to Equity N/A 8,691.6 15,220.2 23,911.8 61.36
Scenario 2 – Abnormal Returns on
Constant Sales (Real Terms)
Abnormal Earnings 3,357.1 8,246.7 6,381.3 17,985.1 46.15
Abnormal ROE 3,357.1 8,246.7 6,381.3 17,985.1 46.15
Free Cash Flows to Equity N/A 8,766.0 9,219.2 17,985.1 46.15
Scenario 3 – Abnormal Returns on
Constant Sales (Nominal Terms)
Abnormal Earnings 3,357.1 8,246.7 4,076.1 15,680.0 40.24
Abnormal ROE 3,357.1 8,246.7 4,076.1 15,680.0 40.24
Free Cash Flows to Equity N/A 8,848.6 6,831.3 15,680.0 40.24
Scenario 4 – Competitive Equilibrium
Abnormal Earnings 3,357.1 8,246.7 0.0 11,603.8 29.78
Abnormal ROE 3,357.1 8,246.7 0.0 11,603.8 29.78
Free Cash Flows to Equity N/A 8,691.6 2,912.2 11,603.8 29.78
..............................................................................................................................................................................................
1
Shares of TJX outstanding used in the calculation of equity per share 389.7 million per Thomson ONE database, accessed July, 2011.
Source: © Cengage Learning 2013
8-12 PART 2 • Business Analysis and Valuation Tools
Copyright 2012 Cengage Learning. All Rights Reserved. May not be copied, scanned, or duplicated, in whole or in part. Due to electronic rights, some third party content may be suppressed from the eBook and/or eChapter(s).
Editorial review has deemed that any suppressed content does not materially affect the overall learning experience. Cengage Learning reserves the right to remove additional content at any time if subsequent rights restrictions require it.
Sensitivity Analysis
The broad range of estimated equity values shown in Table 8-6 above demonstrates that
changes in assumptions can significantly affect an analyst’sequityvaluationforacompany.
As noted above, the market’s valuation of TJX in early 2011 falls close to our Scenario 2
valuation, indicating that the market expected TJX to be able to continue to generate
abnormal returns beyond the forecast horizon. However, in Chapter 6, we recognized that
the company’s future could play out in multiple ways. If, for instance, TJX is able to resist
the long run pressure for its ROEs to revert to the mean in its U.S. and Canadian markets,
address its problems in Europe, and replicate its U.S. success in other new markets, its
abnormal real returns or even overall abnormal returns could persist beyond the terminal
year, leading to a much higher valuation (see Table 8-6). Alternatively, if the U.S. and
Canadian markets revert toward the mean, the European business fails to recover, and its
model fails to translate successfully to new markets, TJX’s terminal year performance may
be better reflected by reversion to competitive equilibrium. The differences in values of
these scenario values were driven primarily by long-term differences in sales growth and
margins, performance measures that are strongly affected by the forces of competition.
SOME PRACTICAL ISSUES IN VALUATION
The above discussion provides a blueprint for doing valuation. In practice, the analyst
has to deal with a number of other issues that have an important effect on the valuation
task. We discuss below three frequently encountered complications—accounting distor-
tions, negative book values, and excess cash.
Dealing with Accounting Distortions
We know from the discussion in Chapter 7 that accounting methods per se should have
no influence on firm value, despite the fact that abnormal returns and earnings valuation
approaches used here are based on numbers that vary with accounting method choices.
Since accounting choices must affect both earnings and book value, and because of
the self-correcting nature of double-entry bookkeeping (all “distortions” of accounting
must ultimately reverse), estimated values will not be affected by accounting choices, as
long as the analyst recognizes the accounting distortions.
7
When a company uses “biased”
accounting—conservative or aggressive—the analyst needs to recognize the bias to ensure
that value estimates are not biased. If a thorough analysis is not performed, a firm’s
accounting choices can influence analysts’ perceptions of the real performance of the
firm and hence the forecasts of future performance. Accounting choice would affect
expectations of future earnings and cash flows, and distort the valuation, regardless of
whether the valuation is based on DCF or discounted abnormal earnings.
8
For example,
if a firm overstates current revenue growth through aggressive revenue recognition, fail-
ure to appreciate the effect is likely to lead the analyst to overstate future revenues,
affecting both earnings and cash flow forecasts. An analyst who encounters biased
accounting has two choices—either to adjust current earnings and book values to elimi-
nate managers’ accounting biases, or to recognize these biases and adjust future forecasts
accordingly. Whereas both approaches lead to the same estimated firm value, the choice
will have an important impact on what fraction of the firm’s value is captured within the
forecast horizon and what remains in the terminal value.
Holding forecasting horizon and future growth opportunities constant, higher account-
ing quality generally allows a higher fraction of a firm’s value to be captured by the current
book value and the abnormal earnings within the forecasting horizon. Accounting can be
of low quality either because it is unreliable or because it is extremely conservative. If
Prospective Analysis: Valuation Implementation 8-13
Copyright 2012 Cengage Learning. All Rights Reserved. May not be copied, scanned, or duplicated, in whole or in part. Due to electronic rights, some third party content may be suppressed from the eBook and/or eChapter(s).
Editorial review has deemed that any suppressed content does not materially affect the overall learning experience. Cengage Learning reserves the right to remove additional content at any time if subsequent rights restrictions require it.
accounting reliability is a concern, the analyst has to expend resources on “accounting
adjustments.” If accounting is conservative, the analyst is forced to increase the forecasting
horizon to capture a given fraction of a firm’s value or to rely on relatively more uncertain
terminal values estimates for a large fraction of the estimated value.
In the case of TJX, in Chapter 5 we reported the impact on financial ratios and other
measures of firm performance of adjusting for the firm’ s use of off–balance sheet lease
accounting. We saw that the major effects of adjusting for that accounting choice were
to increase earnings in the current period (due to the lower depreciation of the newly
“acquired” assets versus the previously expensed leases), and to significantly increase
both long-term assets and debt (with resultant impact on the related ratios). In valuing
TJX, we have recognized these effects in estimating forecasts for TJX by using adjusted
financials that reflect the full impact of the operating leases. Another way the analyst
could choose to address the issue would be by acknowledging that TJX, with its low
asset base, would be expected to maintain a return on operating assets that resists a full
reversion to the mean. In that case, this strong near-term performance would also result
in less of TJX’s value being reflected in its terminal value.
Dealing with Negative Book Values
A number of firms have negative earnings and/or negative values of book equity. Firms
in the start-up phase have negative equity, as do those in high technology industries.
These firms incur large investments whose payoff is uncertain. Accountants write off
these investments as a matter of conservatism, leading to negative book equity. Examples
of firms in this situation include biotechnology firms, Internet firms, telecommunication
firms, and other high technology firms. A second category of firms with negative book
equity are those that are performing poorly, resulting in cumulative losses exceeding the
original investment by the shareholders.
Negative book equity makes it difficult to use the accounting-based approach to value
a firm’s equity. There are several ways to get around this problem. The first is to value
the firm’s assets (using, for example, abnormal operating ROA or abnormal NOPAT)
rather than equity. Then, based on an estimate of the value of the firm’s debt, one can
estimate the equity value. Another alternative is to “undo” accountants’ conservatism by
capitalizing the investment expenditures written off. This is possible if the analyst is able
to establish that these expenditures are value creating. A third alternative, feasible for
publicly traded firms, is to start from the observed stock price and work backward.
Using reasonable estimates of cost of equity and steady-state growth rate, the analyst
can calculate the average long-term level of abnormal earnings needed to justify the
observed stock price. Then the analytical task can be framed in terms of examining the
feasibility of achieving this abnormal earnings “target.”
It is important to note that the value of firms with negative book equity often consists
of a significant option value. For example, the value of high-tech firms is not only driven
by the expected earnings from their current technologies but also by the payoff from
technology options embedded in their research and development efforts. Similarly, the
value of troubled companies is driven to some extent by the “abandonment option”—
shareholders with limited liability can turn over the firm to debt holders and creditors.
One can use the options theory framework to estimate the value of these “real options.”
Dealing with Excess Cash and Excess Cash Flow
Firms with excess cash balances, or large free cash flows, also pose a valuation challenge.
In our projections for TJX, we implicitly assumed that cash beyond the level required to
finance the company’s operations will be paid out to the firm’s shareholders either in the
8-14
PART 2 • Business Analysis and Valuation Tools
Copyright 2012 Cengage Learning. All Rights Reserved. May not be copied, scanned, or duplicated, in whole or in part. Due to electronic rights, some third party content may be suppressed from the eBook and/or eChapter(s).
Editorial review has deemed that any suppressed content does not materially affect the overall learning experience. Cengage Learning reserves the right to remove additional content at any time if subsequent rights restrictions require it.

form of dividends or stock repurchases. Notice that these cash flows are already incorpo-
rated into the valuation process when they are earned, so there is no need to take them
into account when they are paid out.
It is important to recognize that both the accounting-based valuation and the dis-
counted cash flow valuation assume a dividend payout that can potentially vary from
period to period. This dividend policy assumption is required as long as one wishes to
assume a constant level of financial leverage and stable equity risk used to compute the
cost of equity in the valuation calculations. Firms rarely have such a variable dividend
policy in practice. However, this in itself does not make the valuation approaches invalid,
as long as a firm’s dividend policy does not affect its value. That is, the valuation
approaches assume that the well-known Modigliani-Miller theorem regarding the irrele-
vance of dividends holds.
A firm’s dividend policy can affect its value if managers do not invest free cash flows
optimally. For example, if a firm’s managers use excess cash to undertake value-
destroying acquisitions, then our approach overestimates the firm’s value. Firms that
suffer from such “agency” costs are likely to have ineffective corporate governance (dis-
cussed in chapter 12). One approach that the analyst can use to reflect these types of
concerns into a valuation is to first estimate the firm value according to the approach
described earlier and then adjust the estimated value for whatever agency costs the
firm’s managers may impose on its investors.
SUMMARY
We illustrate in this chapter how to apply the valuation theory discussed in Chapter 7.
The chapter explains the set of business and financial assumptions one needs to make to
conduct the valuation exercise. It also illustrates the mechanics of making detailed valua-
tion forecasts and terminal values of earnings, free cash flows, and accounting rates of
return. We discuss how to compute the cost of equity. Using a detailed example, we
show how a firm’s equity value can be computed using earnings, cash flows, and rates
of return. Finally, we offer ways to deal with some commonly encountered practical
issues, including accounting distortions, negative book values, and excess cash balances.
DISCUSSION QUESTIONS
1. How will the forecasts in Table 8-2 change if TJX maintains a sales growth rate of
10 percent per year from 2011 to 2020 (and all the other assumptions are kept
unchanged)?
2. Recalculate the forecasts in Table 8-2, assuming that the NOPAT profit margin is
held steady for the first five years of the forecast and then declines by 0.1 percentage
points per year thereafter (keeping all the other assumptions unchanged).
3. Recalculate the forecasts in Table 8-3, assuming that the ratio of net operating work-
ing capital to sales is 3 percent and the ratio of net long-term assets to sales is
33.4 percent for all the years from fiscal 2011 to fiscal 2020. Keep all the other
assumptions unchanged.
4. Calculate TJX’s cash payouts to its shareholders in the years 2011–2020 that are
implicitly assumed in the projections in Table 8-2.
5. How will the abnormal earnings calculations in Table 8-3 change if the cost of
equity assumption is changed to 12 percent?
Prospective Analysis: Valuation Implementation 8-15
Copyright 2012 Cengage Learning. All Rights Reserved. May not be copied, scanned, or duplicated, in whole or in part. Due to electronic rights, some third party content may be suppressed from the eBook and/or eChapter(s).
Editorial review has deemed that any suppressed content does not materially affect the overall learning experience. Cengage Learning reserves the right to remove additional content at any time if subsequent rights restrictions require it.

6. What would be the total equity value (as calculated for scenarios in Table 8-6 using
abnormal earnings) if the sales growth in years 2021 and beyond is 8.5 percent and
the company is able to generate abnormal returns at the same level as in fiscal 2020
forever (keeping all the other assumptions in the table unchanged)?
7. Calculate the proportion of terminal value to total estimated value of equity under
the abnormal earnings method and the discounted cash flow method for the Sce-
nario 2 results shown in Table 8-6. Why are these proportions different?
8. What will TJX’s cost of equity be if the equity market risk premium is 5 percent?
9. Assume that TJX changes its capital structure so that its market value weight of debt
to capital increases to 30 percent, and its after-tax interest rate on debt at this new
leverage level is 3.5 percent. Assume that the equity market risk premium is 6.7 per-
cent. What will be the cost of equity at the new debt level? What will be the new
weighted average cost of capital?
10. Nancy Smith says she is uncomfortable making the assumption that TJX’s dividend
payout will vary from year to year. If she makes a constant dividend payout assump-
tion, what changes does she have to make in her other valuation assumptions to
make them internally consistent with each other?
NOTES
1. See T. Copeland, T. Koller, and J. Murrin, Valuation: Measuring and Managing the
Value of Companies, 2nd edition (New York: John Wiley & Sons, 1994). Theory calls
for the use of a short-term rate, but if that rate is used here, a difficult practical
question rises: how does one reflect the premium required for expected inflation
over long horizons? While the premium could, in principle, be treated as a portion
of the term [E(rm) – rf], it is probably easier to use an intermediate- or long-term
riskless rate that presumably reflects expected inflation.
2. One way to estimate systematic risk is to regress the firm’s stock returns over some
recent time period against the returns on the market index. The slope coefficient
represents an estimate of β. More fundamentally, systematic risk depends on how
sensitive the firm’s operating profits are to shifts in economy-wide activity, and the
firm’s degree of leverage. Financial analysis that assesses these operating and finan-
cial risks should be useful in arriving at reasonable estimates of β
3. These betas are typically estimated by regressing five years of daily firm stock
returns on the return on a market index, such as the Standard & Poor’s 500. These
estimates can be heavily influenced by extremely positive or negative firm-specific
news (and stock returns) during the five-year estimation period, generating betas
that are implausibly high or low. Since it uses a more complex estimation approach,
Value Line betas are less likely to be subject to these biases and are used throughout
this book.
4. The average return reported here is the arithmetic mean as opposed to the geomet-
ric mean. Ibbotson and Associates explain why this estimate is appropriate in this
context (see Stocks, Bonds, Bills, and Inflation, 2010 Yearbook, Chicago).
5. See W. Gebhardt, C. Lee, and B. Swaminathan, “Toward an Implied Cost of Capi-
tal,” Journal of Accounting Research 39, no. 1 (2001): 135–176; and J. Claus and J.
Thomas, “ The Equity Premium Is Much Lower Than You Think It Is: Empirical
Estimates from a New Approach,” Journal of Finance 56 (2001): 1,629–1,666.
6. For TJX, adjustments to bring the operating leases onto the balance sheet change the
company’s leverage and other capital structure ratios from those reported. However,
we do not consider it necessary to re-estimate TJX’s cost of debt and equity for these
8-16
PART 2 • Business Analysis and Valuation Tools
Copyright 2012 Cengage Learning. All Rights Reserved. May not be copied, scanned, or duplicated, in whole or in part. Due to electronic rights, some third party content may be suppressed from the eBook and/or eChapter(s).
Editorial review has deemed that any suppressed content does not materially affect the overall learning experience. Cengage Learning reserves the right to remove additional content at any time if subsequent rights restrictions require it.

changes since the adjustments are made to provide a better economic picture of the
firm’s current capital structure, not to change TJX’s capital structure. The implicit
assumption underlying this approach is that estimates of the firm’s equity and debt
beta risks reflect its current economic capital structure, rather than that reported.
Given that rating agencies typically make adjustments to increase leverage for the
effect of debt from operating leases, this seems a reasonable assumption.
7. Valuation based on discounted abnormal earnings does require one property of the
forecasts: that they be consistent with “clean surplus accounting.” Such accounting
requires the following relation:
End-of-period book value ¼ Beginning book value earnings dividends
capital contributions/withdrawals
Clean surplus accounting rules out situations where some gain or loss is excluded
from earnings but is still used to adjust the book value of equity. For example, under
U.S. GAAP, gains and losses on foreign currency translations are handled this way.
In applying the valuation technique described here, the analyst would need to devi-
ate from GAAP in producing forecasts and treat such gains/losses as a part of earn-
ings. However, the technique does not require that clean surplus accounting has
been applied in the past—so the existing book value, based on U.S. GAAP or any
other set of principles, can still serve as the starting point. All the analyst has to do
is apply clean surplus accounting in his/her forecasts, which is not only easy but also
is usually the natural thing to do anyway.
8. It is important to recognize that when the analyst uses the “indirect” cash flow fore-
casting method, undetected accounting biases can influence not only future earnings
forecasts but also future free cash flow forecasts. In the current example, since
accounts receivables are overstated, the analyst will assume that they will be col-
lected as cash in some future period, leading to a higher future cash flow estimate.
APPENDIX Estimating TJX’s Overall Asset Value
Our primary focus in this chapter has been on valuing TJX’s equity. But it can also be
useful for the analyst to value the firm’ s assets. As we discussed in Chapter 7, under the
different approaches to valuation, the key forecasts required to convert the financial fore-
casts shown in Tables 8-1 and 8-2 into estimates of asset value are the following:
• Abnormal NOPAT: NOPAT less total net capital at the beginning of the year times
the weighted average cost of capital;
• Abnormal operating ROA: the difference between operating ROA and the weighted
average cost of capital; or
• Free cash flows to capital: NOPAT less the increase in operating working capital
less the increase in new long-term assets.
In the same way that we used the cost of equity to discount TJX’s forecasted equity
performance and value its equity, we need to come up with a cost of all capital provided,
termed the weighted average cost of capital (WACC), to discount the forecasts of asset
performance and value its assets. As discussed in Appendix D of Chapter 7, the weighted
average cost of capital (WACC) is used to discount the abnormal earnings or free
cash flows to all investors in the company. WACC is the average cost to a firm of obtain-
ing capital from both debt and equity sources. It is, literally, the weighted after-tax cost
of debt financing (i.e., the return required by providers of debt to the firm on an after-
tax basis) and the weighted return required by equity providers, where the weights are
Prospective Analysis: Valuation Implementation 8-17
Copyright 2012 Cengage Learning. All Rights Reserved. May not be copied, scanned, or duplicated, in whole or in part. Due to electronic rights, some third party content may be suppressed from the eBook and/or eChapter(s).
Editorial review has deemed that any suppressed content does not materially affect the overall learning experience. Cengage Learning reserves the right to remove additional content at any time if subsequent rights restrictions require it.

the percentages of debt and equity (at their fair or market values) to the enterprise mar-
ket value.
To estimate the WACC for TJX, we start with the assumption that its pre-tax cost of
debt is 4.4 percent, based on the average yield of similarly rated company debt during
2010 (we discuss this in more detail in Chapter 10). Given TJX’s marginal tax rate of
38 percent, the after-tax cost of debt is 2.7 percent [4.4% (138%)]. As discussed in
the chapter, TJX’s cost of equity is estimated at 8.8 percent, reflecting the company’s
equity beta of 0.8, the ten-year Treasury bond yield of 3.4 percent, and the historical
risk premium for equities of 6.7 percent.
TJX’s estimated equity value seen in our Scenario 2 estimate detailed above (which
most closely tracks actual equity market value during the same time period) was $18.0 bil-
lion; its net book debt (using our adjusted numbers) was $4.5 billion. Using these numbers
we can calculate the “market value” weights of debt and equity in the company’scapital
structure as 20 percent and 80 percent respectively. Given these weightings and the costs
of equity and debt, TJX’s WACC in February 2011 is estimated at 7.6 percent.
TJX’s Weighted Average Cost of Capital
Cost of funds Market Weighting = Weighted cost
...............................................................................................................
Debt 2.7% 20.0% 0.6%
Equity 8.8% 80.0% 7.0%
Capital 7.6%
.................................................................................................................
Now that we have estimated TJX’s WACC, we can forecast the variables needed to
compute an overall asset value for TJX. Table A-1 shows forecasts for the three financial
statement variables— abnormal NOPAT, abnormal operating ROA, and free cash flow to
capital—for the ten-year period 2011 to 2020.
To derive cash flows in 2020, we need to make assumptions about the sales growth
rate and balance sheet ratios in 2021. The cash flow forecasts shown in Table A-1 are
based on the assumption that the sales growth and beginning balance sheet ratios will
track those shown in Scenario 2 above, which assumes a sales growth rate of 3.0 percent
with other beginning balance sheet ratios remaining the same as in 2020.
To complete our analysis, Table A-2 shows the estimated value of TJX’s assets using the
three methods discussed in Chapter 7 for Scenario 2 (abnormal returns on constant sales)
shown in the body of the chapter. To compute this value, TJX’s performance forecasts in
Table A-1 and its terminal value forecast for Scenario 2 are discounted at the weighted
TABLE A-1 Asset Valuation Performance Forecasts for TJX
Forecast year 2011 2012 2013 2014 2015 2016 2017 2018 2019 2020
.................................................................................................................................................................................................
Abnormal NOPAT 1,235.0 1,200.0 1,174.2 1,136.7 1,086.3 1,022.2 943.3 812.6 661.2 488.2
Abnormal
operating ROA
15.6% 13.9% 12.6% 11.3% 10.1% 8.8% 7.6% 6.1% 4.7% 3.3%
Free cash flow
to capital
1,077.5 1,173.7 1,165.2 1,147.7 1,120.5 1,082.8 1,033.8 936.6 822.5 1,173.6
Asset discount
factor
0.93 0.86 0.80 0.75 0.69 0.65 0.60 0.56 0.52 0.48
Asset growth
factor
1.00 1.10 1.18 1.27 1.37 1.47 1.57 1.68 1.79 1.90
.................................................................................................................................................................................................
Source: © Cengage Learning 2013
8-18 PART 2 • Business Analysis and Valuation Tools
Copyright 2012 Cengage Learning. All Rights Reserved. May not be copied, scanned, or duplicated, in whole or in part. Due to electronic rights, some third party content may be suppressed from the eBook and/or eChapter(s).
Editorial review has deemed that any suppressed content does not materially affect the overall learning experience. Cengage Learning reserves the right to remove additional content at any time if subsequent rights restrictions require it.

average cost of capital of 7.6 percent. These discounted forecasts are then summed and
combined with beginning book value of net operating assets (except in the free cash
flows to equity calculation, which does not depend on beginning book value) to arrive at
a total estimated value of TJX’s assets under Scenario 2 of $20.2 billion.
Finally, by deducting the book value of debt ($4.5 billion), the analyst can generate
the implied value of the equity under Scenario 2. This equity valuation is different from
that reported in Table 8-6 in this chapter, when we valued equity directly. Several factors
underlie the difference. First, the asset valuation uses the value of equity, an output of the
analysis, as an input to compute the WACC. If the computed equity value differs from
that used to estimate WACC, there is an internal inconsistency in the analysis. This can
be resolved by re-running the valuation, discounting the forecasts of asset profits / cash
flows using the value of equity from the first estimation in generating a new WACC.
This process can be repeated until the equity weight used in the WACC computation
and the final asset/equity valuation converge.
A second explanation for the valuation difference is that the book value of assets, used
to compute TJX’s WACC, is only an approximation of the market or fair value of debt.
The average coupon rate TJX pays on its outstanding debt is 5.5 percent, which exceeds
the current pre-tax cost of debt of 4.4 percent, implying that the market value of its debt
exceeds its book value and that TJX’s actual WACC is lower than the estimate used in
the above analysis.
Given these challenges in determining economic leverage, we recommend valuing
equity directly as we did in the body of the chapter.
TABL E A -2 Asset Valuation Summary for TJX Under Scenario 2
($000,000s)
Beginning
Book Value
Value from
Forecasts for
2011–2020
Value from
Forecasts
Beyond 2020
(Terminal Value) Total Value
....................................................................................................................................................
Scenario 2 – Abnormal
Returns on Constant Sales
(Real Terms)
Abnormal NOPAT 7,898.5 6,991.2 5,317.9 20,207.6
Abnormal Operating ROA 7,898.5 6,991.2 5,317.9 20,207.6
Free Cash Flows to Capital N/A 7,423.8 12,783.8 20,207.6
....................................................................................................................................................
Source: © Cengage Learning 2013
Prospective Analysis: Valuation Implementation 8-19
Copyright 2012 Cengage Learning. All Rights Reserved. May not be copied, scanned, or duplicated, in whole or in part. Due to electronic rights, some third party content may be suppressed from the eBook and/or eChapter(s).
Editorial review has deemed that any suppressed content does not materially affect the overall learning experience. Cengage Learning reserves the right to remove additional content at any time if subsequent rights restrictions require it.

PART
3
BUSINESS ANALYSIS AND
VALUATION
APPLICATIONS
CHAPTER 9
Equity Security Analysis
CHAPTER 10
Credit Analysis and Distress Prediction
CHAPTER 11
Mergers and Acquisitions
CHAPTER 12
Communication and Governance
Copyright 2012 Cengage Learning. All Rights Reserved. May not be copied, scanned, or duplicated, in whole or in part. Due to electronic rights, some third party content may be suppressed from the eBook and/or eChapter(s).
Editorial review has deemed that any suppressed content does not materially affect the overall learning experience. Cengage Learning reserves the right to remove additional content at any time if subsequent rights restrictions require it.

Chapter
9
EQUITY SECURITY
ANALYSIS
E
quity security analysis is the evaluation of a firm and its prospects from the
perspective of a current or potential investor in the firm’s stock. Security
analysis is, however, just one step in a larger investment process that involves
(1) establishing the objectives of the investor, (2) forming expectations about the future
returns and risks of individual securities, and then (3) combining individual securities
into portfolios to maximize progress toward the investment objectives.
Security analysis is the foundation for the second step of projecting future returns and
assessing risk. Security analysis is typically conducted with an eye toward identifying
mispriced securities in the hopes of generating returns that more than compensate the
investor for risk. However, that need not be the case. For analysts who do not have a
comparative advantage in identifying mispriced securities, the focus should be on
gaining an appreciation for how a security would affect the risk of a given portfolio
and whether it fits the profile that the portfolio is designed to maintain.
Security analysis is undertaken by individual investors, by analysts at brokerage
houses and investment banks (sell-side analysts), and by analysts that work at the
direction of fund managers for various institutions (buy-side analysts). The institutions
employing buy-side analysts include mutual funds, hedge funds, insurance companies,
universities, and others.
A variety of questions are dealt with in security analysis:
• A sell-side analyst asks: Is the industry I am covering attractive, and if so why?
How do different firms within the industry position themselves? What are the
implications for my earnings forecasts? Given my expectations for a firm, does its
stock appear to be mispriced? Should I recommend this stock as a buy, a sell, or a
hold?
• A buy-side analyst for a “value stock fund ” asks: Does this stock possess the
characteristics we seek in our fund; that is, does it have a relatively low ratio of
price–earnings, low price-to-book value, and other fundamental indicators? Do its
prospects for earnings improvement suggest good potential for high future returns
on the stock?
• An individual investor asks: Does this stock present the risk profile that suits my
investment objectives? Does it enhance my ability to diversify the risk of my port-
folio? Is the firm’s dividend payout rate low enough to minimize my tax liability
while I continue to hold the stock?
9-3
Copyright 2012 Cengage Learning. All Rights Reserved. May not be copied, scanned, or duplicated, in whole or in part. Due to electronic rights, some third party content may be suppressed from the eBook and/or eChapter(s).
Editorial review has deemed that any suppressed content does not materially affect the overall learning experience. Cengage Learning reserves the right to remove additional content at any time if subsequent rights restrictions require it.
As the above questions underscore, there is more to security analysis than estimating
the value of stocks. Nevertheless, for most sell-side and buy-side analysts, the key goal
remains the identification of mispriced stocks.
INVESTOR OBJECTIVES AND INVESTMENT VEHICLES
The investment objectives of individual savers in the economy are highly idiosyncratic.
For any given saver they depend on factors such as income, age, wealth, tolerance for
risk, and tax status. For example, savers with many years until retirement are likely to
prefer to have a relatively large share of their portfolio invested in equities, which offer
a higher expected return than fixed income (or debt) securities and higher short-term
variability. Investors in high tax brackets are likely to prefer to have a large share of
their portfolio in stocks that generate tax-deferred capital gains rather than stocks that
pay dividends or interest-bearing securities.
Mutual funds (or unit trusts as they are termed in some countries) have become pop-
ular investment vehicles for savers to achieve their investment objectives. Mutual funds
sell shares in professionally managed portfolios that invest in specific types of stocks
and/or fixed income securities. They therefore provide a low-cost way for savers to invest
in a portfolio of securities that reflects their particular appetite for risk.
The major classes of mutual fund include (1) money market funds that invest in CDs
and treasury bills, (2) bond funds that invest in debt instruments, (3) equity funds that
invest in equity securities, (4) balanced funds that hold money market, bond, and equity
securities, and (5) real estate funds that invest in commercial real estate. Within the bond
and equities classes of funds, however, there are wide ranges of fund types. For example,
bond funds include
• Corporate bond funds that invest in investment-grade rated corporate debt
instruments,
• High yield funds that invest in non-investment-grade rated corporate debt,
• Mortgage funds that invest in mortgage-backed securities, and
• Municipal funds that invest in municipal debt instruments, which generate income
that can be exempt from federal and often state and local taxes.
Equity funds include
• Income funds that invest in stocks that are expected to generate dividend income,
• Growth funds that invest in stocks expected to generate long-term capital gains,
• Income and growth funds that invest in stocks that provide a balance of dividend
income and capital gains,
• Value funds that invest in equities that are considered to be undervalued,
• Short funds that sell short equity securities that are considered to be overvalued,
• Index funds that invest in stocks that track a particular market index, such as the
S&P 500,
• Size-based funds that invest based on the market capitalization of the company,
such as large-cap and small-cap funds,
• Sector funds that invest in stocks in a particular industry segment, such as the tech-
nology or health sciences sectors, and
• Regional funds that invest in equities from a particular country or geographic
region, such as Japan, Europe, or the Asia-Pacific region.
Since the 1990s, hedge funds have gained increased prominence, and the assets
controlled by these funds have grown significantly. While generally open only to institu-
tional investors and certain qualified wealthy individuals, hedge funds are becoming
9-4
PART 3 • Business Analysis and Valuation Applications
Copyright 2012 Cengage Learning. All Rights Reserved. May not be copied, scanned, or duplicated, in whole or in part. Due to electronic rights, some third party content may be suppressed from the eBook and/or eChapter(s).
Editorial review has deemed that any suppressed content does not materially affect the overall learning experience. Cengage Learning reserves the right to remove additional content at any time if subsequent rights restrictions require it.
an increasingly important force in the market. Hedge funds employ a variety of invest-
ment strategies including
• Market neutral funds that typically invest equal amounts of money in purchasing
undervalued securities and shorting overvalued ones to neutralize market risk,
• Short-selling funds, which short sell the securities of companies that they believe
are overvalued, and
• Special situations funds that invest in undervalued securities in anticipation of an
increase in value resulting from a favorable turn of events.
These fund types employ very different strategies. But for many, fundamental analysis
of companies is the critical task. This chapter focuses on applying the tools we have
developed in Part 2 of the book to analyze equity securities.
EQUITY SE CURITY ANALYSIS AND MARKET EFFICIENCY
How a security analyst should invest his or her time depends on how quickly and effi-
ciently information flows through markets and becomes reflected in security prices. In
the extreme, information would be reflected in security prices fully and immediately
upon its release. This is essentially the condition posited by the efficient markets hypothesis.
This hypothesis states that security prices reflect all available information, as if such infor-
mation could be costlessly digested and translated immediately into demands for buys or
sells without regard to frictions imposed by transaction costs. Under such conditions, it
would be impossible to identify mispriced securities on the basis of public information.
In a world of efficient markets, the expected return on any equity security is just
enough to compensate investors for the unavoidable risk the security involves. Unavoid-
able risk is that which cannot be “diversified away ” simply by holding a portfolio of
many securities. Given efficient markets, the investor’s strategy shifts away from the
search for mispriced securities and focuses instead on maintaining a well-diversified
portfolio. Aside from this, the investor must arrive at the desired balance between risky
securities and risk-free short-term government bonds. The desired balance depends on
how much risk the investor is willing to bear for a given increase in expected returns.
The above discussion implies that investors who accept that stock prices already
reflect available information have no need for analysis involving a search for mispriced
securities. If all investors adopted this attitude, of course no such analysis would be con-
ducted, mispricing would go uncorrected, and markets would no longer be efficient!
1
This is why the efficient markets hypothesis cannot represent an equilibrium in a strict
sense. In equilibrium there must be just enough mispricing to provide incentives for the
investment of resources in security analysis.
The existence of some mispricing, even in equilibrium, does not imply that it is sensi-
ble for just anyone to engage in security analysis. Instead, it suggests that securities
analysis is subject to the same laws of supply and demand faced in all other competitive
industries: it will be rewarding only for those with the strongest comparative advantage.
How many analysts are in that category depends on a number of factors, including the
liquidity of a firm’s stock and investor interest in the company.
2
For the smallest publicly
traded firms in the United States, there is typically no formal following by analysts, and
would-be investors and their advisors are left to form their own opinions on a stock.
Recent research shows a trend of reduced sell-side analyst coverage following new regu-
lations for investment banks following the scandals of the late 1990s.
3
Coverage of IBM,
for example, has declined from about 40 sell-side professional analysts in March 2003 to
32 analysts in October 2011. This decline has been at least partially offset by an increase
in the number of analysts employed on the buy-side.
Equity Security Analysis 9-5
Copyright 2012 Cengage Learning. All Rights Reserved. May not be copied, scanned, or duplicated, in whole or in part. Due to electronic rights, some third party content may be suppressed from the eBook and/or eChapter(s).
Editorial review has deemed that any suppressed content does not materially affect the overall learning experience. Cengage Learning reserves the right to remove additional content at any time if subsequent rights restrictions require it.
Market Efficiency and the Role of Financial Statement Ana lysis
The degree of market efficiency that arises from competition among analysts and other
market agents is an empirical issue addressed by a large body of research spanning the
last three decades. Such research has important implications for the role of financial
statements in security analysis. Consider, for example, the implications of an extremely
efficient market, where information is fully impounded in prices within minutes of its
revelation. In such a market, agents could profit from digesting financial statement
information in two ways. First, the information would be useful to the select few
who receive newly announced financial data, interpret it quickly, and trade on it
within minutes. Second, and probably more important, the information would be use-
ful for gaining an understanding of the firm, so as to place the analyst in a better
position to interpret future news (from financial statements as well as other sources)
as it arrives.
On the other hand, if securities prices fail to reflect financial statement data fully, even
days or months after its public revelation, market agents could profit from such data by
creating trading strategies designed to exploit any systematic ways in which the publicly
available data are ignored or discounted in the price-setting process.
Market Efficiency and Manager s’ Financial Reporting Strateg ies
The degree to which markets are efficient also has implications for managers’ approaches
to communicating with their investment communities. The issue becomes most impor-
tant when the firm pursues an unusual strategy, or when the usual interpretation of
financial statements would be misleading in the firm’s context. In such a case, the com-
munication avenues that managers can successfully pursue depend not only on manage-
ment’s credibility but also on the degree of understanding present in the investment
community. We will return to the issue of management communications in more detail
in Chapter 12.
Evidence of Market Efficiency
There is an abundance of evidence consistent with a high degree of efficiency in the
primary U.S. securities markets.
4
In fact, during the 1960s and 1970s, the evidence
was so one-sided that the efficient markets hypothesis gained widespread acceptance
wit hin the aca demi c community and h ad a ma jor impact on the practicing community
as well.
Evidence pointing to very efficient securities markets comes in several forms:
• When information is announced publicly, the markets react very quickly.
• It is difficult to identify specific funds or analysts who have consistently generated
abnormally high returns.
• A number of studies suggest that stock prices reflect a rather sophisticated level of
fundamental analysis.
While a large body of evidence consistent with efficiency exists, recent years have
witnessed a re-examination of the once widely accepted thinking. A sampling of the
research includes the following:
• On the issue of the speed of stock price response to news, a number of studies
suggest that even though prices react quickly, the initial reaction tends to be
incomplete.
5
• A number of studies point to trading strategies that could have been used to out-
perform market averages.
6
9-6 PART 3 • Business Analysis and Valuation Applications
Copyright 2012 Cengage Learning. All Rights Reserved. May not be copied, scanned, or duplicated, in whole or in part. Due to electronic rights, some third party content may be suppressed from the eBook and/or eChapter(s).
Editorial review has deemed that any suppressed content does not materially affect the overall learning experience. Cengage Learning reserves the right to remove additional content at any time if subsequent rights restrictions require it.
• Related evidence—still subject to ongoing debate about its proper interpretation—
suggests that even though market prices reflect some relatively sophisticated analy-
sis, prices still do not fully reflect all the information that could be garnered from
publicly available financial statements.
7
The controversy over the efficiency of securities markets is unlikely to be resolved
soon. However, there are some lessons that are accepted by most researchers. First, secu-
rities markets not only reflect publicly available information, but they also anticipate
much of it before it is released. The open question is what fraction of the response
remains to be impounded in price once the day of the public release comes to a close.
Second, even in most studies that suggest inefficiency, the degree of mispricing is rela-
tively small for large stocks.
Finally, even if some of the evidence is currently difficult to align with the efficient
markets hypothesis, it remains a useful benchmark (at a minimum) for thinking about
the behavior of security prices. The hypothesis will continue to play that role unless it
can be replaced by a more complete theory. Some researchers are developing theories
that encompass the existence of market agents who are forced to trade for unpredictable
“liquidity” reasons, and prices that differ from so-called “fundamental values,” even in
equilibrium.
8
Also, behavioral finance models recognize that cognitive biases can affect
investor behavior.
9
APPROACHES TO FUND MANAGEMENT
AND SECURITIE S ANALYSIS
Approaches used in practice to analyze securities and manage funds are quite varied.
One dimension of variation is the extent to which the investments are actively or pas-
sively managed. Another is whether a quantitative or a traditional fundamental approach
is used. Security analysts also vary considerably in terms of whether they produce formal
or informal valuations of the firm.
Active Versus Passive Management
Active portfolio management relies heavily on security analysis to identify mispriced
securities. The passive portfolio manager serves as a price taker, avoiding the costs of
security analysis and turnover while typically seeking to hold a portfolio designed to
match some overall market index or sector performance. Combined approaches are also
possible. For example, one may actively manage 20 percent of a fund balance while
passively managing the remainder. The widespread growth of passively managed funds
in the United States over the past 20 years serves as testimony to the growing belief
that it is difficult to consistently earn returns that are superior to broad market indices
such as the S&P 500 Index.
Quantitative Versus Traditiona l Fundamental Analysis
Actively managed funds must depend on some form of security analysis. Some funds
employ technical analysis, which attempts to predict stock price movements on the
basis of market indicators (prior stock price movements, volume of shares traded, etc.).
In contrast, fundamental analysis, the primary approach for security analysis, attempts to
evaluate the current market price relative to projections of the firm’s future earnings and
cash-flow generating potential. Fundamental analysis involves all the steps described in
the previous chapters of this book: business strategy analysis, accounting analysis, finan-
cial analysis, and prospective analysis (forecasting and valuation). In recent years, some
Equity Security Analysis 9-7
Copyright 2012 Cengage Learning. All Rights Reserved. May not be copied, scanned, or duplicated, in whole or in part. Due to electronic rights, some third party content may be suppressed from the eBook and/or eChapter(s).
Editorial review has deemed that any suppressed content does not materially affect the overall learning experience. Cengage Learning reserves the right to remove additional content at any time if subsequent rights restrictions require it.
analysts have supplemented traditional fundamental analysis, which involves a substan-
tial amount of subjective judgment, with more quantitative approaches.
The quantitative approaches themselves are quite varied. Some involve simply
“screening” stocks on the basis of some set of factors, such as trends in analysts’ earnings
revisions, price-earnings ratios, price-to-book ratios, and so on. Whether such
approaches are useful depends on the degree of market efficiency relative to the screens.
Quantitative approaches can also involve implementation of some formal model to pre-
dict future stock returns. Longstanding statistical techniques such as regression analysis
and probit analysis can be used, as can more recently developed, computer-intensive
techniques such as neural network analysis. Again, the success of these approaches
depends on the degree of market efficiency and whether the analysis can exploit infor-
mation in ways not otherwise available to market agents as a group.
Quantitative approaches play a more important role in security analysis today than
they did a decade or two ago. However, by and large, analysts still rely primarily on fun-
damental analysis involving complex human judgments.
Formal Versus Informal Va luation
Full-scale, formal valuations based on the methods described in Chapter 7 have become
more common in recent years. However, less formal approaches are also popular. For
example, an analyst can compare his or her long-term earnings projection with the con-
sensus forecast to generate a buy or sell recommendation. Another possible approach,
that might be labeled “marginalist,” involves no attempt to value the firm. The analyst
simply assumes that if he or she has unearthed favorable (or unfavorable) information
believed not to be recognized by others, the stock should be bought (or sold).
Unlike many security analysts, investment bankers produce formal valuations as a
matter of course. Investment bankers, who estimate values for the purpose of bringing
a private firm to the public market, for evaluating a merger or buyout proposal, for issu-
ing a fairness opinion or for making a periodic managerial review, must document their
valuation in a way that can readily be communicated to management and, if necessary,
to the courts.
THE PROCESS OF COMPREHENS IVE SECURITY ANALYSIS
Given the variety of approaches practiced in security analysis, it is impossible to summarize
all of them here. Instead, we briefly outline steps to be included in a comprehensive security
analysis. The amount of attention focused on any given step varies among analysts.
Selection of Candidates for Analy sis
No analyst can effectively investigate more than a small fraction of the securities on a
major exchange, and thus some approach to narrowing the focus must be employed.
Sell-side analysts are often organized within an investment house by industry or sector.
Thus they tend to be constrained in their choices of firms to follow. However, from the
perspective of a fund manager or an investment firm as a whole, there is usually the free-
dom to focus on any firm or sector.
As noted earlier, funds typically specialize in investing in stocks with certain risk
profiles or characteristics (e.g., growth stocks, “value” stocks, technology stocks, and
cyclical stocks). Managers of these types of funds seek to focus the energies of their
analysts on identifying stocks that fit their fund objective. In addition, individual inves-
tors who seek to maintain a well-diversified portfolio without holding many stocks also
9-8
PART 3 • Business Analysis and Valuation Applications
Copyright 2012 Cengage Learning. All Rights Reserved. May not be copied, scanned, or duplicated, in whole or in part. Due to electronic rights, some third party content may be suppressed from the eBook and/or eChapter(s).
Editorial review has deemed that any suppressed content does not materially affect the overall learning experience. Cengage Learning reserves the right to remove additional content at any time if subsequent rights restrictions require it.

need information about the nature of a firm’s risks and how they fit with the risk profile
of their overall portfolio.
An alternative approach to stock selection is to screen firms on the basis of some
potential mispricing followed by a detailed analysis of only those stocks that meet the
specified criteria. For example, one fund managed by a large U.S. insurance company
screens stocks on the basis of recent “earnings momentum” as reflected in revisions in
the earnings projections of sell-side and buy-side analysts. Upward revisions trigger
investigations for possible purchase. The fund operates on the belief that earnings
momentum is a positive signal of future price movements. Another fund complements
the earnings momentum screen with one based on recent short-term stock price move-
ments, in the hopes of identifying earnings revisions not yet reflected in stock prices.
Key Analysis Questions
Depending on whether fund managers follow a strategy of targeting stocks with
specific types of characteristics, or of screening stocks that appear to be mispriced,
the following types of questions are likely to be useful:
• What is the risk profile of a firm? How volatile is its earnings stream and
stock price? What are the most likely bad outcomes in the future? What is
the upside potential? How closely linked are the firm’s risks to the health of
the overall economy? Are the risks largely diversifiable, or are they systematic?
• Does the firm possess the characteristics of a growth stock? What is the
expected pattern of sales and earnings growth for the coming years? Is the
firm reinvesting most or all of its earnings?
• Does the firm match the characteristics desired by “income funds”?Isita
mature or maturing company, prepared to “harvest” profits and distribute
them in the form of high dividends?
• Is the firm a candidate for a “value fund”? Does it offer measures of earnings,
cash flow, and book value that are high relative to the price? What specific
screening rules can be implemented to identify misvalued stocks?
Inferring Market Expectations
If the security analysis is conducted with an eye toward the identification of mispricing,
it must ultimately involve a comparison of the analyst’s expectations with those of “the
market.” One possibility is to view the observed stock price as the reflection of market
expectations and to compare the analyst’s own estimate of value with that price. How-
ever, a stock price is only a “summary statistic.” It is useful to have a more detailed
idea of the market’s expectations about a firm’s future performance, expressed in terms
of sales, earnings, and other measures. For example, assume that an analyst has devel-
oped new insights about a firm’s near-term sales. Whether those insights represent new
information for the stock market, and whether they indicate that a “buy” recommenda-
tion is appropriate, can be easily determined if the analyst knows the market consensus
sales forecast.
Around the world a number of agencies summarize analysts’ forecasts of sales and
earnings. Forecasts for the next year or two are commonly available, and for many
firms, a “long-run” earnings growth projection is also available—typically for three to
five years. Some financial information providers in the United States provide continuous
Equity Security Analysis 9-9
Copyright 2012 Cengage Learning. All Rights Reserved. May not be copied, scanned, or duplicated, in whole or in part. Due to electronic rights, some third party content may be suppressed from the eBook and/or eChapter(s).
Editorial review has deemed that any suppressed content does not materially affect the overall learning experience. Cengage Learning reserves the right to remove additional content at any time if subsequent rights restrictions require it.
online updates to such data, so if an analyst revises a forecast, that revision can be made
known to fund managers and other analysts within seconds.
As useful as analysts’ forecasts of sales and earnings are, they do not represent a com-
plete description of expectations about future performance, and there is no guarantee
that consensus analyst forecasts are the same as those reflected in market prices. Further,
financial analysts typically forecast performance for only a few years, so it is helpful to
understand what types of long-term forecasts are reflected in stock prices. Armed with
the model in Chapters 7 and 8 that expresses price as a function of future cash flows or
earnings, an analyst can draw some educated inferences about the expectations embed-
ded in stock prices.
For example, consider the valuation of General Electric Company (GE ), the global
diversified te chnology, servi ces, and finance company. On June 30, 2011, GE’sstock
price close d at $18.86, giving it a market capitalization of $199.9 billion. Earning s per
share (EPS) had declined from $2.20 in fiscal year 2007 to $1.06 in fiscal year 2010.
The stock price h ad fallen more than 50 percent since early 2007, significantly under -
performing other global ind ustrial conglomerates such as Honeywell (32 percent
increase), 3M (25 percent increase), United Technologies (44 percent increase),
and Danaher Corporation (54 percen t increase).
10
An article in Fortune Magazine in
February 2011 titled, “Grading Jeff Immelt,” noted the difficult first ten years of his
tenure as CEO an d compared current GE me trics against those of the company when
Immel t took over from previous CEO Jack Welch.
11
However, analysts were encour-
aged as 2011 p rogressed, as GE reduced its financial services operations and increased
investment in the technology and industrial sector s, and they headed their reports with
titles such as, “‘Shareholder Value Supercollider’ Now Being Lit…”
12
and “2Q Shows
Industrial Spring is Loading.”
13
Performance in the quarter ended June 30, 2011,
showed early evidence of this rebou nd as second quarter profits rose 21 percent from
the previous year.
The market expected GE to generate EPS of $1.35 in 2011, a 27 percent increase from
the prior year, followed by increases of 23 percent in 2012 and 19 percent in 2013, bring-
ing GE’s EPS to $1.97 in 2013. Most analysts projected earnings only over a three-year
period.
14
How do these forecasts by analysts reconcile with the actual market valuation of GE?
What were the market’s implicit assumptions about the short-term and long-term earn-
ings growth for the company? By altering key value drivers and arriving at a combina-
tion that generates an estimated value equal to the observed market price, the analyst can
infer what the market might have been expecting for GE in July 2011.
A reasonable estimate of GE’s cost of equity can be calculated using a measure of risk
free return, GE’s beta, and the historic market risk premium discussed in Chapter 8. On
June 30, 2011, the ten year Treasury bill was yielding 3.17 percent. Value Line reported
GE’s beta as 1.2 and the historic market risk premium we discussed in Chapter 8 is
6.7 percent. Given these figures, we can estimate GE’s cost of equity using the method
discussed in Chapter 8 as 11.2 percent. Focusing on earnings as the value driver, critical
questions for judging the market valuation of GE are (1) how quickly the company’s
earnings are expected to rebound to approach and exceed the levels of 2007, and how
that compares to the analyst’s view of the firm’s near-term earnings growth prospects,
and (2) what the current valuation assumes in terms of long-term earnings growth rate
as compared to the earnings growth rate of the average firms in the economy (which
historically has been about 4 percent), and again how comfortable the analyst feels with
this assumption.
15
The analysis in Table 9-1 shows a scenario for GE’s future performance that would
justify its current stock price, assuming a cost of equity capital of 11.2 percent, and
9-10
PART 3 • Business Analysis and Valuation Applications
Copyright 2012 Cengage Learning. All Rights Reserved. May not be copied, scanned, or duplicated, in whole or in part. Due to electronic rights, some third party content may be suppressed from the eBook and/or eChapter(s).
Editorial review has deemed that any suppressed content does not materially affect the overall learning experience. Cengage Learning reserves the right to remove additional content at any time if subsequent rights restrictions require it.

using the three-year estimates of the various sell-side analysts covering the stock. Using
the market’s estimates for the first three years, GE would need to maintain a strong rate
of earnings growth through 2015, with the company returning to 2007 level EPS by 2014.
Furthermore, this scenario requires continued earnings growth beyond the forecast
horizon—GE would need to maintain an earnings growth rate of slightly over 3 percent in
perpetuity, with an ROE which stabilizes at 16.5 percent—a bit above the ROE time series
reversions we examined in Chapter 6. In general, then, the market is assuming that not
only will GE be successful in recovering from its stagnant performance of the past several
years, but that it will be able to show continued strong performance over the long term.
This type of scenario analysis provides the analyst with insights about investors’
expectations for GE and is useful for judging whether the stock is correctly valued. Secu-
rity analysis need not involve such a detailed attempt to infer market expectations. How-
ever, whether or not an explicit analysis is made, a good analyst understands what
economic scenarios could plausibly be reflected in the observed price.
Key Analysis Questions
By using the discounted abnormal earnings/ROE valuation model, analysts can infer
the market’s expectations for a firm’s future performance. This permits analysts to
ask whether the market is over- or undervaluing a company. Typical questions that
analysts might ask from this analysis include the following:
• What are the market’s assumptions about long-term ROE and growth? For
example, is the market forecasting that the company can grow its earnings
without a corresponding level of expansion in its asset base (and hence
equity)? If so, how long can this persist?
• How do changes in the cost of capital affect the market’s assessment of the
firm’s future performance? If the market’s expectations seem to be unexpect-
edly high or low, has the market reassessed the company’s risk? If so, is this
change plausible?
Developing the Analyst’s Expectati ons
Ultimately, a security analyst must compare his or her own view of a stock with the view
embedded in the market price. The analyst’s view is generated using the same analytical
tools discussed in Chapters 2 through 8. The final product of this work is, of course, a
forecast of the firm’s future earnings and cash flows and an estimate of the firm’s value.
TABLE 9 -1 Assumptions About Value Drivers for GE Consistent with
Observed Market Price of $18.86 (Assuming 11.2 Percent
Cost of Equity Capital)
Analysts’ Mean Earnings
Forecast Through 2013
2011 2012 2013 2014 2015
Post
2015
....................................................................................................................................................
Earnings Growth 27.4% 23.0% 18.7% 12.0% 12.0% 3.2%
Earnings Per Share 1.35 1.66 1.97 2.21 2.47
Return on Equity 12.1% 14.5% 16.5% 16.5% 16.5%
....................................................................................................................................................
Source: © Cengage Learning 2013
Equity Security Analysis 9-11
Copyright 2012 Cengage Learning. All Rights Reserved. May not be copied, scanned, or duplicated, in whole or in part. Due to electronic rights, some third party content may be suppressed from the eBook and/or eChapter(s).
Editorial review has deemed that any suppressed content does not materially affect the overall learning experience. Cengage Learning reserves the right to remove additional content at any time if subsequent rights restrictions require it.

However, that final product is less important than the understanding of the business and
its industry that the analysis provides. It is such understanding that enables the analyst
to interpret new information as it arrives and to infer its implications.
Key Analysis Questions
In developing expectations about a firm’s future performance using the financial
analysis tools discussed throughout this book, the analyst is likely to ask the follow-
ing types of questions:
• How profitable is the firm? In light of industry conditions, the firm’s corpo-
rate strategy, and its barriers to competition, how sustainable is that rate of
profitability?
• What are the opportunities for growth for this firm?
• How risky is this firm? How vulnerable are operations to general economic
downturns? How highly leveraged is the firm? What does the riskiness of the
firm imply about its cost of capital?
• How do answers to the above questions compare to the expectations embed-
ded in the observed stock price?
The Final Product of Security Analysis
For financial analysts, the final product of security analysis is a recommendation to buy,
sell, or hold the stock (or some more refined ranking). The recommendation is sup-
ported by a set of forecasts and a report summarizing the foundation for the recommen-
dation. Analysts’ reports often delve into significant detail and include an assessment of a
firm’s business as well as a line-by-line income statement, balance sheet, and cash flow
forecasts for one or more years.
In making a recommendation to buy or sell a stock, the analyst has to consider the
investment time horizon required to capitalize on the recommendation. Are anticipated
improvements in performance likely to be confirmed in the near term, allowing investors
to capitalize quickly on the recommendation? Or do expected performance improve-
ments reflect long-term fundamentals that will take several years to play out? Longer
investment horizons impose greater risk to investors that the company’s performance
will be affected by changes in economic conditions that cannot be anticipated by the
analyst, reducing the value of the recommendation. Consequently, thorough analysis
requires the ability not only to recognize whether a stock is misvalued, but also to antic-
ipate when a price correction is likely to take place.
Because there are additional investment risks from following recommendations that
require long-term commitments, security analysts tend to focus on making recommen-
dations that are likely to pay off in the short term. This might explain why so few ana-
lysts recommended selling dot-com and technology stocks during the late 1990s when
their prices would be difficult to justify on the basis of long-term fundamentals. It also
explains why analysts recommended Enron’s stock at its peak, even though the kind of
analysis performed in this chapter would have shown that the future growth and ROE
performance implied by this price would be extremely difficult to achieve. It implies as
well that to take advantage of long-term fundamental analysis can often require access to
patient, long-term capital.
9-12
PART 3 • Business Analysis and Valuation Applications
Copyright 2012 Cengage Learning. All Rights Reserved. May not be copied, scanned, or duplicated, in whole or in part. Due to electronic rights, some third party content may be suppressed from the eBook and/or eChapter(s).
Editorial review has deemed that any suppressed content does not materially affect the overall learning experience. Cengage Learning reserves the right to remove additional content at any time if subsequent rights restrictions require it.
PER FORMANCE OF SECURITY ANALYSTS
AND FUND MANAGERS
There has been extensive research on the performance of sell-side security analysts
and fund managers during the last three decades. A few of the key findings are sum-
marized below.
Performance of Sell-Side Analysts
Despite the failure of sell-side analysts to foresee the dramatic price declines for dot-com
and telecommunications stocks, and to detect the financial shenanigans and overvalua-
tion of companies such as Enron and WorldCom, research shows that analysts generally
add value in the capital market. Analysts’ earnings forecasts are more accurate than those
produced by time series models that use past earnings to predict future earnings.
16
Of
course, this should not be too surprising since analysts can update their earnings fore-
casts between quarters to incorporate new firm and economy information, whereas
time-series models cannot. In addition, stock prices tend to respond positively to upward
revisions in analysts’ earnings forecasts and recommendations, and negatively to down-
ward revisions.
17
Further, recent research indicates that sell-side analysts’ buy recom-
mendations outperform the market index and risk benchmarks by 6.5 percent and
7.5 percent per year, respectively.
18
Roughly 50 percent of this superior performance
can be traced to sell-side analysts’ recommending purchase of small less liquid stocks.
Finally, recent research finds that analysts play a valuable role in improving market effi-
ciency. For example, stock prices for firms with higher analyst following incorporate
information on accruals and cash flows more rapidly than prices of less followed firms.
19
Several factors seem to be important in explaining analysts’ earnings forecast accuracy.
Not surprisingly, forecasts of near-term earnings are much more accurate than those of
long-term performance.
20
This probably explains why analysts typically make detailed fore-
casts for only one or two years ahead. Studies of differences in earnings forecast accuracy
among analysts find that the more accurate ones tend to specialize by industry and work
for large, well-funded firms that employ other analysts who follow the same industry.
21
Although analysts perform a valuable function in the capital market, research shows
that their forecasts and recommendations tend to be biased. Early evidence on bias indi-
cated that analysts’ earnings forecasts tended to be optimistic and that their recommen-
dations were almost exclusively for buys.
22
Several factors potentially explain this finding.
First, security analysts at brokerage houses are typically compensated on the basis of the
trading volume that their reports generate. Given the costs of short selling and the
restrictions on short selling by many institutions, brokerage analysts have incentives to
issue optimistic reports that encourage investors to buy stocks rather than to issue nega-
tive reports that create selling pressure.
23
Second, until 2003 analysts that worked for
investment banks were rewarded for promoting public issues by current clients and for
attracting new banking clients, creating incentives for optimistic forecasts and recom-
mendations. Studies show that analysts who work for lead underwriters make more opti-
mistic long-term earnings forecasts and recommendations for firms raising equity capital
than unaffiliated analysts.
24
Evidence indicates that during the late 1990s there was a marked decline in analyst
optimism in forecasts of near-term earnings.
25
One explanation offered for this change
is that during this time analysts relied heavily on private discussions with top manage-
ment to make their earnings forecasts. Management allegedly used these personal con-
nections to manage analysts’ short-term expectations downward so that the firm could
Equity Security Analysis 9-13
Copyright 2012 Cengage Learning. All Rights Reserved. May not be copied, scanned, or duplicated, in whole or in part. Due to electronic rights, some third party content may be suppressed from the eBook and/or eChapter(s).
Editorial review has deemed that any suppressed content does not materially affect the overall learning experience. Cengage Learning reserves the right to remove additional content at any time if subsequent rights restrictions require it.
subsequently report earnings that beat analysts’ expectations. In response to concerns
about this practice, in October 2000 the SEC approved Regulation Fair Disclosure,
which prohibits management from making selective disclosures of nonpublic informa-
tion. Studies show that this regulatory intervention has led to greater independence
from management by analysts and an increased effort in independent information
discovery.
26
There has also been a general decline in sell-side analysts’ optimistic recommenda-
tions during the past few years. Many large investment banks now require analysts to
use a forced curve to rate stocks, leading to a greater number of the lowest ratings. Fac-
tors that underlie this change include a sharp rise in trading by hedge funds, which
actively seek stocks to short sell. In contrast, traditional money management firms are
typically restricted from short selling, and are more interested in analysts’ buy recom-
mendations than their sells. Second, regulatory changes in the United States under the
Global Settlement require tight separation between investment banking and equity
research at investment banks.
Performance of Fund Managers
Measuring whether mutual and pension fund managers earn superior returns is a diffi-
cult task for several reasons. First, there is no agreement about how to estimate bench-
mark performance for a fund. Studies have used a number of approaches; some have
used the Capital Asset Pricing Model (CAPM) as a benchmark, while others have used
multifactor pricing models. For studies using the CAPM, there are questions about what
type of market index to use. For example, should it be an equal- or value-weighted index,
a NYSE index, or a broader market index? Second, many of the traditional measures of
fund performance abstract from market-wide performance, which understates fund
abnormal performance if fund managers can time the market by reducing portfolio risk
prior to market declines and increasing risks before a market run-up. Third, the overall
volatility of stock returns stretches the limits of statistical power needed to measure fund
performance. Finally, tests of fund performance are likely to be highly sensitive to the
time period examined. Value or momentum investing could therefore appear to be prof-
itable depending on when the tests are conducted.
Perhaps because of these challenges, there is no consistent evidence that actively man-
aged mutual funds generate superior returns for investors. While some studies find evi-
dence of positive abnormal returns for the industry, others conclude that returns are
generally negative.
27
Of course even if mutual fund managers on average can only gener-
ate “normal” returns for investors, it is still possible for the best managers to show con-
sistently strong performance. Some studies do in fact document that funds earning
positive abnormal returns in one period continue to outperform in subsequent periods.
However, more recent evidence suggests that these findings are caused by general
momentum in stock returns or are offset by high fund expenses from management fees
and/or trading costs.
28
Researchers have also examined which, if any, investment strate-
gies are most successful. However, no clear consensus appears; several studies have found
that momentum and high turnover strategies generate superior returns, whereas others
conclude that value strategies are better.
29
Finally, recent research has examined whether fund managers tend to buy and sell
many of the same stocks at the same time. There is evidence of “herding” behavior, par-
ticularly by momentum fund managers.
30
This could arise because managers have access
to common information, because they are affected by similar cognitive biases, or because
they have incentives to follow the crowd.
31
For example, consider the rationale of a fund
manager who holds a stock but who, through long-term fundamental analysis, estimates
9-14
PART 3 • Business Analysis and Valuation Applications
Copyright 2012 Cengage Learning. All Rights Reserved. May not be copied, scanned, or duplicated, in whole or in part. Due to electronic rights, some third party content may be suppressed from the eBook and/or eChapter(s).
Editorial review has deemed that any suppressed content does not materially affect the overall learning experience. Cengage Learning reserves the right to remove additional content at any time if subsequent rights restrictions require it.

that it is misvalued. If the manager changes the fund’s holdings accordingly and the
stock price returns to its intrinsic value in the next quarter, the fund will show superior
relative portfolio performance and will attract new capital. However, if the stock con-
tinues to be misvalued for several quarters, the informed fund manager will underper-
form the benchmark and capital will flow to other funds. In contrast, a risk-averse
manager who simply follows the crowd will not be rewarded for detecting the misvalua-
tion, but neither will this manager be blamed for a poor investment decision when the
stock price ultimately corrects, since other funds made the same mistake.
There has been considerably less research on the performance of pension fund man-
agers. Overall, the findings show little consistent evidence that pension fund managers
either over- or under-perform traditional benchmarks.
32
SUMMARY
Equity security analysis is the evaluation of a firm and its prospects from the perspective
of a current or potential investor in the firm’s stock. Security analysis is one component
of a larger investment process that involves (1) establishing the objectives of the investor
or fund, (2) forming expectations about the future returns and risks of individual securi-
ties, and then (3) combining individual securities into portfolios to maximize progress
toward the investment objectives.
Some security analysis is devoted primarily to assuring that a stock possesses the
proper risk profile and other desired characteristics prior to inclusion in an investor’s
portfolio. However, especially for many professional buy-side and sell-side security ana-
lysts, the analysis is also directed toward the identification of mispriced securities. In
equilibrium, such activity will be rewarding for those with the strongest comparative
advantage. They will be the ones able to identify any mispricing at the lowest cost and
exert pressure on the price to correct the mispricing. What kinds of efforts are produc-
tive in this domain depends on the degree of market efficiency. A large body of evidence
exists that is supportive of a high degree of efficiency in the U.S. market, but recent stud-
ies have reopened the debate on this issue.
In practice, a wide variety of approaches to fund management and security analysis
are employed. However, at the core of the analyses are the same steps outlined in Chap-
ters 2 through 8 of this book: business strategy analysis, accounting analysis, financial
analysis, and prospective analysis (forecasting and valuation). For the professional ana-
lyst, the final product of the work is, of course, a forecast of the firm’s future earnings
and cash flows, and an estimate of the firm’s value. But that final product is less impor-
tant than the understanding of the business and its industry, which the analysis provides.
It is such understanding that positions the analyst to interpret new information as it
arrives and infer its implications.
Finally, the chapter summarizes some key findings of the research on the performance
of both sell-side and buy-side security analysts.
DISCUSSION QUESTIONS
1. Despite many years of research, the evidence on market efficiency described in this
chapter appears to be inconclusive. Some argue that this is because researchers have
been unable to link company fundamentals to stock prices precisely. Comment.
2. Geoffrey Henley, a professor of finance, states, “The capital market is efficient. I
don’t know why anyone would bother devoting time to following individual stocks
Equity Security Analysis 9-15
Copyright 2012 Cengage Learning. All Rights Reserved. May not be copied, scanned, or duplicated, in whole or in part. Due to electronic rights, some third party content may be suppressed from the eBook and/or eChapter(s).
Editorial review has deemed that any suppressed content does not materially affect the overall learning experience. Cengage Learning reserves the right to remove additional content at any time if subsequent rights restrictions require it.
and doing fundamental analysis. The best approach is to buy and hold a well-
diversified portfolio of stocks.” Do you agree? Why or why not?
3. What is the difference between fundamental and technical analysis? Can you think
of any trading strategies that use technical analysis? What are the underlying
assumptions made by these strategies?
4. Investment funds follow many different types of investment strategies. Income funds
focus on stocks with high dividend yields, growth funds invest in stocks that are
expected to have high capital appreciation, value funds follow stocks that are consid-
ered to be undervalued, and short funds bet against stocks they consider to be over-
valued. What types of investors are likely to be attracted to each of these types of
funds? Why?
5. Intergalactic Software Company went public three months ago. You are a sophisti-
cated investor who devotes time to fundamental analysis as a way of identifying mis-
priced stocks. Which of the following characteristics would you focus on in deciding
whether to follow this stock?
• The market capitalization
• The average number of shares traded per day
• The bid–ask spread for the stock
• Whether the underwriter that brought the firm public is a top tier investment
banking firm
• Whether the firm’s audit company is a Big Four firm
• Whether there are analysts from major brokerage firms following the company
• Whether the stock is held mostly by retail or by institutional investors
6. Intergalac tic Software Company’sstockhasamarketpriceof$20pershareanda
book value of $12 per share. If its cos t of equity capital is 15 p ercent and its
book value is expected to grow a t 5 percent per year indefinitely, what is the
market’s asses sment of its steady st ate r eturn on equity? If the stock price
increases to $35 and the market does not expect t he firm’s growth rate to change,
whatistherevisedsteadystateROE?Ifinsteadthepriceincreasewasduetoan
increase in the market’s assessments about long-term book value g rowth r ather
than long-term ROE, what would the price revision imply for the steady state
growth rate?
7. There are two major types of financial analysts: buy-side and sell-side. Buy-side ana-
lysts work for investment firms and make stock recommendations that are available
only to the management of funds within that firm. Sell-side analysts work for bro-
kerage firms and make recommendations that are used to sell stock to the brokerage
firms’ clients, which include individual investors and managers of investment funds.
What would be the differences in tasks and motivations of these two types of
analysts?
8. Many market participants believe that sell-side analysts are too optimistic in their
recommendations to buy stocks and too slow to recommend sells. What factors
might explain this bias?
9. Joe Klein is an analyst for an investment banking firm that offers both underwriting
and brokerage services. Joe sends you a highly favorable report on a stock that his
firm recently helped go public and for which it currently makes the market. What
are the potential advantages and disadvantages in relying on Joe’s report in deciding
whether to buy the stock?
10. Joe states, “I can see how ratio analysis and valuation help me do fundamental anal-
ysis, but I don’t see the value of doing strategy analysis.” Can you explain to him
how strategy analysis could be potentially useful?
9-16
PART 3 • Business Analysis and Valuation Applications
Copyright 2012 Cengage Learning. All Rights Reserved. May not be copied, scanned, or duplicated, in whole or in part. Due to electronic rights, some third party content may be suppressed from the eBook and/or eChapter(s).
Editorial review has deemed that any suppressed content does not materially affect the overall learning experience. Cengage Learning reserves the right to remove additional content at any time if subsequent rights restrictions require it.

NOTES
1. P. Healy and K. Palepu, “The Fall of Enron,” Journal of Economic Perspectives 17,
no. 2 (Spring 2003): 3–26, discuss how weak money manager incentives and a lack
of proper long-term analysis contributed to the stock price run-up and subsequent
collapse of Enron. A similar discussion on factors affecting the rise and fall of
dot-com stocks is provided in “The Role of Capital Market Intermediaries in the
Dot-Com Crash of 2000,” Harvard Business School Case 9-101–110, 2001.
2. See R. Bhushan, “Firm Characteristics and Analyst Following,” Journal of Accounting
and Economics 11 (2/5), July 1989: 255–75, and P. O’Brien and R. Bhushan,
“Analyst Following and Institutional Ownership,” Journal of Accounting Research
28, Supplement (1990): 55–76.
3. P. Mohanram and S. Sunder, “How Has Regulation FD Affected the Operations of
Financial Analysts?” Contemporary Accounting Research 23, no. 2 (2006): 491–525.
4. Reviews of evidence on market efficiency are provided by E. Fama, “Efficient
Capital Markets: II,” Journal of Finance 46 (December 1991): 1,575–1,617; S. Kothari,
“Capital Markets Research in Accounting,” Journal of Accounting and Economics 31
(September 2001): 105–231; and C. Lee, “Market Efficiency in Accounting Research,”
Journal of Accounting and Economics 31 (September 2001): 233–53.
5. For example, see V. Bernard and J. Thomas, “Evidence That Stock Prices Do Not
Fully Reflect the Implications of Current Earnings for Future Earnings,” Journal of
Accounting and Economics 13 (December 1990): 305–41.
6. For example, the superior returns earned by pursuing a “value stock” strategy were
examined by J. Lakonishok, A. Shleifer, and R. Vishny, “Contrarian Investment,
Extrapolation, and Risk,” Journal of Finance 49 (December 1994): 1,541–78, and
R. Frankel and C. Lee, “Accounting Valuation, Market Expectation, and Cross-
Sectional Stock Returns,” Journal of Accounting and Economics 25 (June 1998):
283–319.
7. For example, see J. Ou and S. Penman, “Financial Statement Analysis and the Pre-
diction of Stock Returns,” Journal of Accounting and Economics 11 (November
1989): 295–330; R. Holthausen and D. Larcker, “The Prediction of Stock Returns
Using Financial Statement Information,” Journal of Accounting and Economics 15
(June/September 1992): 373–412; and R. Sloan, “Do Stock Prices Fully Reflect Infor-
mation in Accruals and Cash Flows about Future Earnings?” Accounting Review 71
(July 1996): 298–325.
8. A. Shleifer, “Do Demand Curves for Stocks Slope Down,” Journal of Finance and
Quantitative Analysis 34 (March 1986): 579–90, argues that stocks show positive
abnormal returns immediately after entering the S&P 500 Index as a result of
increased demand from index funds. While extensive research exists on the idea
that trading as a result of investor preference creates short-term price pressure in
spin-off transactions, J. Abarbanell, B. Bushee, and J. Raedy, “Institutional Investor
Preferences and Price Pressure: The Case of Corporate Spin-Offs,” Journal of
Business 76 (2003): 233–61, find that this trading is not associated with abnormal
price movements for parents or subsidiaries around the spin-off.
9. For an overview of research in behavioral finance, see R. Thaler, Advances in Behav-
ioral Finance (New York: Russell Sage Foundation, 1993), and A. Shleifer, Inefficient
Markets: An Introduction to Behavioral Finance (Oxford: Oxford University Press,
2000). Numerous studies have documented the bias introduced by various elements
of irrational behavior such as overconfidence, herding, regret, and loss aversion.
10. Company data taken from Thomson ONE, accessed October 2011.
Equity Security Analysis 9-17
Copyright 2012 Cengage Learning. All Rights Reserved. May not be copied, scanned, or duplicated, in whole or in part. Due to electronic rights, some third party content may be suppressed from the eBook and/or eChapter(s).
Editorial review has deemed that any suppressed content does not materially affect the overall learning experience. Cengage Learning reserves the right to remove additional content at any time if subsequent rights restrictions require it.
11. G. Colvin, “Grading Jeff Immelt,” Fortune, February 10, 2011, http://management.
fortune.cnn.com/2011/02/10/grading-jeff-immelt/, accessed October 2011.
12. N. Heymann and J. Calabrese, “General Electric Company: ‘Shareholder Value
Supercollider’ Now Being Lit as Industrial Order Outlook Improves for Infrastruc-
ture,” William Blair & Company, July 26, 2011, via Thomson ONE, accessed
October 2011.
13. J.P. Morgan Securities LLC, “General Electric Co. 2Q Shows Industrial Spring is
Loading,” July 25, 2011, via Thomson ONE, accessed October 2011.
14. These forecasts were taken from Thomson One Analytics, accessed October 2011.
15. For historic earnings growth rate analysis, see for instance data from Robert Shiller
showing earnings from 1871 in data file labeled, “Stock Market Data Used in ‘Irra-
tional Exuberance’ Princeton University Press, 2000, 2005, updated,” www.irrational
exuberance.com, accessed January 2012. Since 1980 the average growth is more in
the range of 6 percent.
16. See L. Brown and M. Rozeff, “The Superiority of Analyst Forecasts as Measures of
Expectations: Evidence from Earnings,” Journal of Finance 33 (1978): 1–16;
L. Brown, P. Griffin, R. Hagerman, and M. Zmijewski, “Security Analyst Superiority
Relative to Univariate Time-Series Models in Forecasting Quarterly Earnings,” Jour-
nal of Accounting and Economics 9 (1987): 61–87; and D. Givoly, “Financial Ana-
lysts’ Forecasts of Earnings: A Better Surrogate for Market Expectations,” Journal of
Accounting and Economics 4, no. 2 (1982): 85–108.
17. See D. Givoly and J. Lakonishok, “The Information Content of Financial Analysts’
Forecasts of Earnings: Some Evidence on Semi-Strong Efficiency,” Journal of
Accounting and Economics 2 (1979): 165–86; T. Lys and S. Sohn, “The Association
Between Revisions of Financial Analysts’ Earnings Forecasts and Security Price
Changes,” Journal of Accounting and Economics 13 (1990): 341–64; and J. Francis
and L. Soffer, “The Relative Informativeness of Analysts’ Stock Recommendations
and Earnings Forecast Revisions,” Journal of Accounting Research 35, no. 2 (1997):
193–212.
18. See B. Groysberg, P. Healy, C. Chapman, and Y. Gui, “Do Buy-Side Analysts Out-
Perform the Sell-Side?” (working paper, Harvard Business School, June 2006). The
study also finds that buy-side analysts at a large money management firm make
more optimistic earnings forecasts and less profitable buy recommendations than
sell-side analysts.
19. See M. Brennan, N. Jegadeesh, and B. Swaminathan, “Investment Analysis and the
Adjustment of Stock Prices to Common Information,” Review of Financial Studies 6,
no. 4 (1993): 799–824, and B. Ayers and R. Freeman, “Evidence That Analyst Fol-
lowing and Institutional Ownership Accelerate the Pricing of Future Earnings,”
Review of Accounting Studies 8, no. 1 (2003): 47–67.
20. See P. O’Brien, “Forecasts Accuracy of Individual Analysts in Nine Industries,”
Journal of Accounting Research 28 (1990): 286–304.
21. See M. Clement, “Analyst Forecast Accuracy: Do Ability, Resources, and Portfolio
Complexity Matter?” Journal of Accounting and Economics 27 (1999): 285–304;
J. Jacob, T. Lys, and M. Neale, “Experience in Forecasting Performance of Security
Analysts.” Journal of Accounting and Economics 28 (1999): 51–82; and S. Gilson,
P. Healy, C. Noe, and K. Palepu, “Analyst Specialization and Conglomerate Stock
Breakups,” Journal of Accounting Research 39 (December 2001): 565–73.
22. See L. Brown, G. Foster, and E. Noreen, “Security Analyst Multi-Year Earnings Fore-
casts and the Capital Market,” Studies in Accounting Research, no. 23, American
Accounting Association (Sarasota, FL), 1985. In addition, M. McNichols and
P. O’Brien, in “Self-Selection and Analyst Coverage, ” Journal of Accounting Research,
9-18
PART 3 • Business Analysis and Valuation Applications
Copyright 2012 Cengage Learning. All Rights Reserved. May not be copied, scanned, or duplicated, in whole or in part. Due to electronic rights, some third party content may be suppressed from the eBook and/or eChapter(s).
Editorial review has deemed that any suppressed content does not materially affect the overall learning experience. Cengage Learning reserves the right to remove additional content at any time if subsequent rights restrictions require it.
Supplement (1997): 167–208, find that analyst bias arises primarily because analysts
issue recommendations on firms for which they have favorable information and
withhold recommending firms with unfavorable information.
23. See A. Cowen, B. Groysberg, and P. Healy, “Which Types of Analyst Firms Are
More Optimistic?” Journal of Accounting and Economics 41 (2006): 119–146.
24. See H. Lin and M. McNichols, “Underwriting Relationships, Analysts’ Earnings
Forecasts and Investment Recommendations,” Journal of Accounting and Economics
25, no. 1 (1998): 101–28; R. Michaely and K. Womack, “Conflict of Interest and the
Credibility of Underwriter Analyst Recommendations,” Review of Financial Studies
12, no. 4 (1999): 653–86; and P. Dechow, A. Hutton, and R. Sloan, “The Relation
Between Analysts’ Forecasts of Long-Term Earnings Growth and Stock Price Perfor-
mance Following Equity Offerings,” Contemporary Accounting Research 17, no. 1
(2000): 1–32.
25. See L. Brown, “Analyst Forecasting Errors: Additional Evidence,” Financial Analysts’
Journal (November/December 1997): 81–88, and D. Matsumoto, “Management’s
Incentives to Avoid Negative Earnings Surprises,” Accounting Review 77 (July
2002): 483–515.
26. See P. Mohanram and S. Sunder, “How Has Regulation FD Affected the Functioning
of Financial Analysts?” Contemporary Accounting Research 23, no. 2 (2006):
491–525.
27. For example, evidence of superior fund performance is reported by M. Grinblatt
and S. Titman, “Mutual Fund Performance: An Analysis of Quarterly Holdings,
Journal of Business 62 (1994), and by D. Hendricks, J. Patel, and R. Zeckhauser,
“Hot Hands in Mutual Funds: Short-Run Persistence of Relative Performance,”
Journal of Finance 48 (1993): 93–130. In contrast, negative fund performance is
shown by M. Jensen, “The Performance of Mutual Funds in the Period 1945–64,”
Journal of Finance 23 (May 1968): 389–416, and B. Malkiel, “Returns from Invest-
ing in Equity Mutual Funds from 1971 to 1991,” Journal of Finance 50 (June 1995):
549–73.
28. M. Grinblatt and S. Titman, “The Persistence of Mutual Fund Performance,”
Journal of Finance 47 (December 1992): 1,977–86, and D. Hendricks, J. Patel, and
R. Zeckhauser, “Hot Hands in Mutual Funds: Short-Run Persistence of Relative
Performance,” Journal of Finance 48 (March 1993): 93–130, find evidence of persis-
tence in mutual fund returns. However, M. Carhart, “On Persistence in Mutual
Fund Performance,” Journal of Finance 52 (March 1997): 57–83, shows that
much of this is attributable to momentum in stock returns and to fund expenses;
B. Malkiel, “Returns from Investing in Equity Mutual Funds from 1971 to 1991,”
Journal of Finance 50 (June 1995): 549 –73, shows that survivorship bias is also an
important consideration.
29. See M. Grinblatt, S. Titman, and R. Wermers, “Momentum Investment Strategies,
Portfolio Performance, and Herding: A Study of Mutual Fund Behavior,” American
Economic Review 85 (December 1995): 1,088–1,105.
30. For example, J. Lakonishok, A. Shleifer, and R. Vishny, “Contrarian Investment,
Extrapolation, and Risk,” Journal of Finance 49 (December 1994): 1541–79, find
that value funds show superior performance, whereas M. Grinblatt, S. Titman, and
R. Wermers, “Momentum Investment Strategies, Portfolio Performance, and Herd-
ing: A Study of Mutual Fund Behavior,” American Economic Review 85 (December
1995): 1,088–1,105, find that momentum investing is profitable.
31. See D. Scharfstein and J. Stein, “Herd Behavior and Investment,” American Eco-
nomic Review 80 (June 1990): 465–80, and P. Healy and K. Palepu, “The Fall of
Enron,” Journal of Economic Perspectives 17, no. 2 (Spring 2003): 3–26.
Equity Security Analysis 9-19
Copyright 2012 Cengage Learning. All Rights Reserved. May not be copied, scanned, or duplicated, in whole or in part. Due to electronic rights, some third party content may be suppressed from the eBook and/or eChapter(s).
Editorial review has deemed that any suppressed content does not materially affect the overall learning experience. Cengage Learning reserves the right to remove additional content at any time if subsequent rights restrictions require it.
32. For evidence on performance by pension fund managers, see J. Lakonishok, A. Shlei-
fer, and R. Vishny, “The Structure and Performance of the Money Management
Industry,” Brookings Papers on Economic Activity, Washington, DC (1992):
339–92; T. Coggin, F. Fabozzi, and S. Rahman, “The Investment Performance of
U.S. Equity Pension Fund Managers: An Empirical Investigation,” Journal of Finance
48 (July 1993): 1,039–56; and W. Ferson and K. Khang, “Conditional Performance
Measurement Using Portfolio Weights: Evidence for Pension Funds,” Journal of
Financial Economics 65 (August 2002): 249–282.
9-20
PART 3 • Business Analysis and Valuation Applications
Copyright 2012 Cengage Learning. All Rights Reserved. May not be copied, scanned, or duplicated, in whole or in part. Due to electronic rights, some third party content may be suppressed from the eBook and/or eChapter(s).
Editorial review has deemed that any suppressed content does not materially affect the overall learning experience. Cengage Learning reserves the right to remove additional content at any time if subsequent rights restrictions require it.

Chapter
10
CREDIT ANALYSIS AND
DISTRESS PREDICTION
C
redit analysis is the evaluation of a firm from the perspective of a holder or
potential holder of its debt, which includes trade payables, loans, and public
debt securities. A key element of credit analysis is the prediction of the
likelihood a firm will face financial distress. Credit analysis is involved in a wide variety
of decision contexts:
• A commercial banker asks: Should we extend a loan to this firm? If so, how should
it be structured? How should it be priced?
• If the loan is granted, the banker must later ask: Are we still providing the services,
including credit, that this firm needs? Is the firm still in compliance with the loan
terms? If not, is there a need to restructure the loan, and if so, how? Is the situa-
tion serious enough to call for accelerating the repayment of the loan?
• A potential investor asks: Are these debt securities a sound investment? What is
the probability that the firm will face distress and default on the debt? Does the
yield provide adequate compensation for the default risk involved?
• An investor contemplating purchase of debt securities in default asks: How likely
is it that this firm can be turned around? In light of the high yield on this debt
relative to its current price, can I accept the risk that the debt will not be repaid
in full?
• A potential supplier asks: Should I sell products or services to this firm? The asso-
ciated credit will be extended only for a short period, but the amount is large and
I should have some assurance that collection risks are manageable.
Finally, there are third parties—those other than borrowers and lenders—who are
interested in the general issue of how likely it is that a firm will avoid financial distress:
• An auditor asks: How likely is it that this firm will survive beyond the short run?
In evaluating the firm’s financials, should I consider it a going concern?
• A credit rating analyst asks: What is the likelihood that the firm will default on its
debt obligations?
• An actual or potential employee asks: How confident can I be that this firm will be
able to offer employment over the long term?
• A potential customer asks: What assurance i s there that this firm will survive to
provide w arranty services, replacement parts, product updates, and other
services?
10-1
Copyright 2012 Cengage Learning. All Rights Reserved. May not be copied, scanned, or duplicated, in whole or in part. Due to electronic rights, some third party content may be suppressed from the eBook and/or eChapter(s).
Editorial review has deemed that any suppressed content does not materially affect the overall learning experience. Cengage Learning reserves the right to remove additional content at any time if subsequent rights restrictions require it.
• A competitor asks: Will this firm survive the current industry shakeout? What are
the implications of potential financial distress at this firm for my pricing and mar-
ket share?
This chapter develops a framework to evaluate a firm’s creditworthiness and assess
the likelihood of financial distress.
WHY DO FIRMS USE DEBT FIN ANCING?
Before discussing the credit market and credit analysis, it is worth understanding why
firms use debt financing. Debt financing is attractive to firms for two key reasons:
• Corporate interest tax shields. In many countries, including the United States, tax
laws provide for the corporate tax deductibility of interest paid on debt. No such
corporate tax shield is available for dividend payments or retained earnings. There-
fore, corporate tax benefits should encourage firms with high effective tax rates and
few forms of tax shields other than interest to favor debt financing.
• Management incentives for value creation. Firms with relatively high leverage face
pressures to generate cash flows to meet payments of interest and principal, reduc-
ing resources available to fund unjustifiable expenses and investments that do not
maximize shareholder value. Debt financing, therefore, focuses management on
value creation, reducing conflicts of interest between managers and shareholders.
However, there are also costs of debt financing. As a firm increases its use of debt
financing, it increases the likelihood of financial distress, where it is unable to meet inter-
est or principal repayment obligations to creditors. This forces the firm to restructure its
financial claims, either under formal bankruptcy proceedings or out of bankruptcy.
Financial distress has multiple negative consequences for the firm:
• Legal costs of financial distress. Restructurings are likely to be costly, since the par-
ties involved have to hire lawyers, bankers, and accountants to represent their
interests and must pay court costs if there are formal legal proceedings. These
are often called the direct costs of financial distress.
• Costs of foregone investment opportunities. Distressed firms face significant chal-
lenges in raising capital as potential new investors and creditors will be wary of
becoming embroiled in the firm’s legal disputes. Thus, firms in distress are often
unable to finance new investments even though they may be profitable for its
owners.
• Costs of conflicts between creditors and stockholders. When faced with financial dis-
tress, creditors focus on the firm’s ability to service its debt while shareholders
worry that their equity will revert to the creditors if the firm defaults. Thus, man-
agers face increased pressure to make decisions that typically serve the interests of
the stockholders, and creditors react by increasing the costs of borrowing for the
firm’s stockholders.
Firms are more likely to fall into financial distress if they have high business risks,
and their assets are easily destroyed in financial distress. For example, firms with
human capital and brand intangibles are particularly sensitive to financial distress since
dissatisfied employees and customers can leave or seek alternative suppliers. In contrast,
firms with tangible assets can sell their assets if they get into financial distress, providing
additional security for lenders and lowering the costs of financial distress. Firms with
intangible assets are therefore less likely to be highly leveraged than firms whose assets
are mostly tangible.
10-2
PART 3 • Business Analysis and Valuation Applications
Copyright 2012 Cengage Learning. All Rights Reserved. May not be copied, scanned, or duplicated, in whole or in part. Due to electronic rights, some third party content may be suppressed from the eBook and/or eChapter(s).
Editorial review has deemed that any suppressed content does not materially affect the overall learning experience. Cengage Learning reserves the right to remove additional content at any time if subsequent rights restrictions require it.

The above discussion implies that a firm’s long-term decisions on the use of debt
financing reflect a trade-off between the corporate interest tax shield and incentive ben-
efits of debt against the costs of financial distress. As the firm becomes more highly lev-
eraged, the costs of leverage presumably begin to outweigh the tax and monitoring
benefits of debt.
Table 10-1 shows median leverage ratios for all publicly-traded st ocks in selected
industries for the year ended December 31, 2010. Median debt-to-book equity ratios
are highest for the w ater supply and electric se rvices industries, which are typically
not highly sensitive to economy risk and whose core assets are primarily physical
equipment and property that are readily transferable to debt holders in the event of
financial distress. In contrast, the software and pharmaceutical industries’ core assets
are their research staffs. Ownership of these types of assets cannot be easily transferred
to debt holders if the firm is in financial distress, and researchers are sensitive to bud-
get cuts. As a result, firms in these industries have relatively conservative capital struc-
tures. Firms in the crude petroleum and natural gas and industrial inorganic chemicals
industries have leverage in between these extremes , refle cting the need to balance the
impact of having extensive physical assets and being subject to more volatile revenue
streams.
It is also interesting to note that NYSE firms in the majority of industries shown here
tend to have higher debt financing than non-NYSE firms in the same industries, with the
difference most pronounced in pharmaceuticals. This probably reflects the fact that
larger NYSE firms tend to have more product offerings and to be more diversified geo-
graphically, reducing their vulnerability to negative events for a single product or market,
and enabling them to take on more debt.
THE MARKET FOR CREDIT
An understanding of credit analysis requires an appreciation for the various players in
the market for credit. We briefly describe below the major suppliers of debt financing.
Commercial Banks
Commercial banks are important players in the market for credit. Since banks tend to
provide a range of services to a client, and have intimate knowledge of the client and
its operations, they have a comparative advantage in extending credit in settings where
TABLE 10-1 Median Leverage in Selected Industries – Year-end 2010
Net Interest-Bearing
Debt-to-Book Equity
..................................................................
Industry All Listed Firms NYSE Firms
....................................................................................................................................................
Prepackaged Computer Software 41.9% 49.4%
Pharmaceuticals 60.2% 7.5%
Crude Petroleum and Natural Gas 10.8% 22.2%
Industrial Inorganic Chemicals 3.1% 26.3%
Electric Services 74.2% 79.5%
Water Supply 81.7% 90.5%
....................................................................................................................................................
Source: Standard and Poor’s Compustat 2011.
Credit Analysis and Distress Prediction 10-3
Copyright 2012 Cengage Learning. All Rights Reserved. May not be copied, scanned, or duplicated, in whole or in part. Due to electronic rights, some third party content may be suppressed from the eBook and/or eChapter(s).
Editorial review has deemed that any suppressed content does not materially affect the overall learning experience. Cengage Learning reserves the right to remove additional content at any time if subsequent rights restrictions require it.
(1) knowledge gained through close contact with management reduces the perceived
riskiness of the credit and (2) credit risk can be contained through careful monitoring
of the firm.
Bank lending operations are constrained by a low tolerance for risk to ensure that the
overall loan portfolio will be of acceptably high quality to bank regulators. Because of the
importance of maintaining public confidence in the banking sector and the desire to
shield government deposit insurance from risk, governments have incentives to constrain
banks’ exposure to credit risk. Banks also tend to shield themselves from the risk of shifts
in interest rates by avoiding fixed-rate loans with long maturities. Since banks’ capital
comes mostly from short-term deposits, such long-term loans leave them exposed to
increases in interest rates, unless the risk can be hedged with derivatives. Thus banks
are less likely to play a role when a firm requires a very long-term commitment to
financing. However, in some cases banks place the debt with investors looking for
longer-term credit exposure.
Non-Bank Financial Institutions
Banks face competition in the commercial lending market from a variety of sources. In
the United States, there is competition from savings and loans institutions, though
these firms tend to focus on f inancing mortgages. Financ e compan ies compete with
banks in the market for asset-based lending (i.e., the secur ed financing of specific assets
such as receivables , inventory, or equipment). Insurance companies are also involved in
a variety of lending activities. Since life insurance companies face obligations of a long-
term nature, they often seek investments of long duration (e.g., long-term bonds or
loans to support large, long-term commercial real estate and development projects).
Investment bankers are prepared to place debt securities with private investors or
in the public markets (discussed later). Various government agencies are also a source
of credit.
Public Debt Markets
Some firms have the size, strength, and credibility necessary to bypass the banking sector
and seek financing directly from investors, either through sales of commercial paper or
through the issuance of bonds. Such debt issues are facilitated by the assignment of a
debt rating, which measures the underlying credit strength of the firm and determines
the yield that must be offered to investors.
Banks often provide financing in tandem with a public debt issue or other source of
financing. In highly levered transactions, such as leveraged buyouts, banks commonly
provide financing along with public debt that has a lower priority in case of bankruptcy.
The bank’s “senior financing” would typically be scheduled for earlier retirement than
the public debt, and it would carry a lower yield. For smaller or start-up firms, banks
often provide credit in conjunction with equity financing from venture capitalists. Note
that in the case of both the leveraged buyout and the start-up company, the bank helps
provide the cash needed to make the deal happen, but it does so in a way that shields it
from risks that would be unacceptably high for the banking sector.
Sellers Who Provide Financing
Another sector of the market for credit is manufacturers and other suppliers of goods
and services. As a matter of course, such firms tend to finance their customers’ pur-
chases on an unsecured basis for periods of 30 to 60 days. Suppliers will, on occasion,
also agree to provide more extended financing, usually with the support of a secured
10-4
PART 3 • Business Analysis and Valuation Applications
Copyright 2012 Cengage Learning. All Rights Reserved. May not be copied, scanned, or duplicated, in whole or in part. Due to electronic rights, some third party content may be suppressed from the eBook and/or eChapter(s).
Editorial review has deemed that any suppressed content does not materially affect the overall learning experience. Cengage Learning reserves the right to remove additional content at any time if subsequent rights restrictions require it.
note. A supplier may be willing to grant such a loan in the expectation that the creditor
will survive a cash shortage and remain an important customer i n the future. However,
the customer would typically seek such an arrangemen t only if bank financing is
unavailable because it could constrain flexibility in selec ting among and/or negotiating
with suppliers.
THE CREDIT ANAL YSIS PROCESS IN PRIVATE DEBT MARKETS
Credit analysis is more than just establishing the creditworthiness of a firm, that is, its
ability to pay its debts at the scheduled times. The decision to extend credit is not a
binary one—the firm’s exact value, its upside potential, and its distance from the thresh-
old of creditworthiness are all equally important. There are ranges of credit-worthiness,
and it is important for purposes of pricing and structuring a loan to understand where a
firm lies within that range. While downside risk must be the primary consideration in
credit analysis, a firm with growth potential offers opportunities for future income-
generating financial services from a continued relationship.
This broader view of credit analysis involves most of the issues already discussed in
the prior chapters on business strategy analysis, accounting analysis, financial analysis,
and prospective analysis. Perhaps the greatest difference is that credit analysis rarely
involves any explicit attempt to estimate the value of the firm’s equity. However, the
determinants of that value are relevant in credit analysis because a larger equity cushion
translates into lower risk for the creditor.
Below we describe a representative but comprehensive series of steps that is used by
commercial lenders in credit analysis. However, not all credit providers follow
these guidelines. For example, when compared to a banker, manufacturers conduct a
less extensive analysis on their customers s ince the credit is very short-term and the
manufacturer is willing to bear some credit risk in the interest of generating a profit
on the sale.
We present the steps in a particular order, but they are in fact all interdependent. Thus
analysis at one step may need to be rethought, depending on the analysis at some later step.
Step 1: Consider the Nature and Purpose of the Loan
Understanding the purpose of a loan is important not only for deciding whether it
should be granted but also for structuring the loan based on duration, purpose, and
size. Loans might be required for only a few months, for several years, or even as a per-
manent part of a firm’s capital structure. Loans might be used for replacement of other
financing, to support working capital needs, or to finance the acquisition of long-term
assets or another firm.
The required amount of the loan must also be established. In the case of small- and
medium-sized companies, bankers typically prefer to be the sole financier of the busi-
ness. This preference is not only to gain an advantage in providing a menu of financial
services to the firm but also to maintain a superior interest in case of bankruptcy. If
other creditors are willing to subordinate their positions to the bank, that would of
course be acceptable as far as the bank is concerned.
Often the commercial lender deals with firms that may have parent-subsidiary rela-
tions, posing the question of the appropriate counterparty. In general, the entity that
owns the assets that will serve as collateral (or that could serve as such if needed in
the future) acts as the borrower. If this entity is the subsidiary and the parent presents
some financial strength independent of the subsidiary, a guarantee of the parent could be
considered.
Credit Analysis and Distress Prediction 10-5
Copyright 2012 Cengage Learning. All Rights Reserved. May not be copied, scanned, or duplicated, in whole or in part. Due to electronic rights, some third party content may be suppressed from the eBook and/or eChapter(s).
Editorial review has deemed that any suppressed content does not materially affect the overall learning experience. Cengage Learning reserves the right to remove additional content at any time if subsequent rights restrictions require it.
Step 2: Consider the Type of Loan and Available Security
The type of loan is a function not only of its purpose but also of the financial strength of
the borrower. Thus, to some extent, the loan type will be dictated by the financial analy-
sis described in Step 3. Some of the possible loan types are as follows:
• Open line of credit. An open line of credit permits the borrower to receive cash up
to some specified maximum on an as-needed basis for a specified term, such as
one year. To maintain this option, the borrower pays a fee (e.g., 3/8 of 1 percent)
on the unused balance in addition to a market rate of interest on any used amount.
An open line of credit is useful in cases where the borrower’s cash needs are diffi-
cult to anticipate.
• Revolving line of credit. When it is clear that a firm will need credit beyond the
short run, financing may be provided in the form of a “revolver.” The terms of a
revolver, which is sometimes used to support working capital needs, requires the
borrower to make payments as the operating cycle proceeds and inventory and
receivables are converted to cash. However, it is also expected that cash will con-
tinue to be advanced as long as the borrower remains in good standing. In addi-
tion to interest on amounts outstanding, a fee is charged on the unused line.
• Working capital loan. Such a loan is used to finance inventory and receivables, and
it is usually secured. The maximum loan balance may be tied to the balance of the
working capital accounts. For example, the loan may be allowed to rise to no more
than 80 percent of receivables less than 60 days old.
• Term loan. Term loans are used for long-term needs and are often secured with
long-term assets such as plants or equipment. Typically, the loan will be amortized,
requiring periodic payments to reduce the loan balance.
• Trade credit. Trade credit generally takes two forms—an interim loan to an
exporter to be repaid when the exports are paid for by the foreign importer or
credit extended by an exporter to an importer, allowing them to pay at some
time after they take delivery.
• Mortgage loan. Mortgages support the financing of real estate, have long terms,
and generally require periodic amortization of the loan balance.
• Lease financing. Lease financing can be used to facilitate the acquisition of any
asset but is most commonly used for equipment, including vehicles and buildings.
Leases may be structured over periods of 1 to 15 years, depending on the life of the
underlying asset.
Much bank lending is done on a secured basis, especially with smaller and more
highly levered companies. Security will be required unless the loan is short-term and
the borrower exposes the bank to only minimal default risk. When security is required,
an important consideration is whether the amount of available security is sufficient to
support the loan. The amount that a bank will lend based on a given security involves
business judgment and depends on a variety of factors that affect the liquidity of the
security should the firm face financial distress. The following are some rules of thumb
often applied in commercial lending to various categories of security:
• Receivables. Accounts receivable are usually considered the most desirable form of
security because they are the most liquid. One large regional bank allows loans of
50 to 80 percent of the balance of non-delinquent accounts. The percentage
applied is lower when (1) there are many small accounts that would be costly to
collect in case the firm is distressed; (2) there are a few very large accounts, such
that problems with a single customer could be serious; and/or (3) the customer’s
financial health is closely related to that of the borrower, so that collectability is
10-6
PART 3 • Business Analysis and Valuation Applications
Copyright 2012 Cengage Learning. All Rights Reserved. May not be copied, scanned, or duplicated, in whole or in part. Due to electronic rights, some third party content may be suppressed from the eBook and/or eChapter(s).
Editorial review has deemed that any suppressed content does not materially affect the overall learning experience. Cengage Learning reserves the right to remove additional content at any time if subsequent rights restrictions require it.

endangered just when the borrower is in default. On the latter score, banks often
refuse to accept receivables from affiliates as effective security.
• Inventory. The desirability of inventory as security varies widely. The best-case sce-
nario is inventory consisting of a common commodity that can easily be sold to
other parties if the borrower defaults. More specialized inventory, with appeal to
only a limited set of buyers or that is costly to store or transport, is less desirable.
The large regional bank mentioned above lends up to 60 percent on raw materials,
50 percent on finished goods, and 20 percent on work in process.
• Machinery and equipment. Machinery and equipm ent are less desirable as collat-
eral. They are likely to be used and must be stored, insured, and marketed. Keeping
the costs of these activities in mind, banks typically will lend only up to 50 percent
of the est imated value of such assets in a forced sale such as an auction.
• Real estate. The value of real estate as collateral varies considerably. Banks will
often lend up to 80 percent of the appraised value of readily salable real estate.
On the other hand, a factory designed for a unique purpose and thus not easy to
sell would be much less desirable.
Even when a loan is not secured initially, a bank can require a “negative pledge” on
the firm’s assets—a pledge that the firm will not use the assets as security for any other
creditor. In that case, if the borrower begins to experience difficulty and defaults on the
loan, and if there are no other creditors in the picture, the bank can demand that the
loan become secured if it is to remain outstanding.
Step 3: Conduct a Financial Analysis of the Potential Borrower
This portion of the analysis involves all the steps discussed in our chapters on business
strategy analysis, accounting analysis, and financial analysis. The emphasis, however, is on
the firm’s ability to service the debt at the scheduled rate. All the factors that could impact
that ability, such as the presence of off-balance-sheet lease obligations and the sustainability
of the firm’s operating profit stream, need to be carefully examined. The focus of the analy-
sis depends on the type of financing under consideration. For example, if a short-term loan
is needed to support seasonal fluctuations in inventory, the emphasis would be on the abil-
ity of the firm to convert the inventory into cash on a timely basis. In contrast, a term loan
to support plant and equipment must be made with confidence in the long-run earnings
prospects of the firm. This step incorporates both an assessment of the potential borrower’s
financial status, using ratio analysis, and a forecast to determine future payment prospects.
Ratio Analysis
Ultimately, since the key issue in the financial analysis is the likelihood that cash flows will
be sufficient to repay the loan, lenders focus much attention on solvency ratios: the mag-
nitude of various measures of profits and cash flows relative to debt service and other
requirements. Therefore, ratio analysis from the perspective of a creditor differs somewhat
from that of an owner. There is greater emphasis on cash flows and earnings available to
all claimants (not just owners) before taxes (since interest is tax-deductible and paid out of
pretax dollars). The funds flow coverage ratio illustrates the creditor’s perspective:
Fundsflowcoverage ¼
EBIT þ Depreciation
Interest þ
Debtrepayment
ð1 taxrateÞ
þ
Preferreddividends
ð1 taxrateÞ
Earnings before both interest and taxes in the numerator is compared directly to the
interest expense in the denominator, because interest expense is paid out of pre-tax
Credit Analysis and Distress Prediction 10-7
Copyright 2012 Cengage Learning. All Rights Reserved. May not be copied, scanned, or duplicated, in whole or in part. Due to electronic rights, some third party content may be suppressed from the eBook and/or eChapter(s).
Editorial review has deemed that any suppressed content does not materially affect the overall learning experience. Cengage Learning reserves the right to remove additional content at any time if subsequent rights restrictions require it.
dollars. In contrast, any payment of principal scheduled for a given year is non-
deductible and must be made out of after-tax profits. In essence, with a 50 percent tax
rate, one dollar of principal payment is “twice as expensive” as a one-dollar interest pay-
ment. Scaling the payment of principal by (1 − tax rate) accounts for this. The same idea
applies to preferred dividends, which are not tax deductible.
The funds flow coverage ratio provides an indication of how comfortably the funds
flow can cover unavoidable expenditures. The ratio excludes payments such as common
dividends and capital expenditures on the premise that they could be reduced to zero to
make debt payments if necessary.
1
Clearly, however, if the firm is to survive in the long
run, funds flow must be sufficient to service debt while also maintaining plant assets.
Thus long-run survival requires a funds flow coverage ratio well in excess of 1.
2
To the extent the ratio exceeds 1, it indicates the “margin of safety” the lender faces.
When such a ratio is combined with an assessment of the variance in its numerator, it
provides an indication of the probability of nonpayment. However, it would be overly sim-
plistic to establish any particular threshold above which a ratio indicates a loan is justified.
A creditor clearly wants to be in a position to be repaid on schedule, even when the bor-
rower faces a reasonably foreseeable difficulty. That argues for lending only when the
funds flow coverage is expected to exceed 1, even in a recession scenario—and higher if
some allowance for capital expenditures is prudent.
The financial analysis should produce more than an assessment of the risk of nonpay-
ment. It should also identify the nature of the significant risks. At many commercial
banks it is standard operating procedure to summarize the analysis of the firm by listing
the key risks that could lead to default and factors that could be used to control those
risks if the loan were made. That information can be used in structuring the detailed
terms of the loan so as to trigger default when problems arise, at a stage early enough
to permit corrective action.
Forecasting
Implicit in the discussion of the ratio analysis is a forward-looking view of the firm’s
ability to service the loan. Good credit analysis should also be supported by explicit fore-
casts. The basis for such forecasts is usually management, though lenders perform their
own tests as well. An essential element of this step is a sensitivity analysis to examine the
ability of the borrower to service the debt under a variety of scenarios such as changes in
the economy or in the firm’s competitive position. Ideally, the firm should be strong
enough to withstand downside risks such as a drop in sales or a decrease in profit
margins.
At times it is possible to reconsider the structure of a loan so as to permit it to “cash
flow.” That is, the term of the loan might be extended or the amortization pattern chan-
ged. Often a bank will grant a loan with the expectation that it will be continually
renewed, thus becoming a permanent part of the firm’s financial structure (labeled an
“evergreen” loan). In that case the loan will still be written as if it is due within the
short term, and the bank must assure itself of a viable “exit strategy.” However, the
firm would be expected to service the loan by simply covering interest payments.
Step 4: Assemble the Detailed Loan Structure, Including Loan
Covenants
If the analysis thus far indicates that a loan is in order, the final step is to assemble the
detailed structure. Having previously determined the type of loan and repayment sched-
ule, the focus shifts to the loan covenants and pricing.
10-8
PART 3 • Business Analysis and Valuation Applications
Copyright 2012 Cengage Learning. All Rights Reserved. May not be copied, scanned, or duplicated, in whole or in part. Due to electronic rights, some third party content may be suppressed from the eBook and/or eChapter(s).
Editorial review has deemed that any suppressed content does not materially affect the overall learning experience. Cengage Learning reserves the right to remove additional content at any time if subsequent rights restrictions require it.
Writing Loan Covenants
Loan covenants specify mutual expectations of the borrower and lender by specifying
actions the borrower will and will not take. Covenants generally fall into three categories:
(1) those that require certain actions such as regular provision of financial statements;
(2) those that preclude certain actions such as undertaking an acquisition without the
permission of the lender; and (3) those that require maintenance of certain financial
ratios. Loan covenants must strike a balance between protecting the interests of the
lender and providing the flexibility management needs to run the business. The cove-
nants represent a mechanism for ensuring that the business will remain as strong as the
two parties anticipated at the time the loan was granted.
The principal covenants that govern the management of the firm include restrictions on
other borrowing, pledging assets to other lenders, selling substantial assets, engaging in
mergers or acquisitions, and paying dividends. The financial covenants should seek to
address the significant risks identified in the financial analysis or to at least provide early
warning that such risks are surfacing. Some commonly used financial covenants follow:
• Maintenance of minimum net worth. This covenant assures that the firm will
maintain an “equity cushion” to protect the lender. Covenants typically require a
level of net worth rather than a particular level of income. In the final analysis,
the lender may not care whether that net worth is maintained by generating
income, cutting dividends, or issuing new equity. Tying the covenant to net
worth offers the firm the flexibility to use any of these avenues to avoid default.
• Minimum coverage ratio. Especially in the case of a long-term loan, such as a term
loan, the lender may want to supplement a net worth covenant with one based on
coverage of interest or total debt service. The funds flow coverage ratio presented
above would be an example. Maintenance of some minimum coverage helps
ensure that the ability of the firm to generate funds internally is strong enough to
justify the long-term nature of the loan.
• Maximum ratio of total liabilities to net worth. This ratio constrains the risk of high
leverage and prevents growth without either retaining earnings or infusing equity.
• Minimum net working capital balance or current ratio. Constraints on this ratio
force a firm to maintain its liquidity by using cash generated from operations to
retire current liabilities (as opposed to acquiring long-lived assets).
• Maximum ratio of capital expenditures to earnings before depreciation. Constraints
on this ratio help prevent the firm from investing in growth (including the illiquid
assets necessary to support growth) unless such growth can be financed internally,
with some margin remaining for debt service.
Required financial ratios are typically based on the levels that existed at the time that
the agreement was executed, perhaps with some allowance for deterioration but often
with some expected improvement over time. Violation of a covenant represents
an event of default that could cause immediate acceleration of the debt payment, but in
most cases the lender uses the default as an opportunity to re-examine the situation and
either waive the violation or renegotiate the loan.
Covenants are included not only in private lending agreements but also in public debt
agreements. However, public debt agreements tend to have less restrictive covenants for
two reasons. First, since negotiations resulting from a violation of public debt covenants
are costly (possibly involving not just the trustee but bondholders as well), the covenants
are written to be triggered only in serious circumstances. Second, public debt is usually
issued by stronger, more credit-worthy firms, though there is a large market for high-
yield debt. For the most financially healthy firms with strong debt ratings, very few
Credit Analysis and Distress Prediction 10-9
Copyright 2012 Cengage Learning. All Rights Reserved. May not be copied, scanned, or duplicated, in whole or in part. Due to electronic rights, some third party content may be suppressed from the eBook and/or eChapter(s).
Editorial review has deemed that any suppressed content does not materially affect the overall learning experience. Cengage Learning reserves the right to remove additional content at any time if subsequent rights restrictions require it.
covenants will be used, generally only those necessary to limit dramatic changes in the
firm’s operations, such as a major merger or acquisition.
Loan Pricing
A detailed discussion of loan pricing falls outside the scope of this text. The essence of
pricing is to assure that the yield on the loan is sufficient to cover (1) the lender’s cost of
borrowed funds; (2) the lender’s costs of administering and servicing the loan; (3) a pre-
mium for exposure to default risk; and (4) at least a normal return on the equity capital
necessary to support the lending operation. The price is often stated in terms of a devia-
tion from the bank’s prime rate (the rate charged to stronger borrowers). For example, a
loan might be granted at prime plus 1.5 percent. An alternative base is LIBOR, or the
London Interbank Offer Rate, the rate at which large banks from various nations lend
blocks of funds to each other.
Banks compete actively for commercial lending business, and it is rare that a yield
includes more than 2 percentage points to cover the cost of default risk. If the spread
to cover default risk is, say, 1 percent, and the bank recovers only 50 percent of amounts
due on loans that turn out bad, then the bank can afford only 2 percent of their loans to
fall into that category. This underscores how important it is for banks to conduct a thor-
ough analysis and to contain the riskiness of their loan portfolio.
FINANCIAL STATEMENT ANALYSIS A ND PUBLIC DEBT
Fundamentally, the issues involved in analysis of public debt are no different from
those of bank loans and other private debt issues. Institutionally, however, the contexts
are different. Bankers can maintain very close relations with clients so as to form an
initial assessment of their credit risk and monitor their activities during the loan
period. In the case of public debt, the investors are distanced from the issuer. To a
large extent, they must depend on professional debt analysts, including debt raters, to
assess the riskiness of the debt and monitor the firm’s ongoing activities. Such analysts
and debt raters thus serve an important function in closing the information gap
between issuers and investors.
The Meaning of Debt Ratings
Afirm’s debt rating influences the yield that must be offered to sell the debt instru-
ments. After the debt issue, the rating agencies continue to monitor the firm’s financial
condition. Changes in the rating are associated with fluctuation in the p rice of the
securities. The two major debt rating agencies in the United States are Moody’sand
Standard and Poor’s. Other rating agencies include Fitch Ratings, A.M. Best, and
Dun & Bradstreet.
Using the Standard and Poor’s labeling system, the highest possible rating is AAA. Pro-
ceeding downward from AAA, the ratings are AA, A, BBB, BB, B, CCC, CC, C, and D,
where D indicates debt in default. Table 10-2 presents examples of firms in rating catego-
ries AAA through D, as well as average yields across all firms in each category. Less than
1 percent of the public non-financial companies rated by Standard & Poor’shavethe
financial strength to merit a AAA rating. Among the few are Exxon Mobil, Johnson &
Johnson, and Microsoft—all among the largest, most profitable firms in the world. AA
firms are also very strong and include General Electric, Wal-Mart, and Canon. Firms
rated AAA and AA have the lowest costs of debt financing; at year-end 2010, their average
yields averaged 3.2 to 3.4 percent over the 12-month LIBOR rate.
10-10
PART 3 • Business Analysis and Valuation Appl ications
Copyright 2012 Cengage Learning. All Rights Reserved. May not be copied, scanned, or duplicated, in whole or in part. Due to electronic rights, some third party content may be suppressed from the eBook and/or eChapter(s).
Editorial review has deemed that any suppressed content does not materially affect the overall learning experience. Cengage Learning reserves the right to remove additional content at any time if subsequent rights restrictions require it.

To be considered investment grade, a firm must achieve a rating of BBB or higher,
which is an important threshold as many funds are precluded by their charters from
investing in any bonds below that grade. Even to achieve a grade of BBB is difficult.
Daimler, the automobile manufacturer and owner of Mercedes Benz, one of the world’s
most recognizable brands, was rated BBB, or barely investment grade, in 2010. Its large
U.S. rivals, General Motors and Ford, were rated BB and B, respectively, at the same
time. Some of the world’s largest airlines, including British Airways and American Air-
lines, were also rated below investment grade.
Table 10-2 shows that the cost of debt financing rises markedly once firms’ debt falls
below investment grade. For example, in 2010, yields for BBB rated debt issues were a
TABLE 10-2 Debt Ratings: Example Firms and Average Yields by Category
S&P
debt
rating Example firms in 2010
Percentage
of public
industrials
given same
rating by
S&P
Average
yield, 2010
Average
spread over
12-month
LIBOR rate
................................................................................................................................................
AAA Exxon Mobil 0.4% 4.0% 3.2%
Johnson & Johnson
Microsoft
................................................................................................................................................
AA General Electric 2.1% 4.2% 3.4%
Wal-Mart
Canon
................................................................................................................................................
A Coca-Cola 11.7% 4.4% 3.6%
McDonald’s
TJX
................................................................................................................................................
BBB Daimler 29.7% 4.9% 4.1%
Nordstrom
Best Buy
................................................................................................................................................
BB General Motors 27.3% 6.4% 5.6%
Fiat
Netflix
................................................................................................................................................
B Ford Motor Company 27.7% 8.0% 7.2%
Eastman Kodak
American Airlines (AMR)
................................................................................................................................................
CCC E-Trade 1.1% 9.9% 9.1%
Sbarro’s
Clearwire
................................................................................................................................................
CC Realogy <0.1% 13.6%
a
12.8%
................................................................................................................................................
D Blockbuster <0.1% 30%þ
a
30%þ
A&P
................................................................................................................................................
a
Representative yields as most securities not actively traded.
Source: Standard and Poor’s Compustat 2011.
Credit Analysis and Distress Prediction 10-11
Copyright 2012 Cengage Learning. All Rights Reserved. May not be copied, scanned, or duplicated, in whole or in part. Due to electronic rights, some third party content may be suppressed from the eBook and/or eChapter(s).
Editorial review has deemed that any suppressed content does not materially affect the overall learning experience. Cengage Learning reserves the right to remove additional content at any time if subsequent rights restrictions require it.

little over 4 percent over the 12-month LIBOR rate, whereas yields for B rated issues
were more than 7 percent above LIBOR rates. Yields for firms with CCC rated debt,
which were close to bankruptcy, were more than 9 percent over LIBOR, and the debt
securities of a few firms in default that were still traded were yielding over 30 percent
above the benchmark.
Table 10-3 shows median financial ratios for firms by debt rating category. Firms with
AAA and AA ratings have very strong earnings and cash flow performance as well as
minimal leverage. AAA rated firms often have large surpluses of cash such that net
debt is negative. Firms in the BBB class are only moderately leveraged, with about 32
percent of net capitalization coming from net debt. Earnings tend to be relatively strong,
as indicated by a pretax interest coverage (EBIT/interest) of 5.9 and a cash flow debt
coverage (cash flow from operations / total debt) of 35 percent. Firms toward the bottom
of the ratings spectrum, however, face significant risks: they typically report losses, have
high leverage, and have interest coverage ratios less than 1.
Factors That Drive Debt Ratings
Research using quantitative models of debt ratings demonstrates that some of the varia-
tion in ratings can be explained by selected financial statement ratios. Some debt rating
agencies rely heavily on these types of quantitative models, and they are also commonly
used by insurance companies, banks, and others to assist in the evaluation of the riski-
ness of debt issues for which a public rating is not available.
Table 10-4 lists the factors used by three different firms in their quantitative debt-
rating models. The firms include one insurance company and one bank, which use the
models in their private placement activities, and an investment research firm, which
employs the model in evaluating its own debt purchases and holdings. In each case, prof-
itability and leverage play an important role in the rating. One firm also uses size as an
indicator, with larger size associated with higher ratings.
TABLE 10-3 Debt Ratings: Median Financial Ratios by Category
Median ratios for overall category in January 2011
(excludes financial firms)
.............................................................................................................................
S&P
debt
rating
Earnings before
interest and
taxes to net
capital
Pretax interest
coverage
Cash flow from
operations to
total debt
Net debt to net
capital
....................................................................................................................................................
AAA 41.6% 105.4 317% 33%
....................................................................................................................................................
AA 25.9% 14.6 47% 31%
....................................................................................................................................................
A 23.5% 11.5 57% 22%
....................................................................................................................................................
BBB 16.1% 5.9 35% 32%
....................................................................................................................................................
BB 15.4% 3.7 28% 37%
....................................................................................................................................................
B 9.6% 1.5 14% 58%
....................................................................................................................................................
CCC 2.6% 0.3 .0.1% 87%
....................................................................................................................................................
Source: Standard and Poor’s Compustat 2011.
10-12 PART 3 • Business Analysis and Valuation Applications
Copyright 2012 Cengage Learning. All Rights Reserved. May not be copied, scanned, or duplicated, in whole or in part. Due to electronic rights, some third party content may be suppressed from the eBook and/or eChapter(s).
Editorial review has deemed that any suppressed content does not materially affect the overall learning experience. Cengage Learning reserves the right to remove additional content at any time if subsequent rights restrictions require it.

Several researchers have developed quantitative models of debt ratings. Two of these
models, both by Kaplan and Urwitz and shown in Table 10-5, highlight the relative
importance of the different factors.
3
Model 1 has a greater ability to explain variation
in bond ratings. However, it includes some factors based on stock market data, which
are not available for all firms. Model 2 is based solely on financial statement data.
The factors in Table 10-5 are listed in the order of their statistical significance in
Model 1. An interesting feature is that the most important factor explaining debt ratings
is not a financial ratio at all—it is simply firm size! Large firms tend to get better ratings
than small firms. Whether the debt is subordinated or unsubordinated is next most
important, followed by a leverage indicator. Profitability appears less important, but in
part that reflects the presence in the model of multiple factors (ROA and interest cover-
age) that capture profitability. The explanatory power of profitability is then divided
between these two variables.
When applied to a sample of bonds that were not used in the estimation process,
the Kaplan-Urwitz Model 1 predicted the rating category correctly in 44 of 64 cases, or
63 percent of the time. Where it erred, the model was never off by more than one cate-
gory, and in about half of those cases its prediction was more consistent with the market
yield on the debt than was the actual debt rating. The discrepancies between actual ratings
and those estimated using the Kaplan-Urwitz model indicate that rating agencies incorpo-
rate factors other than financial ratios in their analysis. These are likely to include the types
of strategic, accounting, and prospective analyses discussed throughout this book.
Although debt ratings can be explained reasonably well in terms of a handful of financial
ratios based on publicly available data, ratings changes have an important signaling effect.
Debt rating downgrades are greeted with drops in both bond and stock prices,
4
even though
the capital markets anticipate much of the information reflected in rating changes. This is
due to the fact that changes often represent reactions to recent known events, and the rating
agencies typically indicate in advance that a change is being considered.
TABLE 10-4 Factors Used in Quantitative Models of Debt Ratings
Firm 1 Firm 2 Firm 3
....................................................................................................................................................
Profitability
measures
Return on long-term
capital
Return on long-term
capital
Return on long-
term capital
....................................................................................................................................................
Leverage measures Long-term debt to
capitalization
Long-term debt to
capitalization
Total debt to total
capital
Long-term debt to
capitalization
....................................................................................................................................................
Profitability and
leverage
Interest coverage
Cash flow to long-term
debt
Interest coverage
Cash flow to long-term
debt
Fixed charge
coverage
Coverage of short-
term debt and
fixed charges
....................................................................................................................................................
Firm size Sales Total assets
....................................................................................................................................................
Other Standard deviation of
return
Subordination status
....................................................................................................................................................
Source: © Cengage Learning
Credit Analysis and Distress Prediction 10-13
Copyright 2012 Cengage Learning. All Rights Reserved. May not be copied, scanned, or duplicated, in whole or in part. Due to electronic rights, some third party content may be suppressed from the eBook and/or eChapter(s).
Editorial review has deemed that any suppressed content does not materially affect the overall learning experience. Cengage Learning reserves the right to remove additional content at any time if subsequent rights restrictions require it.

PRE DICTION OF DISTR ESS AND TURNAROUND
The key task in credit analysis is assessing the probability that a firm will face financial
distress and fail to repay a loan. A related analysis, relevant once a firm begins to face
distress, involves considering whether it can be turned around. In this section, we con-
sider evidence on the predictability of these states.
The prediction of either distress or turnaround is a complex, difficult, and subjective
task that involves all of the steps of analysis discussed throughout this book: business
strategy analysis, accounting analysis, financial analysis, and prospective analysis. Purely
quantitative models of the process can rarely serve as substitutes for the hard work the
TABLE 10-5 Kaplan-Urwitz Models of Debt Ratings
Coefficients
...................................................
Firm or debt
characteristic Variable reflecting characteristic Model 1 Model 2
....................................................................................................................................................
Model intercept 5.67 4.41
....................................................................................................................................................
Firm size Total assets
a
.0009 .0011
....................................................................................................................................................
Subordination
status of debt
1 ¼ subordinated; 0 ¼ unsubordinated 2.36 2.56
....................................................................................................................................................
Leverage Long-term debt to total assets 2.85 2.72
....................................................................................................................................................
Systematic risk Market model beta, indicating sensitivity
of stock price to market-wide move-
ments (1 ¼ average)
b
.87 —
....................................................................................................................................................
Profitability Net income to total assets 5.13 6.40
....................................................................................................................................................
Unsystematic
risk
Standard deviation of residual from
market model (average ¼ .10)
b
2.90 —
....................................................................................................................................................
Riskiness of
profit stream
Coefficient of variation in net income
over five years (standard deviation/
mean)
— .53
....................................................................................................................................................
Interest coverage Pretax funds flow before interest to
interest expense
.007 .006
....................................................................................................................................................
The score from the model is converted to a bond rating as follows:
If score > 6.76, predict AAA
score > 5.19, predict AA
score > 3.28, predict A
score > 1.57, predict BBB
score < 0.00, predict BB
....................................................................................................................................................
a
The coefficient in the Kaplan-Urwitz model was estimated at .005 (Model 1) and .006 (Model 2). Its scale
has been adjusted to reflect that the estimates were based on assets measured in dollars from the early
1970s. Given that $1 from 1972 is approximately equivalent to $5.33 in 2011, the original coefficient esti-
mate has been divided by 5.33.
b
Market model is estimated by regressing stock returns on the market index, using monthly data for the prior 5 years.
Source: © Cengage Learning
10-14 PART 3 • Business Analysis and Valuation Applications
Copyright 2012 Cengage Learning. All Rights Reserved. May not be copied, scanned, or duplicated, in whole or in part. Due to electronic rights, some third party content may be suppressed from the eBook and/or eChapter(s).
Editorial review has deemed that any suppressed content does not materially affect the overall learning experience. Cengage Learning reserves the right to remove additional content at any time if subsequent rights restrictions require it.

analysis involves. However, research on such models does offer some insight into which
financial indicators are most useful in the task. Moreover, there are some settings where
extensive credit checks are too costly to justify and where quantitative distress prediction
models are useful.
Models for Distress Prediction
Several distress prediction models have been developed over the years.
5
They are sim-
ilar to the debt rating models, but instead of predicting ratings, they predict whether
a firm will face s ome state of distress, typically defined as bankruptcy, within a spec-
ified period such as one year. One study suggests that the factors most useful (on a
stand-alone basis) in predicting bankruptcy one year in advance are the firm’s level
of profitability, the volatility of that profitability (as measured by the standard devia-
tion of ROE), and its leverage.
6
Interestingly, liquidity measures turn out to be much
less important. Current liquidity will not save an unhealthy firm if it is losing money
at a fast pace.
A number of more robust, multifactor models have also been designed to predict
financial distress. One such model, the Altman Z-score model, weights five variables to
compute a bankruptcy score.
7
For public companies the model is as follows
8
:
Z ¼ 1:2ðX
1
Þþ1:4ðX
2
Þþ3:3ðX
3
Þþ0:6ðX
4
Þþ1:0ðX
5
Þ
where
X
1
¼ net working capital/total assets (measure of liquidity)
X
2
¼ retained earnings/total assets (measure of cumulative profitability)
X
3
¼ EBIT/total assets (measure of return on assets)
X
4
¼ market value of equity/book value of total liabilities (measure of market
leverage)
X
5
¼ sales/total assets (measure of sales generating potential of assets)
The model predicts bankruptcy when Z < 1.81. The range between 1.81 and 2.67 is
labeled the “gray area.”
The following table presents calculations for two companies, Canon, Inc. and Eastman
Kodak Company, at the end of 2010:
...................................................................................................................
Canon, Inc.
Dec. 31, 2010
..................................
Eastman Kodak
Company Dec. 31, 2010
.................................................
Model
Coefficient Ratios Score Ratios Score
........................................................................................................................................................
Net working 1.2 0.079 0.09 −0.112 −0.13
capital/Total assets
Retained earnings/ 1.4 0.771 1.08 0.896 1.25
Total assets
EBIT/Total assets 3.3 0.096 0.32 −0.074 −0.24
Market value of equity/
Book value of total
liabilities
0.6 4.934 2.96 0.218 0.13
Sales/Total assets 1.0 0.900
0.90 1.296 1.30
Altman Z-score: 5.35 2.31
.........................................................................................................................................................
Source: Thomson ONE, accessed October 2011.
Credit Analysis and Distress Prediction 10-15
Copyright 2012 Cengage Learning. All Rights Reserved. May not be copied, scanned, or duplicated, in whole or in part. Due to electronic rights, some third party content may be suppressed from the eBook and/or eChapter(s).
Editorial review has deemed that any suppressed content does not materially affect the overall learning experience. Cengage Learning reserves the right to remove additional content at any time if subsequent rights restrictions require it.
The table shows the wide performance gap between two of the largest and best-known
competitors in imaging technology products and services. Canon’s Z score demonstrates
its financial strength and reflects its AA rating. Canon has delivered generally steady
sales and earnings growth over the past ten years, and its liabilities are only 20 percent
of its market capitalization, indicating relatively low financial leverage. Kodak’s Z score,
on the other hand, highlights its difficulty in recovering from its late and poorly executed
shift to digital imaging technology. Kodak has posted an annual loss since 2005, as the
company has adopted a series of unsuccessful strategies aimed at replacing lost revenues
and profitability from its declining film business. At the end of 2010, Kodak’s liabilities
were almost five times larger than its market capitalization, an indication of its declining
financial state. As a result, Kodak’s debt was downgraded to CCC in early 2011, with a
negative outlook, and by mid 2011 with losses mounting, reports circulating of the com-
pany accessing lines of credit at a higher than normal rate, and the stock hovering
around $1.50 per share, rumors abounded about a possible bankruptcy filing.
Such models have some ability to predict failing and surviving firms. Altman reports
that when the model was applied to a holdout sample containing 33 failed and 33 non-
failed firms (the same proportion used to estimate the model), it correctly predicted the
outcome in 63 of 66 cases. However, the performance of the model would degrade sub-
stantially if applied to a holdout sample where the proportion of failed and non-failed
firms was not forced to be the same as that used to estimate the model.
The commercially available ZETA model, also developed by Altman, improves on the
predictive power and accuracy of the Z-score model. The ZETA model incorporates
seven variables and includes measures of the stability of earnings, debt service coverage,
and firm size.
9
While distress prediction models cannot serve as a replacement for
in-depth analysis of the kind discussed throughout this book, they do provide a useful
reminder of the power of financial statement data to summarize important dimensions
of a firm’s performance. In addition, they can be useful for screening large numbers of
firms prior to more in-depth analysis of corporate strategy, management expertise, mar-
ket position, and financial ratio performance. The ZETA model, for instance, is used by
some manufacturers and other firms to assess the creditworthiness of their customers.
Investment Opportunities in Distressed Companies
The debt securities of firms in financial distress trade at steep discounts to par value.
Some hedge fund managers and investment advisors specialize in investing in these
securities—even purchasing the debt of firms operating under bankruptcy protection.
Investors in these securities can earn attractive returns if the firm recovers from its cash
flow difficulties.
10
Distressed debt investors assess whether the firm is likely to overcome its immediate cash
flow problems and whether it has a viable long-run future. Two elements of the framework
laid out in Part 2 of this book are particularly relevant to analyzing distressed opportunities.
The first is a thorough analysis of the firm’s industry and competitive positioning and an
assessment of its business risks. This is followed by the construction of well-reasoned fore-
casts of its future cash flow and earnings performance in light of the business analysis.
CREDIT RATING S AND THE SUBPRIME CRISI S
While the focus of this chapter is on the credit analysis and distress prediction of corpo-
rate debt, there are also important lessons to be learned from examining the role that
credit analysis and ratings of securitized financial instruments (primarily asset-backed
securities) played in the 2008 financial crisis. We touch on these briefly here.
10-16
PART 3 • Business Analysis and Valuation Appl ications
Copyright 2012 Cengage Learning. All Rights Reserved. May not be copied, scanned, or duplicated, in whole or in part. Due to electronic rights, some third party content may be suppressed from the eBook and/or eChapter(s).
Editorial review has deemed that any suppressed content does not materially affect the overall learning experience. Cengage Learning reserves the right to remove additional content at any time if subsequent rights restrictions require it.
Much of the research into the causes of the financial crisis has focused on the appli-
cation of securitization to the U.S. subprime mortgage market.
11
The securitization of
mortgage debt, which involved the pooling of individual mortgages and the slicing of
that pool into layers (“tranches”) with progressive levels of seniority, enabled the devel-
opment of securities which could be widely sold in the financial markets—something not
possible at the individual mortgage level. In addition, the securitization process was
expected to mitigate the individual risk of default of the underlying securities by filling
the pool with securities whose default risk was not highly correlated, allowing the
creation of securities with different levels of default risk—some (or many, depending
on the specifics) with a lower risk of default than the average of the underlying mort-
gages in the pool.
As banks refined and expanded these offerings to capitalize on the burgeoning sub-
prime mortgage market, they pushed the ratings agencies, which up until that time had
focused on the rating of corporate debt, to rate the securities so as to make them more
widely acceptable both to institutional investors who were restricted in their ability to
invest in non-rated securities and to the broader market, which looked more favorably
on securities given the stamp of approval of an investment-grade rating. The agencies
complied and saw their revenues jump dramatically until this part of their revenue
stream in many cases constituted the majority of their revenues.
When the housing market experienced a significant downturn beginning in late 2005,
it became clear that the credit agencies and the market had underestimated the riskiness
of these securities and their potential exposure to the broad market downturn that
occurred. Also, the crisis raised questions about the quality of the ratings in general,
especially as it related to the agency/banking relationship dynamic.
While much of the discussion into the role of the credit rating age ncies in the crisis
has been around the conflict of interest inherent in the agenc ies ’ relationship to their
banking clients and i ts potential compromisin g impact on the quality of its rati ng of
the cli ent’s products, researchers have also examined factors inherent in the agencies’
own rating methodologies t hat contributed to a systemic underestimation of the risk
of the securitized subprime mortgage product.
12
In general, the ratings agencies were
more familiar with corporate debt ratings—they had only recently moved into rating
financial instruments—and their models did not seem ad equate to handle the complex-
ity of the structured products they were being asked to rate. Also, the embedded nature
of many of these products meant that small errors in estimates had big impacts on
default risk calculations. For instance, one product known as a CDO
2
(collateralized
debt obligation squared) was made up of the most junior tranches of other CDOs,
pooled and tranched again, which magnified this type of instrument’s exposure to esti-
mate error risk. Also, structured products in general replace the of individual default
with the risk of systematic default (i.e., failure of the whole system), which made the
mortgage-based product highly exposed to losses in broad downturns such as occurred
beginning in 2005. Despite this critical risk, ratings agency models did not even
account for the potential of a significant housing downturn since there had not been
one in recent memory. Finally, in general the ratings agencies did not have good histor-
ical data on subprime defaults since subprime lending was a relatively new phenome-
non. In total, it is clear that while conflict of interest issues were an important factor in
the crisis, another perhaps equally important factor was that the analysis performed by
the agencies in assigning ratings to these secu rities was not adequate to assess their true
creditworthiness.
The Dodd-Frank Wall Street Reform and Consumer Protection Act, which was
passed in the wake of the financial crisis, was an attempt to address through regulation
Credit Analysis and Distress Prediction 10-17
Copyright 2012 Cengage Learning. All Rights Reserved. May not be copied, scanned, or duplicated, in whole or in part. Due to electronic rights, some third party content may be suppressed from the eBook and/or eChapter(s).
Editorial review has deemed that any suppressed content does not materially affect the overall learning experience. Cengage Learning reserves the right to remove additional content at any time if subsequent rights restrictions require it.

some of the key causes of the financial crisis, and included increased oversight of the
ratings agencies. Among its key provisions related to credit agencies:
13
• Creation of an Office of Credit Ratings at the SEC—with its own compliance staff
and the authority to fine agencies, and the mandate to examine the ratings agen-
cies at least once a year.
• Increased disclosure requirements for the ratings agencies—of their methodologies,
their use of third parties for due diligence efforts, and their ratings track record.
• Required use of independent information by the ratings agencies— from sources
other than organizations being rated, if credible.
• Increased limitations on activities involving potential conflict of interest—prohibits
compliance officers from working on ratings, and other reporting requirements.
• Increased potential liability—removes liability exemptions for ratings agencies,
allowing investors to bring private rights of action against agencies.
• Gives SEC right to deregister a ratings agency—for providing bad ratings over time.
• Increased education requirements—requires ratings analysts to pass qualifying
exams and to participate in continuing education.
• Elimination of statutory and regulatory requirements for use of ratings—in an
attempt to reduce over-reliance on ratings.
• Increased independence of agency boards—requires at least 50 percent of agency
boards to hold no financial stake in credit ratings.
• New SEC mechanism to prevent “shopping for ratings”—to prevent issuers of secu-
rities from picking the agency most likely to give their product a favorable rating.
SUMMARY
Debt financing is attractive to firms with high marginal tax rates and few non-interest
tax shields, making interest tax shields from debt valuable. Debt can also help create
value by deterring management of firms with high, stable income/cash flows and few
new investment opportunities from over-investing in unprofitable new ventures.
However, debt financing also creates the risk of financial distress, which is likely to be
particularly severe for firms with volatile earnings and cash flows, and intangible assets
that are easily destroyed by financial distress.
Prospective providers of debt use credit analysis to evaluate the risks of financial dis-
tress for a firm. Credit analysis is important to a wide variety of economic agents—not
only bankers and other financial intermediaries but also public debt analysts, industrial
companies, service companies, and others.
At the heart of credit analysis lie the same techniques described in Chapters 2 through 8:
business strategy analysis, accounting analysis, financial analysis, and portions of prospec-
tive analysis. The purpose of credit analysis in private debt markets goes beyond the
assessment of the likelihood that a potential borrower will fail to repay the loan. It also
serves to identify the nature of the main risks involved and to guide how the loan might
be structured to mitigate or control those risks. A well-structured loan provides the lender
with a viable “exit strategy,” even in the case of default. Properly designed accounting-based
covenants are essential to this structure.
Fundamentally, the issues involved in analysis of public debt are no different from
those involved in evaluating bank loans or other private debt. Institutionally, however,
the contexts are different. Investors in public debt are usually not close to the borrower
and must rely on other agents, including debt raters and other analysts, to assess credit-
worthiness. Debt ratings, which depend heavily on firm size and financial measures of
10-18
PART 3 • Business Analysis and Valuation Appl ications
Copyright 2012 Cengage Learning. All Rights Reserved. May not be copied, scanned, or duplicated, in whole or in part. Due to electronic rights, some third party content may be suppressed from the eBook and/or eChapter(s).
Editorial review has deemed that any suppressed content does not materially affect the overall learning experience. Cengage Learning reserves the right to remove additional content at any time if subsequent rights restrictions require it.

performance, have an important influence on the market yields that must be offered to
issue debt.
The primary task in credit analysis is assessment of the probability of default. The
task is complex, difficult, and to some extent, subjective. A few financial ratios can help
predict financial distress with some accuracy. The most important indicators for this
purpose are profitability, volatility of profits, and leverage. While there are a number of
models that predict distress based on financial indicators, they cannot replace the in-
depth forms of analysis discussed in this book.
The financial crisis of 2008 is an example of a major miscalculation of the probability
of default for asset-backed securities due to the complex, not well understood nature of
the financial instruments. Government legislation put in place after the financial crisis
attempts to impose additional controls on ratings agencies who had significant conflict
of interest and whose models did not fully understand the complex securities that they
were being asked to rate given their historic background in rating corporate debt.
DISCUSSION QUESTIONS
1. Financial analysts typically measure financial leverage as the ratio of debt to equity.
However, there is less agreement on how to measure debt, or even equity. How
would you treat the following items in computing this ratio? Justify your answers.
• Revolving credit agreement with bank
• Cash and marketable securities
• Operating leases
• Unrecorded pension commitments
• Deferred tax liabilities
• Preferred stock
• Convertible debt
2. U.S. public companies with “low” leverage have an interest-bearing net debt-
to-equity ratio of 0 percent or less, firms with “medium” leverage have a ratio
between 1 and 62 percent, and “high” leverage firms have a ratio of 63 percent or
more. Given these data, how would you classify the following firms in terms of
their optimal debt-to-equity ratio (high, medium, or low)?
• a successful pharmaceutical company
• an electric utility
• a manufacturer of consumer durables
• a commercial bank
• a start-up software company
3. What are the critical performance dimensions for (a) a retailer and (b) a financial
services company that should be considered in credit analysis? What ratios would
you suggest looking at for each of these dimensions?
4. Why would a company pay to have its public debt rated by a major rating agency
(such as Moody’s or Standard and Poor’s)? Why might a firm decide not to have its
debt rated?
5. Some have argued that the market for original-issue junk bonds developed in the
late 1970s as a result of a failure in the rating process. Proponents of this argument
suggest that rating agencies rated companies too harshly at the low end of the rating
scale, denying investment grade status to some deserving companies. What are pro-
ponents of this argument effectively assuming were the incentives of rating agencies?
What economic forces could give rise to this incentive?
Credit Analysis and Distress Prediction 10-19
Copyright 2012 Cengage Learning. All Rights Reserved. May not be copied, scanned, or duplicated, in whole or in part. Due to electronic rights, some third party content may be suppressed from the eBook and/or eChapter(s).
Editorial review has deemed that any suppressed content does not materially affect the overall learning experience. Cengage Learning reserves the right to remove additional content at any time if subsequent rights restrictions require it.

6. Many debt agreements require borrowers to obtain the permission of the lender
before undertaking a major acquisition or asset sale. Why would the lender want to
include this type of restriction?
7. Betty Li, the CFO of a company applying for a new loan, states, “I will never agree
to a debt covenant that restricts my ability to pay dividends to my shareholders
because it reduces shareholder wealth.” Do you agree with this argument?
8. Cambridge Construction Company follows the percentage-of-completion method
for reporting long-term contract revenues. The percentage-of-completion is based
on the cost of materials shipped to the project site as a percentage of total expected
material costs. Cambridge’s major debt agreement includes restrictions on net
worth, interest coverage, and minimum working capital requirements. A leading
analyst claims that “the company is buying its way out of these covenants by spend-
ing cash and buying materials, even when they are not needed.” Explain how this
might be possible.
9. Can Cambridge improve its Z score by behaving as the analyst claims in Question 8?
Is this change consistent with economic reality?
10. A banker asserts, “I avoid lending to companies with negative cash from operations
because they are too risky.” Is this a sensible lending policy?
11. A leading retailer finds itself in a financial bind. It does not have sufficient cash flow
from operations to finance its growth, and it is close to violating the maximum debt-
to-assets ratio allowed by its covenants. The Vice-President for Marketing suggests,
“We can raise cash for our growth by selling the existing stores and leasing them
back. This source of financing is cheap since it avoids violating either the debt-
to-assets or interest-coverage ratios in our covenants.” Do you agree with his analy-
sis? Why or why not? As the firm’s banker, how would you view this arrangement?
NOTES
1. The same is true of preferred dividends. However, when preferred stock is cumula-
tive, any dividends missed must be paid later, when and if the firm returns to
profitability.
2. Other relevant coverage ratios are discussed in Chapter 5.
3. R. Kaplan and G. Urwitz, “Statistical Models of Bond Ratings: A Methodological
Inquiry,” Journal of Business (April 1979): 231–61.
4. See R. Holthausen and R. Leftwich, “The Effect of Bond Rating Changes on Com-
mon Stock Prices,” Journal of Financial Economics (September 1986): 57–90 and J.
Hand, R. Holthausen, and R. Leftwich, “The Effect of Bond Rating Announcements
on Bond and Stock Prices,” Journal of Finance (June 1992): 733–52.
5. See E. Altman, “Financial Ratios, Discriminant Analysis, and the Prediction of
Corporate Bankruptcy,” Journal of Finance (September 1968 ): 58 9–609; E. Altman,
Corporate Financial Distress (New York : John Wiley, 1993); W. Beaver, “Financial
Ratios as Predictors of Distress,” Journal of Accounting Research, Supplement
(1966): 71–111; J. Ohlson, “Financial Ratios and the Probabilistic Prediction of
Bankruptcy,” Journal of Accounting Research (S pr ing 1980): 109–131; and M.
Zmijewski, “Predicting Corporate Bankruptcy: An Empirical Comparison of the
Extant Financial Distress Models” (workingpaper,SUNYatBuffalo,1983).
6. Zmijewski, op. cit.
7. Altman, Corporate Financial Distress, op. cit.
10-20
PART 3 • Business Analysis and Valuation Appl ications
Copyright 2012 Cengage Learning. All Rights Reserved. May not be copied, scanned, or duplicated, in whole or in part. Due to electronic rights, some third party content may be suppressed from the eBook and/or eChapter(s).
Editorial review has deemed that any suppressed content does not materially affect the overall learning experience. Cengage Learning reserves the right to remove additional content at any time if subsequent rights restrictions require it.
8. For private firms, Altman, ibid., adjusts the public model by changing the numerator
for the variable X
4
from the market value of equity to the book value. The revised
model follows:
Z ¼ :717ðX
1
Þþ:847ðX
2
Þþ3:11ðX
3
Þþ0:420ðX
4
Þþ:998ðX
5
Þ
Where
X
1
¼ net working capital/total assets
X
2
¼ retained earnings/total assets
X
3
¼ EBIT/total assets
X
4
¼ book value of equity/book value of total liabilities
X
5
¼ sales/total assets
The model predicts bankruptcy when Z < 1.23. The range between 1.23 and 2.90 is
labeled the “gray area.”
9. See Altman, Corporate Financial Distress, op. cit.
10. In the period from January 1994 through July 2011, distressed investing outper-
formed 10 out of 11 other strategies that were tracked by the Dow Jones Credit
Suisse Hedge Fund Index. The average annual return over that period was 10.6 per-
cent versus a return of 8.0 percent for the S&P 500 index (assuming dividends were
reinvested in the index).
11. For a background on the development of the subprime mortgage market, see, for
instance, S. Chomsisengphet and A. Pennington-Cross, “The Evolution of the Sub-
prime Mortgage Market,” Federal Reserve Bank of St. Louis Review, January/Febru-
ary 2006, 88(1): pp. 31–56, http://research.stlouisfed.org/publications/review/06/01/
ChomPennCross.pdf, accessed February 2012.
12. For instance, the following conclusions are drawn by J. D. Coval, J. Jurek, and E.
Stafford, “The Economics of Structured Finance,” HBS working paper 09-060, 2008.
13. Detail on the Act from “Brief Summary of the Dodd-Frank Wall Street Reform and
Consumer Protection Act,” www.banking.senate.gov, accessed February 2012. The
entire Act can be seen at Dodd-Frank Wall Street Reform and Consumer Protection
Act, 111
th
Congress, 2
nd
session, www.sec.gov/about/laws/wallstreetreform-cpa.pdf,
accessed February 2012.
Credit Analysis and Distress Prediction 10-21
Copyright 2012 Cengage Learning. All Rights Reserved. May not be copied, scanned, or duplicated, in whole or in part. Due to electronic rights, some third party content may be suppressed from the eBook and/or eChapter(s).
Editorial review has deemed that any suppressed content does not materially affect the overall learning experience. Cengage Learning reserves the right to remove additional content at any time if subsequent rights restrictions require it.

Chapter
11
MERGERS AND
ACQUISITIONS
M
ergers and acquisitions have long been a popular form of corporate
investment, particularly in countries with Anglo-American forms of capital
markets. There is no question that these transactions provide a healthy
return to target stockholders. However, their value to acquiring shareholders is
less understood. Many skeptics point out that given the hefty premiums paid to
target stockholders, acquisitions tend to be negative-valued investments for acquiring
stockholders.
1
A number of questions can be examined using financial analysis for mergers and
acquisitions:
• Securities analysts can ask: Does a proposed acquisition create value for the acquir-
ing firm’s stockholders?
• Risk arbitrageurs can ask: What is the likelihood that a hostile takeover offer will
ultimately succeed, and are there other potential acquirers likely to enter the
bidding?
• Acquiring management can ask: Does this target fit our business strategy? If so,
what is it worth to us, and how can we make an offer that can be successful?
• Target management can ask: Is the acquirer’s offer a reasonable one for our stock-
holders? Are there other potential acquirers that would value our company more
than the current bidder?
• Investment bankers can ask: How can we identify potential targets that are likely to
be a good match for our clients? And how should we value target firms when we
are asked to issue fairness opinions?
In this chapter we focus primarily on the use of financial statement data and analysis
directed at evaluating whether a merger creates value for the acquiring firm’s
stockholders. However, our discussion can also be applied to these other merger
analysis contexts. The topic of whether acquisitions create value for acquirers focuses
on evaluating the (1) motivations for acquisitions, (2) pricing of offers, (3) forms of
payment, and (4) likelihood that an offer will be successful. Throughout the chapter we
use Pfizer Inc.’s acquisition of Wyeth in 2009 to illustrate how financial analysis can be
used in a merger context.
11-1
Copyright 2012 Cengage Learning. All Rights Reserved. May not be copied, scanned, or duplicated, in whole or in part. Due to electronic rights, some third party content may be suppressed from the eBook and/or eChapter(s).
Editorial review has deemed that any suppressed content does not materially affect the overall learning experience. Cengage Learning reserves the right to remove additional content at any time if subsequent rights restrictions require it.
MOTIVATIONFORMERGERORACQUISITION
There are a variety of reasons that firms merge or acquire other firms. Some acquiring
managers may want to increase their own power and prestige. Others, however, realize
that business combinations provide an opportunity to create new economic value for
their stockholders. New value can be created in the following ways:
1. Taking advantage of economies of scale. Mergers are often justified as a means of
providing the two participating firms with increased economies of scale. Econo-
mies of scale arise when one large firm can perform a function more efficiently
than two smaller firms. While Pfizer did not consider this the primary reason for
the acquisition of Wyeth, management did forecast potential operational savings of
$4 billion that would result from combining the operations of the two firms.
2
2. Improving target management. Another common motivation for acquisition is to
improve target management. A firm is likely to be a target if it has systematically
underperformed its industry. Historically poor performance could be due to bad
luck, but it could also be due to the firm’s managers making poor investment and
operating decisions or deliberately pursuing goals that increase their personal
power but cost stockholders.
3. Combining complementary resources. Firms may decide that a merger will create
value by combining complementary resources of the two partners. For example,
Pfizer viewed Wyeth’s strong presence in biotech drugs, vaccines, and consumer
health products as complementary to its own primarily prescription medicine
focus, with the combination resulting in a broadly diversified health care
company.
4. Capturing tax benefits. In the United States, the 1986 Tax Reform Act eliminated
many of the tax benefits from mergers and acquisitions. However, several merger
tax benefits remain. The major benefit is the acquisition of operating tax losses. If a
firm does not expect to earn sufficient profits to fully utilize operating tax loss car-
ryforward benefits, it may decide to buy another firm that is earning profits. The
operating losses and loss carryforwards of the acquirer can then be offset against
the target’ s taxable income.
3
A second tax benefit often attributed to mergers is
the tax shield that comes from increasing leverage for the target firm. This was
particularly relevant for leveraged buyouts in the 1980s.
4
5. Providing low-cost financing to a financially constrained target. If capital markets
are imperfect, perhaps because of information asymmetries between manage-
ment and outside investors, firms can face capital constraints. Information pro-
blems are likely to be especially severe for newly formed, high-growth firms.
These firms can be difficult for outside investors to value since they have short
track records, and their financial statements provide little insight into the value of
their growth opportunities. Further, since they typically have to rely on external
funds to finance their growth, capital market constraints for high-growth firms
are likely to affect their ability to undertake profitable new projects. Public capital
markets are therefore likely to be costly sources of funds for these types of firms.
An acquirer that understands the business and is willing to provide a steady source
of finance may therefore be able to add value.
5
6. Creating value through restructuring and break-ups. Acquisitions are often pursued
by financial investors such as leveraged buy-out firms that expect to create value by
significantly restructuring or even breaking up the firm. The break-up value is
expected to be larger than the aggregate worth of the entire firm. Often, a financial
investor will acquire a firm with a view of unlocking value from various
11-2
PART 3 • Business Analysis and Valuation Applications
Copyright 2012 Cengage Learning. All Rights Reserved. May not be copied, scanned, or duplicated, in whole or in part. Due to electronic rights, some third party content may be suppressed from the eBook and/or eChapter(s).
Editorial review has deemed that any suppressed content does not materially affect the overall learning experience. Cengage Learning reserves the right to remove additional content at any time if subsequent rights restrictions require it.
components of the firm’s asset base. For example, in 2011 investor Carl Icahn
made a series of unsolicited bids for Clorox Co., the U.S.-based consumer products
maker. Analysts and news media at the time speculated that his goal was to break
up the company and sell off the company’s many popular brands such as Clorox
bleach products, Kingsford charcoal, Brita water filters, Glad trash bags, and
Hidden Valley Ranch salad dressings.
6
7. Penetrating new geographies. Cross-border acquisitions are pursued by firms to
expand product markets, to capitalize on new technologies, and to capture labor
cost advantages that presumably could not have been achieved through joint
ventures or supplier contracts. In the 25-year period between 1986 and 2010, over
12 percent of all acquisitions in the United States were led by foreign buyers, with
nearly 1,500 such deals announced in 2010 alone.
7
8. Increasing product-market rents. Firms can also have incentives to merge in order
to increase product-market rents. By merging and becoming a dominant firm
in the industry, two smaller firms can collude to restrict their output and raise
prices, thereby increasing their profits. This circumvents problems that arise in
cartels of independent firms, where firms have incentives to cheat on the cartel
and increase their output.
While product-market rents make sense for firms as a motive for merging, the two
partners are unlikely to announce their intentions when they explain the merger to
their investors, since most countries have antitrust laws that regulate mergers between
two firms in the same industry. For example, in the United States there are three
major antitrust statutes—The Sherman Act of 1890, The Clayton Act of 1914, and
The Hart Scott Rodino Act of 1976.
Anti-competitive concerns were potentially significant for Pfizer’s acquisition of
Wyeth, since at the time of the merger announcement, Pfizer and Wyeth were the
largest and twelfth-largest pharmaceutical companies in the world, respectively.
8
Merger approval was required by the U.S. Federal Trade Commission (FTC), the
European Commission, and regulatory bodies in China, Australia, and Canada.
All did eventually approve the merger but required the combined firm to sell assets
in certain businesses and regions to preserve competition.
While many of the motivations for acquisitions are likely to create new economic
value for shareholders, some are not. Firms that are flush with cash but have few new
profitable investment opportunities are particularly prone to using their surplus cash to
make acquisitions. Stockholders of these firms would probably prefer that managers pay
out any surplus cash flows as dividends or use the funds to repurchase the firm’s stock.
However, these options reduce the size of the firm and the assets under management’s
control. Management may therefore prefer to invest the free cash flows to buy new com-
panies, even if they do not create value for stockholders. Of course, managers will never
announce that they are buying a firm because they are reluctant to pay out funds to
stockholders. They may explain the merger using one of the motivations discussed
above, or they may argue that they are buying the target at a bargain price.
Another motivation for mergers that is valued by managers but not stockholders is
diversification, which was a popular motivation for acquisitions in the 1960s and early
1970s. Acquirers sought to dampen their earnings volatility by buying firms in unrelated
businesses. Diversification as a motive for acquisitions has since been widely discredited.
Modern finance theorists point out that in a well-functioning capital market, investors
can diversify for themselves and do not need managers to do so for them. In addition,
diversification has been criticized when leading firms lose sight of their major competi-
tive strengths and expand into businesses where they do not have expertise.
9
These firms
Mergers and Acquisitions 11-3
Copyright 2012 Cengage Learning. All Rights Reserved. May not be copied, scanned, or duplicated, in whole or in part. Due to electronic rights, some third party content may be suppressed from the eBook and/or eChapter(s).
Editorial review has deemed that any suppressed content does not materially affect the overall learning experience. Cengage Learning reserves the right to remove additional content at any time if subsequent rights restrictions require it.

eventually recognize that diversification-motivated acquisitions do not create value, lead-
ing to divestitures of business units. Divestitures have been the source of almost a third
of all acquisitions over the past 25 years, and in 2010 alone, close to 3,100 deals were a
result of corporate divestitures.
10
Key Analysis Questions
In evaluating a proposed merger, analysts are interested in determining whether the
merger creates new wealth for acquiring and target stockholders, or whether it is
motivated by managers’ desires to increase their own power and prestige. Key ques-
tions for financial analysis are likely to include:
• What is the motivation(s) for an acquisition and the anticipated benefits dis-
closed by acquirers or targets?
• What are the industries of the target and acquirer? Are the firms related hori-
zontally or vertically? How close are the business relations between them? If
the businesses are unrelated, is the acquirer cash-rich and reluctant to return
free cash flows to stockholders?
• What are the key operational strengths of the target and the acquirer? Are
these strengths complementary? For example, does one firm have a renowned
research group and the other a strong distribution network?
• Is the acquisition a friendly one, supported by target management, or hostile? In the
case of a hostile takeover, which is more likely to occur for targets with poor-
performing management, will the transaction go through despite the opposition
of management who will want to preserve its jobs? Will the hostile acquirer have
sufficient access to information to mitigate the risk of overpayment?
• What is the premerger performance of the two firms? Performance metrics are
likely to include ROE, gross margins, general and administrative expenses to
sales, and working capital management ratios. On the basis of these measures,
is the target a poor performer in its industry, implying that there are oppor-
tunities for improved management? Is the acquirer in a declining industry and
searching for new directions?
• What is the tax position of both firms? What are the average and marginal
current tax rates for the target and the acquirer? Does the acquirer have oper-
ating loss carryforwards and the target taxable profits?
This analysis should help the analyst understand what specific benefits, if any,
the merger is likely to generate.
Motivation for Pfizer’s Acquisition of Wyeth
There were important industry-wide and company-specific factors in 2009 that moti-
vated Pfizer to acquire Wyeth.
11
Across the pharmaceutical industry in the late 2000s,
competition from generic drugs was increasingly making the traditional strategy of reli-
ance on a few blockbuster drugs obsolete, as difficult economic conditions and the
increased pervasiveness of managed care increased demand for the lower-priced generics.
Also, the profitability of blockbusters was being further reduced as specialty manufac-
turers found increasing success in gaining approval for drugs that closely replicated the
blockbuster drug without infringing on its patent. In addition, a tougher regulatory
approval climate made the in-house development of new ground-breaking drugs more
11-4
PART 3 • Business Analysis and Valuation Applications
Copyright 2012 Cengage Learning. All Rights Reserved. May not be copied, scanned, or duplicated, in whole or in part. Due to electronic rights, some third party content may be suppressed from the eBook and/or eChapter(s).
Editorial review has deemed that any suppressed content does not materially affect the overall learning experience. Cengage Learning reserves the right to remove additional content at any time if subsequent rights restrictions require it.
expensive, time-consuming, and risky, leading large firms such as Pfizer to acquire proven
products rather than to develop them in-house. Also, global demand was increasing—with
much of the higher growth opportunities in developing countries such as Latin America,
the Middle East, and China necessitating an increasingly global footprint in order to take
advantage of the growth in those markets.
12
Finally, the rapidly growing biotech segment
represented an attractive diversification option for the large pharmaceutical companies,
who again viewed acquisition or partnering as a more attractive option than developing
capabilities in-house. As a result of these market dynamics, large pharmaceutical firms
increasingly moved to broaden their product offerings, keep their pipelines full, and to
expand their geographic coverage—often by acquisition.
For Pfizer, the most pressing motivation in early 2009 was the impending loss of pat-
ent protection for the blockbuster drug Lipitor (the world’s top selling drug, which
accounted for 29 percent of Pfizer’s pharmaceutical revenues in 2008)
13
which, combined
with the inability of Pfizer to create a successful follow-up drug, threatened to create a
huge revenue hole for the company in the next few years (torcetrapib, a promising
potential replacement, had recently failed in late-stage testing). This looming issue, com-
bined with a lack of other high-quality prospects in its development pipeline, a languish-
ing company stock (which in early 2009 was trading at about a third of its July 2000
peak), and $23 billion in cash holdings, had analysts and shareholders pressuring man-
agement to make a big move. Historically, as well, Pfizer had grown by acquisition rather
than by developing its own blockbuster drugs, with major acquisitions of Warner-
Lambert in 2000 for $89 billion and Pharmacia in 2003 for $60 billion keeping its prod-
uct line full and giving it status as the world’s largest pharmaceutical company.
Operationally, Pfizer’ s acquisition of Wyeth would provide significant diversification
for the combined company, complementing Pfizer’s strength in human health pharma-
ceuticals with Wyeth’s strong presence in vaccines, injectable biologic drugs, veterinary
medicine, Alzheimer’s disease drugs, and consumer products such as Chapstick,
Centrum, Anacin, and Preparation H. In fact, in the combined company no drug
would represent more than 10 percent of total revenue,
14
buffering it from sudden
future revenue loss of a blockbuster such as Lipitor. In addition, management stressed
the enhanced global coverage of the combined company in both developed and emerg-
ing markets.
15
Potential cost savings due to streamlining were also a potential positive in a time of
reduced profit margins and increased competition. At the time of the merger, Pfizer pro-
jected potential savings at $4 billion from increased economies of scale and consolidation
of redundant operations, and announced plans to cut the combined work force by
15 percent (which represented 20,000 jobs).
16
Analysts and the financial media were mixed on the economic benefits that poten-
tially would be derived from the acquisition. While the pressing need for Pfizer to
replace the impending loss of revenue from the Lipitor patent expiration was recognized,
some nevertheless expressed concern as to whether Wyeth, with the patent expiration of
its two top drugs coming in the next two years, was the best target.
17
ACQUISITION PRICING
A well considered economic motivation for a merger or acquisition is a necessary but
not sufficient condition for it to create value for acquiring stockholders. The acquirer
must be careful to avoid overpaying for the target. Overpayment makes the transaction
highly desirable and profitable for target stockholders, but it diminishes the value of the
deal to acquiring stockholders. A financial analyst can use the following methods to
assess whether the acquiring firm is overpaying for the target.
Mergers and Acquisitions 11-5
Copyright 2012 Cengage Learning. All Rights Reserved. May not be copied, scanned, or duplicated, in whole or in part. Due to electronic rights, some third party content may be suppressed from the eBook and/or eChapter(s).
Editorial review has deemed that any suppressed content does not materially affect the overall learning experience. Cengage Learning reserves the right to remove additional content at any time if subsequent rights restrictions require it.
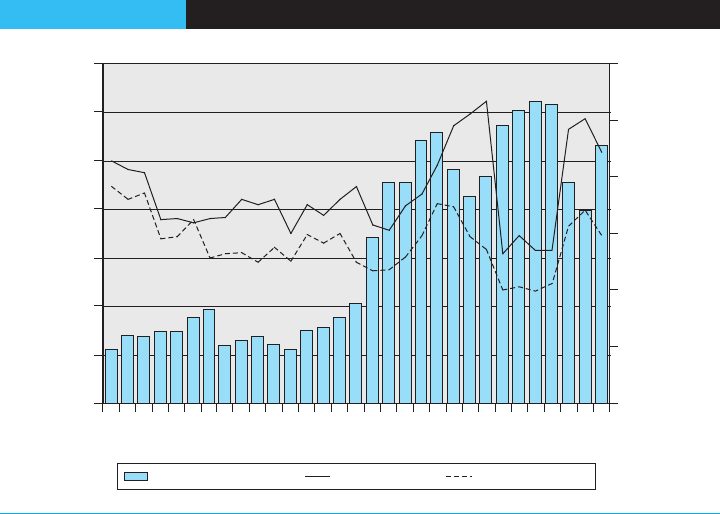
Analyzing Premium Offered to Target Stockholders
One popular way to assess whether the acquirer is overpaying for a target is to compare
the premium offered to target stockholders to premiums offered in similar transactions.
If the acquirer offers a relatively high premium, the analyst is typically led to conclude
that the transaction is less likely to create value for acquiring stockholders.
Premiums differ significantly for friendly and hostile acquisitions. Premiums tend to be
about 30 percent higher for hostile deals than for friendly offers, implying that hostile
acquirers are more likely to overpay for a target.
18
There are several reasons for this. First,
a friendly acquirer has access to the internal records of the target, improving the accuracy
in valuing the target and making it less likely that it will be surprised by hidden liabilities or
problems once it has completed the deal. In contrast, a hostile acquirer does not have this
advantage in valuing the target during negotiations and is more likely to overpay. Second,
the delays that typically accompany a hostile acquisition often provide opportunities for
competing bidders to make an offer for the target, leading to a bidding war.
Comparing a target’s premium to values for similar types of transactions is straight-
forward but has several practical problems. First, it is not obvious how to define a com-
parable transaction. Figure 11-1 shows the mean and median premiums paid for U.S.
targets over a 25-year period between 1986 and 2010. Average premiums rose from
around 40 percent through the mid-1990s to between 50 and 60 percent in 1999–2001.
Median premiums also increased during this period, from around 30 percent to 40 per-
cent. Despite the increase in M&A activity in 2004 and 2005, both average and median
premiums dropped significantly from the highs of 1999–2001 to only 31 to 35 and 23 to
24 percent, respectively. Recently, premiums have rebounded—in 2008–2010 average
premiums ranged again between 50 and 60 percent, with median premiums in the
35 to 40 percent range.
19
However, mean and median premiums have to be interpreted
FIGU RE 11- 1 Merger Activity and Premium Paid: 1981–2010
0.0%
10.0%
20.0%
30.0%
40.0%
50.0%
60.0%
70.0%
1980
1982
1984
1986
1988
1990
1992
1994
1996
1998
2000
2002
2004
2006
2008
2010
Premium
–
2,000
4,000
6,000
8,000
10,000
12,000
# of Deals
# of Announcements Mean premium Median premium
Source: Mergerstat Review 2011 (FactSet Mergerstat, LLC).
11-6 PART 3 • Business Analysis and Valuation Applications
Copyright 2012 Cengage Learning. All Rights Reserved. May not be copied, scanned, or duplicated, in whole or in part. Due to electronic rights, some third party content may be suppressed from the eBook and/or eChapter(s).
Editorial review has deemed that any suppressed content does not materially affect the overall learning experience. Cengage Learning reserves the right to remove additional content at any time if subsequent rights restrictions require it.
with caution since there is considerable variation across transactions, making it difficult
to use these estimates as a benchmark.
A second problem in using premiums offered to target stockholders to assess whether
an acquirer overpaid is that measured premiums can be misleading if an offer is antici-
pated by investors. The stock price run-up for the target will then tend to make estimates
of the premium appear relatively low. This limitation can be partially offset by using tar-
get stock prices one month prior to the acquisition offer as the basis for calculating pre-
miums. However, in some cases offers may have been anticipated for even longer than
one month.
Finally, using target premiums to assess whether an acquirer overpaid ignores the
value of the target to the acquirer after the acquisition. The acquirer expects to benefit
from the merger by improving the target firm’s operating performance through a combi-
nation of economies of scale, improved management, tax benefits, and spillover effects
derived from the acquisition. Clearly, acquirers will be willing to pay higher premiums
for targets that are expected to generate higher merger benefits. Thus, examining the pre-
mium alone cannot determine whether the acquisition creates value for acquiring
stockholders.
Analyzing Value of the Target to the Acquirer
A second and more reliable way of assessing whether the acquirer has overpaid for the
target is to compare the offer price to the estimated value of the target to the acquirer.
This latter value can be computed using the valuation techniques discussed in Chapters 7
and 8. The most popular methods of valuation used for mergers and acquisitions are
earnings multiples and discounted cash flows. Since a comprehensive discussion of
these techniques is provided earlier in the book, we focus here on implementation issues
that arise for valuing targets in mergers and acquisitions.
We recommend first computing the value of the target as an independent firm. This
provides a way of checking whether the valuation assumptions are reasonable, since
for publicly listed targets we can compare our estimate with premerger market prices. It
also provides a useful benchmark for thinking about how the target’s performance, and
hence its value, is likely to change once it is acquired.
Earnings Multiples
To estimate the value of a target to an acquirer using earnings multiples, we have to
forecast earnings for the target and decide on an appropriate earnings multiple, as
follows:
Step 1: Fore casting earnings Earnings forecasts are usually made by first forecasting
next year’s net income for the target, assuming no acquisition. Historical sales growth
rates, gross margins, and average tax rates are useful in building a pro forma income
model. Once we have forecasted the income for the target as an independent firm, we
can incorporate into the pro forma model any improvements in earnings performance
that we expect to result from the acquisition. Performance improvements can be mod-
eled on numerous dimensions including:
• Higher operating margins through economies of scale in purchasing, or increased
market power;
• Reductions in expenses as a result of consolidating research and development
staffs, sales forces, and/or administration; or
• Lower average tax rates from taking advantage of operating tax loss carryforwards.
Mergers and Acquisitions 11-7
Copyright 2012 Cengage Learning. All Rights Reserved. May not be copied, scanned, or duplicated, in whole or in part. Due to electronic rights, some third party content may be suppressed from the eBook and/or eChapter(s).
Editorial review has deemed that any suppressed content does not materially affect the overall learning experience. Cengage Learning reserves the right to remove additional content at any time if subsequent rights restrictions require it.
Step 2: Determining the price-earnings multiple How do we determine the earnings
multiple to be applied to our earnings forecasts? If the target firm is listed, it may be
tempting to use the preacquisition price-earnings multiple to value postmerger earnings.
However, there are several limitations to this approach. First, for many targets, earnings
growth expectations are likely to change after a merger, implying that there will be a dif-
ference between the pre- and postmerger price-earnings multiples. Postmerger earnings
should then be valued using a multiple for firms with comparable growth and risk char-
acteristics. A second problem is that premerger price-earnings multiples are unavailable
for unlisted targets. Once again it becomes necessary to decide which types of listed
firms are likely to be good comparables. In addition, since the earnings being valued
are the projected earnings for the next 12 months or the next full fiscal year, the appro-
priate benchmark ratio should be a forward price-earnings ratio. Finally, if a premerger
price-earnings multiple is appropriate for valuing postmerger earnings, care is required
to ensure that the multiple is calculated prior to any acquisition announcement, since
the price will increase in anticipation of the premium to be paid to target stockholders.
The following table summarizes how price-earnings multiples are used to value a tar-
get firm before an acquisition (assuming it will remain an independent entity) and to
estimate the value of a target to a potential acquirer:
Summary of Price-Earnings Valuation for Targets
..................................................................................................................................................
Value of target as an
independent firm
Target earnings forecast for the next year, assuming no
change in ownership, multiplied by its premerger forward PE
multiple.
Value of target to
potential acquirer
Target revised earnings forecast for the next year,
incorporating the effect of any operational changes made
by the acquirer, multiplied by its postmerger forward PE
multiple.
...................................................................................................................................................
Limitations of Pri ce-Earnings Valuation As explained in Chapter 7, there are serious
limitations to using earnings multiples for valuation. In addition to these limitations, the
method has two more that are specific to merger valuations:
1. PE multiples assume that merger performance improvements come either from an
immediate increase in earnings or from an increase in earnings growth (and hence
an increase in the postmerger PE ratio). In reality, improvements and savings can
come in many forms—gradual increases in earnings from implementing new oper-
ating policies, eliminating overinvestment, managing working capital better, or
paying out excess cash to stockholders. These types of improvements are not natu-
rally reflected in PE multiples.
2. PE models do not easily incorporate any spillover benefits from an acquisition for
the acquirer since they focus on valuing the earnings of the target.
Discounted Abnormal Earnings or Cash Flows
As discussed in Chapters 7 and 8, we can also value a company using the discounted
abnormal earnings and discounted free cash flow methods. These require us to first fore-
cast the abnormal earnings or free cash flows for the firm and then discount them at the
cost of capital, as follows.
Step 1: F orecastin g abnormal earnings / free cash flows A pro forma model of expected
future income and cash flows for the firm provides the basis for forecasting abnormal
11-8
PART 3 • Business Analysis and Valuation Applications
Copyright 2012 Cengage Learning. All Rights Reserved. May not be copied, scanned, or duplicated, in whole or in part. Due to electronic rights, some third party content may be suppressed from the eBook and/or eChapter(s).
Editorial review has deemed that any suppressed content does not materially affect the overall learning experience. Cengage Learning reserves the right to remove additional content at any time if subsequent rights restrictions require it.
earnings / free cash flows. As a starting point, the model should be constructed under the
assumption that the target remains an independent firm. The model should reflect the
best estimates of future sales growth, cost structures, working capital needs, investment
and research and development needs, and cash requirements for known debt retire-
ments, developed from a financial analysis of the target. The abnormal earnings method
requires that we forecast abnormal earnings or net operating profit after tax (NOPAT)
for as long as the firm expects new investment projects to earn more than their cost of
capital. Under the free cash flow approach, the pro forma model will forecast free cash
flows to either the firm or to equity, typically for a period of five to ten years. Once we
have a model of the abnormal earnings or free cash flows, we can incorporate any
improvements in earnings / free cash flows that we expect to result from the acquisition.
These will include the cost savings, cash received from asset sales, benefits from eliminat-
ing overinvestment, improved working capital management, and excess cash paid out to
stockholders.
Step 2: Compute the discount rate If we are valuing the target’s postacquisition abnor-
mal NOPAT or cash flows to the firm, the appropriate discount rate is the weighted
average cost of capital (WACC) for the target, using its expected postacquisition capital
structure. Alternatively, if the target’s equity cash flows are being valued directly or if we
are valuing abnormal earnings, the appropriate discount rate is the target’s postacquisi-
tion cost of equity rather than its WACC. Two common mistakes are to use the
acquirer’s cost of capital or the target’s preacquisition cost of capital to value the post-
merger abnormal earnings / cash flows from the target.
The computation of the target’s postacquisition cost of capital can be complicated if
the acquirer plans to make a change to the target’s capital structure after the acquisition,
since the target’s costs of debt and equity will change. As discussed in Chapter 8, this
involves estimating the asset beta for the target, calculating the new equity and debt
betas under the modified capital structure, and finally computing the revised cost of
equity capital or WACC. As a practical matter, the effect of these changes on the
WACC is likely to be quite small unless the revision in leverage has a significant effect
on the target’s interest tax shields or its likelihood of financial distress.
The following table summarizes how the discounted abnormal earnings / cash flow
methods can be used to value a target before an acquisition (assuming it will remain an
independent entity) and to estimate the value of a target firm to a potential acquirer.
Summary of Discounted Abnormal Earnings / Cash Flow Valuation for Targets
...................................................................................................................................................
Value of target as an
independent firm
(a) Present value of abnormal earnings / free cash flows to
target equity assuming no acquisition, discounted at
premerger cost of equity, or
(b) Present value of abnormal NOPAT / free cash flows to
target debt and equity assuming no acquisition, discounted
at premerger WACC, less value of debt.
Value of target to
potential acquirer
(a) Present value of abnormal earnings / free cash flows to
target equity, including benefits from merger, discounted at
postmerger cost of equity, or
(b) Present value of abnormal NOPAT / free cash flows to
target debt and equity, including benefits from merger, dis-
counted at postmerger WACC, less value of debt.
....................................................................................................................................................
Step 3: Analyze sensitivity Once we have estimated the expected value of a target, we
will want to examine the sensitivity of our estimate to changes in the model assumptions.
Mergers and Acquisitions 11-9
Copyright 2012 Cengage Learning. All Rights Reserved. May not be copied, scanned, or duplicated, in whole or in part. Due to electronic rights, some third party content may be suppressed from the eBook and/or eChapter(s).
Editorial review has deemed that any suppressed content does not materially affect the overall learning experience. Cengage Learning reserves the right to remove additional content at any time if subsequent rights restrictions require it.

For example, answering the following questions can help the analyst assess the risks
associated with an acquisition:
• What happens to the value of the target if it takes longer than expected for the
benefits of the acquisition to materialize?
• What happens to the value of the target if the acquisition prompts its primary
competitors to respond by also making an acquisition? Will potential changes in
industry dynamics affect the firm’s plans and estimates?
Key Analysis Questions
To analyze the pricing of an acquisition, the analyst is interested in assessing the
value of the acquisition benefits to be generated by the acquirer relative to the
price paid to target stockholders. Analysts are therefore likely to be interested in
answers to the following questions:
• What is the premium that the acquirer paid for the target’s stock? What does
this premium imply for the acquirer in terms of future performance improve-
ments to justify the premium?
• What are the likely performance improvements that management expects to
generate from the acquisition? For example, are there likely to be increases in
the revenues for the merged firm from new products, increased prices, or bet-
ter distribution of existing products? Alternatively, are there cost savings as a
result of taking advantage of economies of scale, improved efficiency, or a
lower cost of capital for the target?
• What is the value of any performance improvements? Values can be estimated
using multiples or discounted abnormal earnings / cash flow methods.
Pfizer’s Pricing of Wyeth
Pfizer’s $68 billion price for Wyeth represented a 29 percent premium to target stock-
holders over the market value on January 22, 2009, the day before the Wall Street Jour-
nal reported on the possible deal. This was below the mean and median premiums
reported for all acquisitions during that year (shown in Figure 11-1 as 58.7 percent and
39.8 percent, respectively), perhaps in some part reflecting its timing as the first major
deal announcement since the beginning of the global financial crisis.
In terms of traditional multiples-based forms of valuation, Pfizer’s pricing of Wyeth
appears to be reasonable. For example, at the time of the announcement of Pfizer’s
offer, the PE multiple for other firms in the pharmaceutical and biotech industries that
were comparable to Wyeth ranged from 13.7 to 18.6. Pfizer’s offer valued Wyeth at
15.4 times current earnings.
20
The market reaction to the acquisition announcement suggests that analysts believed
that the deal was not necessarily a positive one for Pfizer’s stockholders—Pfizer’ s stock
price dropped by a little over 10 percent on January 26, 2009, the day the deal was
announced (the S&P 500 registered a .6 percent gain on that day), and throughout
2009, Pfizer stock continued to underperform the market index. By October 15, the
date the deal closed, Pfizer stock had regained ground, increasing 13 percent since
the deal announcement, but it still lagged the 31 percent rebound of the S&P 500 index
during the same period. Pfizer stock ended 2009 with a loss of .5 percent for the year,
compared to a gain for the S&P 500 market index of 20 percent.
21
All else being equal,
it seems that investors were not convinced that the deal made sense for Pfizer.
11-10
PART 3 • Business Analysis and Valuation Appl ications
Copyright 2012 Cengage Learning. All Rights Reserved. May not be copied, scanned, or duplicated, in whole or in part. Due to electronic rights, some third party content may be suppressed from the eBook and/or eChapter(s).
Editorial review has deemed that any suppressed content does not materially affect the overall learning experience. Cengage Learning reserves the right to remove additional content at any time if subsequent rights restrictions require it.
Subsequent short-term results for Pfizer suggested that at least on the cost-cutting front
the merger was resulting in expected synergies. In late 2010, Pfizer reported that it had
achieved approximately one half of the forecast $4–5 billion in cost savings announced
at the time of the merger.
22
However, the longer term issue of revenue loss due to expiring
patents (with Lipitor and eight other high revenue drugs coming off patent protection
by 2015) continued to weigh on the company stock; as of the end of third quarter 2011,
Pfizer stock had increased a total of 13 percent since the merger announcement, well
underperforming the S&P 500, which increased 35 percent over the same period.
23
ACQUISITION FINANCING AND FORM OF PAYMENT
Even if an acquisition is undertaken to create new economic value and is priced judi-
ciously, it may still destroy shareholder value if it is inappropriately financed. Several
financing options are available to acquirers, including issuing stock or warrants to target
stockholders, or acquiring target stock using surplus cash or proceeds from new debt.
The trade-offs between these alternatives from the standpoint of target stockholders usu-
ally hinge on their tax and transaction cost implications. For acquirers, they can affect
the firm’s capital structure and provide new information to investors.
As we will discuss, the financing preferences of acquiring and target stockholders can
diverge. Financing arrangements can therefore increase or reduce the attractiveness of an
acquisition from the standpoint of acquiring stockholders. As a result, a complete analy-
sis of an acquisition will include an examination of the implications of the financing
arrangements for the acquirer.
Effect of Form of Payment on Acquiring Stockholders
From the perspective of the acquirer, the form of payment is essentially a financing deci-
sion. As discussed in Chapter 10, in the long term firms choose whether to use debt or
equity financing to balance the tax and incentive benefits of debt against the risks of
financial distress. For acquiring stockholders, the costs and benefits of different financing
alternatives therefore usually depend on three factors described below: how the offer
affects their firm ’s capital structure, any information effects associated with different
forms of financing, and control issues arising from the form of payment.
Capital Structure Effects of Form of Financing
In acquisitions where debt financing or surplus cash are the primary form of consider-
ation for target shares, the acquisition increases the net financial leverage of the acquirer.
This increase in leverage may be part of the acquisition strategy, since one way an
acquirer can add value to an inefficient firm is to lower its taxes by increasing interest
tax shields. However, in many acquisitions an increase in postacquisition leverage is a
side effect of the method of financing and not part of a deliberate tax-minimizing strat-
egy. Demands by target shareholders for consideration in cash could lead the acquirer to
have a postacquisition capital structure that can potentially reduce shareholder value for
the acquirer by increasing the risk of financial distress.
To assess whether an acquisition leads an acquirer to have too much leverage, finan-
cial analysts can assess the acquirer’s financial risk following the proposed acquisition by
these methods:
• Analyze the business risks and the volatility of the combined, postacquisition cash
flows against the level of debt in the new capital structure, and the implications for
possible financial distress.
Mergers and Acquisitions 11-11
Copyright 2012 Cengage Learning. All Rights Reserved. May not be copied, scanned, or duplicated, in whole or in part. Due to electronic rights, some third party content may be suppressed from the eBook and/or eChapter(s).
Editorial review has deemed that any suppressed content does not materially affect the overall learning experience. Cengage Learning reserves the right to remove additional content at any time if subsequent rights restrictions require it.
• Assess the pro forma financial risks for the acquirer under the proposed financing
plan. Popular measures of financial risk include debt-to-equity and interest-
coverage ratios, as well as projections of cash flows available to meet debt repay-
ments. The ratios can be compared to similar performance metrics for the acquiring
and target firms’ industries to determine whether postmerger ratios indicate that the
firm’s probability of financial distress has increased significantly.
• Examine whether there are important off-balance-sheet liabilities for the target
and/or acquirer that are not included in the pro forma ratio and cash flow analysis
of postacquisition financial risk.
• Determine whether the pro forma assets for the acquirer are largely intangible and
therefore sensitive to financial distress. Measures of intangible assets include such
ratios as market to book equity and tangible assets to the market value of equity.
Informati on Problems and the Form of Financing
In the short term, information asymmetries between managers and external investors
can make managers reluctant to raise equity to finance new projects. Managers’ reluc-
tance arises from their fear that investors will interpret the decision as an indication
that the firm’s stock is overvalued. In the short term, this effect can lead managers to
deviate from the firm’s long-term optimal mix of debt and equity. As a result, acquirers
are likely to prefer to use internal funds or debt to finance an acquisition since these
forms of consideration are less likely to be interpreted negatively by investors.
24
The information effects imply that firms forced to use stock financing are likely to
face a stock price decline when investors learn of the method of financing.
25
From the
viewpoint of financial analysts, the financing announcement may, therefore, provide
valuable news about the acquiring managers’ views of their own company’s value prior
to the acquisition. On the other hand, it should have no implications for analysis of
whether the acquisition creates value for acquiring shareholders since the news reflected
in the financing announcement is about the preacquisition value of the acquirer and not
about the postacquisition value of the target to the acquirer.
A second information problem arises if the acquiring management does not have
good information about the target. Stock financing then provides a way for acquiring
stockholders to share the information risks with target shareholders. If the acquirer
finds out after the acquisition that the value of the target is less than previously antici-
pated, the accompanying decline in the acquirer’s equity price will be partially borne by
target stockholders who continue to hold the acquirer’s stock. In contrast, if the target’s
shares were acquired in a cash offer, any postacquisition loss would be fully borne by the
acquirer’s original stockholders. The risk-sharing benefits from using stock financing
appear to be widely recognized for acquisitions of private companies, where public infor-
mation on the target is largely unavailable.
26
In practice it appears to be considered less
important for acquisitions of large public corporations.
Cont rol and the Form of Payment
There is a significant difference between the use of cash and stock in terms of its impact
on the voting control of the combined firm postacquisition. Financing an acquisition
with cash allows the acquirer to retain the structure and composition of its equity own-
ership. On the other hand, depending on the size of the target firm relative to the
acquirer, an acquisition financed with stock could have a significant impact on the own-
ership and control of the firm postacquisition. This could be particularly relevant to a
11-12
PART 3 • Business Analysis and Valuation Appl ications
Copyright 2012 Cengage Learning. All Rights Reserved. May not be copied, scanned, or duplicated, in whole or in part. Due to electronic rights, some third party content may be suppressed from the eBook and/or eChapter(s).
Editorial review has deemed that any suppressed content does not materially affect the overall learning experience. Cengage Learning reserves the right to remove additional content at any time if subsequent rights restrictions require it.

family-controlled acquirer. Therefore, the effects of control need to be balanced against
the other costs and benefits when determining the form of payment.
Over the last 25 years, offers that are 100 percent cash have comprised 49 percent of
all acquisitions, exceeding all-stock offers (26 percent) and mixed stock and cash offers
(25 percent). The popularity of all-cash offers has increased since 2000, rising to 60 percent
of all deals in 2010 whereas the use of all-stock offers has declined to only 21 percent.
27
Effect of Form of Payment on Target Stockholders
The key payment considerations for target stockholders are the tax and transaction cost
implications of the acquirer’s offer.
Tax Effects of Different Forms of Consid eration
Target stockholders care about the after-tax value of any offer they receive for their
shares. In the United States, whenever target stockholders receive cash for their shares,
they are required to pay capital gains tax on the difference between the takeover offer
price and their original purchase price. Alternatively, if they receive shares in the
acquirer as consideration and the acquisition is undertaken as a tax-free reorganization,
they can defer any taxes on the capital gain until they sell the new shares.
As a result, U.S. tax laws appear to cause target stockholders to prefer a stock offer to
a cash one. This is certainly likely to be the case for a target founder who still has a sig-
nificant stake in the company. If the company’s stock price has appreciated over its life,
the founder will face a substantial capital gains tax on a cash offer and will therefore
probably prefer to receive stock in the acquiring firm. However, cash and stock offers
can be tax-neutral for some groups of stockholders. For example, consider the tax impli-
cations for risk arbitrageurs, who take a short-term position in a company that is a take-
over candidate in the hope that other bidders will emerge and increase the takeover
price. They have no intention of holding stock in the acquirer once the takeover is com-
pleted and will pay ordinary income tax on any short-term trading gain. Cash and stock
offers therefore have identical after-tax values for risk arbitrageurs. Similarly, tax-exempt
institutions are likely to be indifferent to whether an offer is in cash or stock.
Transact ion Costs and the Form of Payment
Transaction costs are another factor related to the form of payment that can be relevant
to target stockholders. Transaction costs are incurred when target stockholders sell any
stock received as consideration for their shares in the target. These costs will not be faced
by target stockholders if the bidder offers them cash. Transaction costs are unlikely to be
significant for investors who intend to hold the acquirer’s stock following a stock acqui-
sition. However, they may be relevant for investors who intend to sell, such as risk
arbitrageurs.
Key Analysis Questions
For an analyst focused on the acquiring firm, it is important to assess how the
method of financing affects the acquirer’s capital structure and its risks of financial
distress by asking the following questions:
• What is the leverage for the newly created firm? How does this compare to
leverage for comparable firms in the industry?
Mergers and Acquisitions 11-13
Copyright 2012 Cengage Learning. All Rights Reserved. May not be copied, scanned, or duplicated, in whole or in part. Due to electronic rights, some third party content may be suppressed from the eBook and/or eChapter(s).
Editorial review has deemed that any suppressed content does not materially affect the overall learning experience. Cengage Learning reserves the right to remove additional content at any time if subsequent rights restrictions require it.

• What are the projected future cash flows for the merged firm? Are these suffi-
cient to meet the firm’s debt commitments? How much of a cushion does the
firm have if future cash flows are lower than expected? Is the firm’s debt level
likely to impair its ability to finance profitable future investments if future
cash flows are below expectations?
Pfizer’s Financing of Wyeth
Pfizer offered Wyeth shareholders $33 in cash and 0.985 shares of Pfizer stock for each
Wyeth share. With the stock component valued at $17.19 per share, the combined cash
and equity implied a total offer of roughly $68 billion. While the premerger equity value
of Wyeth represented 31 percent of the combined market value, the large cash compo-
nent of the deal caused the postmerger proportion of ownership to drop to about 16 per-
cent for Wyeth shareholders and to rise to 84 percent for Pfizer shareholders.
The merger was structured as a taxable transaction for federal income tax purposes.
This implied that Wyeth shareholders would recognize capital gain or loss for federal
income tax purposes as a result of the transaction. By using debt in addition to stock
and cash to finance the acquisition, Pfizer increased its financial leverage significantly—
increasing total debt as a percentage of equity from 30 percent prior to the acquisition to
54 percent at the end of 2009. Also, in order to help finance the large cash outlay
required for the acquisition, Pfizer cut its dividend by 50 percent upon announcing the
deal (which likely also contributed to the significant drop in share price when the deal
was announced). Reacting to this material change in Pfizer’s financial structure, Standard
and Poor’s downgraded Pfizer’s credit rating from AAA to AA on October 16, 2009—the
day after the Wyeth acquisition closed, with the other agencies following suit.
28
ACQUISITION OUTCOME
The final question of interest to the analyst evaluating a potential acquisition is whether
it will indeed be completed. If an acquisition has a clear value-based motive, the target is
priced appropriately, and its proposed financing does not create unnecessary financial
risks for the acquirer, it may still fail because the target receives a higher competing
bid, there is opposition from entrenched target management, or the transaction fails to
receive necessary regulatory approval. Therefore, to evaluate the likelihood that an offer
will be accepted, the financial analyst has to understand whether there are potential com-
peting bidders who could pay an even higher premium to target stockholders than is
currently offered. They also have to consider whether target managers are entrenched
and likely to oppose an offer to protect their jobs, as well as the political and regulatory
environment in which the target and the acquirer operate.
Other Potential Acquirers
If there are other potential bidders for a target, especially ones who place a higher value
on the target, there is a strong possibility that the bidder in question will be unsuccessful.
Target management and stockholders have an incentive to delay accepting the initial
offer to give potential competitors time to also submit a bid. From the perspective of
the initial bidder, this means that the offer could potentially reduce stockholder value
by the cost of making the offer (including substantial investment banking and legal
fees). In practice, a losing bidder can usually recoup these losses and sometimes even
11-14
PART 3 • Business Analysis and Valuation Appl ications
Copyright 2012 Cengage Learning. All Rights Reserved. May not be copied, scanned, or duplicated, in whole or in part. Due to electronic rights, some third party content may be suppressed from the eBook and/or eChapter(s).
Editorial review has deemed that any suppressed content does not materially affect the overall learning experience. Cengage Learning reserves the right to remove additional content at any time if subsequent rights restrictions require it.

make healthy profits from selling to the successful acquirer any shares it has accumu-
lated in the target.
On some occasions, the original bidder includes a break-up fee in the acquisition con-
tract that is payable should the target company choose to be acquired by a different
partner. For example, in late 2005 Johnson & Johnson signed an agreement to acquire
Guidant Corporation for about $21 billion. A takeover battle for Guidant resulted when
Boston Scientific made a higher offer. Over the ensuing seven weeks (from December
2005 to January 2006), both Johnson & Johnson and Boston Scientific increased their
bids on multiple occasions. Eventually, Boston Scientific won with a $27 billion offer.
However, in addition to the purchase price, Boston Scientific had to reimburse Guidant
the termination fee of $705 million payable to Johnson & Johnson.
Key Analysis Questions
The financial analyst can determine whether there are other potential acquirers for a
target and how they value the target by asking the following questions:
• Who are the acquirer’s major competitors? Could any of these firms provide
an even better fit for the target?
• Are there other firms that could also implement the initial bidder’s acquisition
strategy? For example, if this strategy relies on developing benefits from com-
plementary assets, look for potential bidders who also have assets complemen-
tary to the target. If the goal of the acquisition is to replace inefficient
management, what other firms in the target’s industry could provide manage-
ment expertise?
Target Management Entrenchment
If target managers are entrenched and fearful for their jobs, it is likely that they will
oppose a bidder’s offer. Some firms have implemented “golden parachutes” for top man-
agers to allay their concerns about job security at the time of an offer. Golden parachutes
provide top managers of a target firm with attractive compensation rewards should the
firm get taken over.
29
However, many firms do not have such schemes, and opposition
to an offer from entrenched management is a very real possibility.
More generally, there are a variety of structural impediment s known as takeover
def ense mechanisms that prov ide a di sincentive to acquiring firms. Many such defenses
were used during the turbulent 1980s, when hostile acquisitions were at their peak.
Some of the most widely adopted include poison pills, staggered board s, super-
majority rules, dual-class recapitalizations, fair-price provisions, ESOP plans, and
changes in states of incorporation to states with more restrictive anti-takeover laws.
While the existence of takeover defenses for a target indicates that its manag ement is
likely to fi ght a bidding firm’s off er, defenses have typically not prevented an acquisition
from taking place. Instead, they tend to cause delays , which increase t he likelihood that
there will be competing offers made for the target, including offers by friendly parties
solicited by target man agement, called “white knights.” Takeover d efenses, therefore,
increase the likelihood that the bidder in question will be outbid for the target, or that
it will have to increase i ts offer significantly to win a bid ding contest. Given these risks,
som e h ave argued that acquirers are now less likely to embark on a potentially hostile
acquisition.
Mergers and Acquisitions 11-15
Copyright 2012 Cengage Learning. All Rights Reserved. May not be copied, scanned, or duplicated, in whole or in part. Due to electronic rights, some third party content may be suppressed from the eBook and/or eChapter(s).
Editorial review has deemed that any suppressed content does not materially affect the overall learning experience. Cengage Learning reserves the right to remove additional content at any time if subsequent rights restrictions require it.

Key Analysis Questions
To assess whether the target firm’s management is entrenched and therefore likely
to oppose an acquisition, analysts can ask the following questions:
• Does the target firm have takeover defenses designed to protect management?
• Has the target been a poor performer relative to other firms in its industry? If
so, management’s job security is likely to be threatened by a takeover, leading
it to oppose any offers.
• Is there a golden parachute plan in place for target management? Golden para-
chutes provide attractive compensation for management in order to deter
opposition to a takeover for job security reasons.
Anti trust and Se curity Issues
Regulators such as the Federal Trade Commission in the U.S. and the European Compe-
tition Commission assess the effects of an acquisition on the competitive dynamics of the
industry in which the firms operate. The objective is to ensure that no one firm, through
mergers and acquisitions, creates a dominant position that can impede effective compe-
tition in specific geographies or product markets. For instance, in August 2011 the U.S.
Justice Department sued to block AT&T’s proposed $39 billion purchase of rival
T-Mobile USA on the grounds that the merger would substantially reduce competition
for mobile phone services in the United States.
30
In addition, political concerns around firms that have an impact on the national and
economic security of a country come under the scrutiny of local lawmakers, whose oppo-
sition can often derail cross-border acquisition efforts. The United States, for instance,
has a specific inter-agency committee that vets foreign takeovers of U.S. assets on
national security grounds. Two recent high profile cases—China’s CNOOC oil com-
pany’s proposed acquisition of California-based Unocal in mid-2005 and Dubai Ports
World’s acquisition of U.S. port terminals in March 2006—underscore the importance
of assessing this risk. Chevron, another interested bidder for Unocal, used CNOOC’s
links to the Chinese government to generate political opposition to the CNOOC bid,
which eventually led CNOOC to drop its offer. Similarly, political opposition based on
the United Arab Emirates government’s control of Dubai Ports World and the national
security concerns over port infrastructure forced the company to sell the U.S. operations
as part of its acquisition of British port operator P&O.
Key Analysis Questions
To assess whether the regulators and/or government is likely to oppose an acquisi-
tion, analysts can ask the following questions:
• What proportion of industry sales do the two firms control? Is this likely to be
of concern to regulators in countries in which the firms operate? Are the com-
bined firms likely to be able to reduce regulatory opposition by selling certain
business units?
• Is the target firm or the industry in which it operates of strategic importance or
in the national interest of the country in which it is located? Is the ownership
structure of the acquirer likely to create political opposition to the deal?
11-16
PART 3 • Business Analysis and Valuation Appl ications
Copyright 2012 Cengage Learning. All Rights Reserved. May not be copied, scanned, or duplicated, in whole or in part. Due to electronic rights, some third party content may be suppressed from the eBook and/or eChapter(s).
Editorial review has deemed that any suppressed content does not materially affect the overall learning experience. Cengage Learning reserves the right to remove additional content at any time if subsequent rights restrictions require it.

Analysis of Outcome of Pfizer’sOfferforWyeth
Analysts covering Wyeth had little reason to question whether Wyeth would be sold to
Pfizer. The offer was a friendly one that had received the approval of Wyeth’s manage-
ment and board of directors. There was some risk of another major pharmaceutical com-
pany entering the bidding for Wyeth—in fact, in the S-4 filed by Pfizer in March of
2009, there is mention of a “Company X” that approached Wyeth in December of 2008
to explore making a competitive bid (rumored at the time to be Abbott Labs).
31, 32
After
discussions with both companies, Wyeth management accepted Pfizer’s bid, determining
that difficult current market conditions and potential anti-competitive issues would likely
make a more attractive bid unlikely, and in the end no competing bid was made.
The complementary nature of the two companies’ product lines on the human health
side meant that the deal raised few antitrust concerns on that front. However, Pfizer and
Wyeth’s similar strength in animal health products was seen as a potential antitrust
issue. Consequently, regulators in the United States and in the European Union, Canada,
China, and Australia required the combined company to divest certain animal health
assets in those countries as a condition of approval. Pfizer agreed to the conditions, and
the acquisition was completed on October 15, 2009, nine months after announcement of
the initial agreement.
SUMMARY
This chapter summarizes how financial statement data and analysis can be used by
financial analysts interested in evaluating whether an acquisition creates value for an
acquiring firm’s stockholders. Obviously, much of this discussion is also likely to be rele-
vant to other merger participants, including target and acquiring management and their
investment banks.
For the external analyst, the first task is to identify the acquirer’s acquisition strategy.
We discuss a number of strategies. Some of these are consistent with maximizing
acquirer value, including acquisitions to take advantage of economies of scale, improve
target management, combine complementary resources, capture tax benefits, provide
low-cost financing to financially constrained targets, and increase product-market rents.
Other strategies appear to benefit managers more than stockholders. For example,
some unprofitable acquisitions are made because managers are reluctant to return free
cash flows to shareholders, or because managers want to lower the firm’s earnings vola-
tility by diversifying into unrelated businesses.
The financial analyst’s second task is to assess whether the acquirer is offering a rea-
sonable price for the target. Even if the acquirer’s strategy is based on increasing share-
holder value, it can overpay for the target. Target stockholders will then be well rewarded
but at the expense of acquiring stockholders. We show how the ratio analysis, forecast-
ing, and valuation techniques discussed earlier in the book can all be used to assess the
worth of the target to the acquirer.
The method of financing an offer is also relevant to a financial analyst’s review of an
acquisition proposal. If a proposed acquisition is financed with surplus cash or new debt,
it increases the acquirer’s financial risk. Financial analysts can use ratio analysis of the
acquirer’s postacquisition balance sheet and pro forma estimates of cash flow volatility
and interest coverage to assess whether demands by target stockholders for consideration
in cash lead the acquirer to increase its risk of financial distress.
Finally, the financial analyst is interested in assessing whether a merger is likely to be
completed once the initial offer is made, and at what price. This requires the analyst to
Mergers and Acquisitions 11-17
Copyright 2012 Cengage Learning. All Rights Reserved. May not be copied, scanned, or duplicated, in whole or in part. Due to electronic rights, some third party content may be suppressed from the eBook and/or eChapter(s).
Editorial review has deemed that any suppressed content does not materially affect the overall learning experience. Cengage Learning reserves the right to remove additional content at any time if subsequent rights restrictions require it.

determine whether there are other potential bidders, whether target management is
entrenched and likely to oppose a bidder’s offer, or whether the deal could fail due to
antitrust or security concerns.
DISCUSSION QUESTI ONS
1. Since the year 2000, there has been a noticeable increase in mergers and acquisitions
among firms in different countries (termed cross-border acquisitions). What factors
could explain this increase? What special issues can arise in executing a cross-border
acquisition and in ultimately meeting one’s objectives for a successful combination?
2. Private equity firms have become an important player in the acquisition market.
These private investment groups offer to buy a target firm, often with the coopera-
tion of management, and then take the firm private. Private equity buyouts rose
from just 2 percent of U.S. merger and acquisition activity in 2000 to 15 percent as
of December 2005. Private equity buyers tend to finance a significant portion of the
acquisition with debt.
a. What types of firms would make ideal candidates for a private equity buyout?
Why?
b. How might the buyout firm add sufficient value to the target to justify a high
buyout premium?
3. Kim Silverman, CFO of the First Public Bank Company, notes, “We are fortunate to
have a cost of capital of only 7 percent. We want to leverage this advantage by
acquiring other banks that have a higher cost of funds. I believe that we can add
significant value to these banks by using our lower cost financing.” Do you agree
with Silverman’s analysis? Why or why not?
4. The Boston Tea Company plans to acquire Hi Flavor Soda Co. for $60 per share, a
50 percent premium over current market price. John E. Grey, the CFO of Boston
Tea, argues that this valuation can easily be justified using a price-earnings analysis:
“Boston Tea has a price-earnings ratio of 15, and we expect that we will be able to
generate long-term earnings for Hi Flavor Soda of $5 per share. This implies that Hi
Flavor is worth $75 to us, well below our $60 offer price.” Do you agree with this
analysis? What are Grey’s key assumptions?
5. You have been hired by GT Investment Bank to work in the merger department.
The analysis required for all potential acquisitions includes an examination of the
target for any off-balance-sheet assets or liabilities that have to be factored into the
valuation. Prepare a checklist for your examination.
6. A target company is currently valued at $50 in the market. A potential acquirer
believes that it can add value in two ways: $15 of value can be added through better
working capital management, and an additional $10 of value can be generated by
making available a unique technology to expand the target’s new product offerings.
In a competitive bidding contest, how much of this additional value will the acquirer
have to pay out to the target’s shareholders to emerge as the winner?
7. In 2011 Comcast acquired a majority stake in NBC Universal in a deal that valued
the company at more than $30 billion. Analysts at the time tended to define the
rationale for the acquisition as being one of “conduit” acquiring “content”. Evaluate
the potential strategic merits of this rationale.
8. A leading oil exploration company decides to acquire an Internet company at a
50 percent premium. The acquirer argues that this move creates value for its own
stockholders because it can use its excess cash flows from the oil business to help
11-18
PART 3 • Business Analysis and Valuation Appl ications
Copyright 2012 Cengage Learning. All Rights Reserved. May not be copied, scanned, or duplicated, in whole or in part. Due to electronic rights, some third party content may be suppressed from the eBook and/or eChapter(s).
Editorial review has deemed that any suppressed content does not materially affect the overall learning experience. Cengage Learning reserves the right to remove additional content at any time if subsequent rights restrictions require it.

finance growth in the new Internet segment. Evaluate the economic merits of this
claim.
9. Under current U.S. accounting standards, acquirers are required to capitalize good-
will and report any subsequent declines in value as an impairment charge. What
performance metrics would you use to judge whether goodwill is impaired?
10. As an external adviser to the U.S. Government’s interagency committee that vets
foreign takeovers, you have been asked to provide expert testimony on the proposed
takeover of a major U.S. airport by a Dutch airport management services company.
Would you recommend that the acquisition be granted regulatory approval? What
are the different issues you will examine and present to the committee?
NOTES
1. In a review of studies of merger returns, Michael Jensen and Richard Ruback con-
clude that target shareholders earn positive returns from takeovers, but that acquir-
ing shareholders only break even. See M. Jensen and R. Ruback, “The Market for
Corporate Control: The Scientific Evidence,” Journal of Financial Economics 11
(April 1983): 5–50.
2. “Pfizer to Acquire Wyeth, Creating the World’s Premier Biopharmaceutical
Company,” Pfizer press release, January 26, 2009, http://www.pfizer.com/news/press_
releases/pfizer_press_release_archive.jsp#guid=20090126005624en&source=RSS_2009
&page=13, accessed October 2011.
3. Of course, another possibility is for the profitable firm to acquire the unprofitable
one. However, in the United States the IRS will disallow the use of tax loss carry-
forwards by an acquirer if it appears that an acquisition was tax-motivated.
4. See S. Kaplan, “Management Buyouts: Evidence on Taxes as a Source of Value,”
Journal of Finance 44 (1989): 611–632.
5. K. Palepu, “Predicting Takeover Targets: A Methodological and Empirical Analysis,”
Journal of Accounting and Economics 8 (March 1986): 3–36.
6. See, for instance, “Carl Icahn’s Latest Quest: Cleaning up with Clorox,” July 26, 2011,
post on blog “Schumpeter,” The Economist, http://www.economist.com/blogs/schump-
eter/2011/07/carl-icahns-latest-quest, accessed October 2011, also “Pending a Take-
over, Clorox’s multiple Brands come into Question,” Jennifer Collins, Marketplace
Morning Report for Wednesday, August 2, 2011, http://marketplace.publicradio.org/
display/web/2011/08/03/am-pending-a-takeover-cloroxs-multiple-brands-come-i nto-que
stion/, accessed October 2011.
7. FactSet Mergerstat, LLC, Mergerstat Review 2011 (Newark, NJ, 2011): 194–195.
8. Statement of the Federal Trade Commission Concerning Pfizer/Wyeth, FTC File No.
091-0053, http://www.ftc.g ov/os/caselist/09 10053/09 1014pwyet hstmt.pdf, accessed
October 2 011.
9. Chapter 2 discusses the pros and cons of corporate diversification and evidence on
its implications for firm performance.
10. FactSet Mergerstat, LLC, Mergerstat Review 2011 (Newark, NJ, 2011), pp. 194–195.
11. General pharmaceutical industry context from David Collis and Troy Smith, “Strategy
in the Twenty-First Century Pharmaceutical Industry: Merck & Co. and Pfizer Inc.,”
HBS No. 707-509 (Boston: Harvard Business School Publishing, 2007), http://www.
hbsp.com, accessed October 2011.
12. This was cited as a reason for the Wyeth acquisition in “Pfizer to Acquire Wyeth, Cre-
ating the World’s Premier Biopharmaceutical Company,” Pfizer press release, January
Mergers and Acquisitions 11-19
Copyright 2012 Cengage Learning. All Rights Reserved. May not be copied, scanned, or duplicated, in whole or in part. Due to electronic rights, some third party content may be suppressed from the eBook and/or eChapter(s).
Editorial review has deemed that any suppressed content does not materially affect the overall learning experience. Cengage Learning reserves the right to remove additional content at any time if subsequent rights restrictions require it.
26, 2009, http://www.pfizer.com/news/press_releases/pfizer_press_release_archive.jsp
#guid=20090126005624en&source=RSS_2009&page=13, accessed October 2011.
13. Pfizer Inc., December 31, 2008 Form 10-K (filed February 27, 2009), http://www.pfi-
zer.com/investors/sec_filings/sec_filings.jsp?month=2&day=27&year=2009&month1=
2&day1=28&year1=2009&filing=10-K&x=43&y=4, accessed October 2011.
14. “Pfizer And Wyeth Become One: Working Together for a Healthier World,” Pfizer
press release, October 16, 2009, http://www.pfizer.co m/n ews/press_releases/
pfizer_press_release_archive.jsp#guid=20091016005880en&source=RSS_2009&page=4,
accessed October 2011.
15. “Pfizer to Acquire Wyeth, Creating the World’s Premier Biopharmaceutical Com-
pany,” Pfizer press release, January 26, 2009, http://www.pfizer.com/news/press_
releases/pfizer_press_release_archive.jsp#guid=20090126005624en&source=RSS_2009&
page=13, accessed October 2011.
16. Ibid.
17. See, for instance, William Patalon III, “Pfizer-Wyeth Merger Underscores That
Bigger Isn’t Better,” February 2, 2009, blog post on DailyMarkets.com, http://www.
dailymarkets.com/stock/2009/02/02/pfizer-wyeth-merger-underscores-that-bigger-isn
%E2%80%99t-better/, accessed October 2011, also Catherine Arnst, “A Pfizer-Wyeth
Merger Isn’t the Cure all,” January 24, 2009, Bloomberg Businessweek , http://
www.businessweek.com/technology/content/jan2009/tc20090123_516076.htm, accessed
October 2011, also “Pfizer Eyes Wyeth. We Ask ‘Why?’” January 29, 2009, blog post
on Zacks.com, http://www.zacks.com/stock/news/16958/Pfizer+Eyes+Wyeth.+We+Ask
+%26quot%3BWhy%3F%26quot%3B, accessed October 2011.
18. See P. Healy, K. Palepu, and R. Ruback, “Which Mergers Are Profitable—Strategic
or Financial?” Sloan Management Review 38, no. 4 (Summer 1997): 45–58.
19. FactSet Mergerstat, LLC, Mergerstat Review 2011 (Newark, NJ, 2011): 25, 194–195.
20. Thomson ONE accessed October 2011.
21. Ibid.
22. “Its Acquisition of Wyeth Appears to be Paying off for Pfizer,” Associated Press,
August 3, 2010, http://www.nytimes.com/2010/08/04/business/04pfizer.html,
accessed October 2011.
23. Thomson ONE, accessed October 2011.
24. See S. Myers and N. Majluf, “Corporate Financing and Investment Decisions When
Firms Have Information That Investors Do Not,” Journal of Financial Economics
(June 1984): 187–221.
25. For evidence see N. Travlos, “Corporate Takeover Bids, Methods of Payments, and
Bidding Firms’ Stock Returns,” Journal of Finance 42 (1987): 943–963.
26. See S. Datar, R. Frankel, and M. Wolfson, “Earnouts: The Effects of Adverse Selec-
tion and Agency Costs on Acquisition Techniques,” Journal of Law, Economics, and
Organization 17 (2001): 201–238.
27. FactSet Mergerstat, LLC, Mergerstat Review 2011 (Newark, NJ, 2011): 16.
28. At the same time, Fitch downgraded Pfizer from AA to AA-, Moody’s Aa2 to A1.
29. H. Singh and F. Harianto, “Management–Board Relationships, Takeover Risk, and
the Adoption of Golden Parachutes,” Academy of Management Journa l 32 (1989):
7–24, find that entrenc hed managers create golden parachute contracts to avoid
the disciplinary effect of corporate takeovers. J. Machlin, H. Choe, and J. Miles,
“The Effects of Golden Parachutes on Takeover Activity,” Journal of Law and Eco-
nomics 36 (1993): 861–876, find that golden parachutes increase the likelihood of
an acquisition.
11-20
PART 3 • Business Analysis and Valuation Appl ications
Copyright 2012 Cengage Learning. All Rights Reserved. May not be copied, scanned, or duplicated, in whole or in part. Due to electronic rights, some third party content may be suppressed from the eBook and/or eChapter(s).
Editorial review has deemed that any suppressed content does not materially affect the overall learning experience. Cengage Learning reserves the right to remove additional content at any time if subsequent rights restrictions require it.
30. T. Catan and S. E. Ante, “U.S. Sues to Stop AT&T Deal,” Wall Street Journal,
September 1, 2011, http://online.wsj.com/article/SB1000142405311190471660457654
2373831069388.html, accessed October 2011.
31. Pfizer Inc., March 27, 2009, Form S4, http://www.pfizer.com/investors/sec_filings/
sec_filings.jsp?month=3&day=26&year=2009&month1=3&day1=27&year1=2009&x=
44&y=3, accessed October 2011.
32. A. Johnson, “‘Company X’: Who was Wyeth’s Other Suitor?” post on “Health Blog,”
Wall Street Journal, http://blogs.wsj.com/health/2009/03/27/company-x-who-was-
wyeths-other-suitor/, accessed October 2011.
Mergers and Acquisitions 11-21
Copyright 2012 Cengage Learning. All Rights Reserved. May not be copied, scanned, or duplicated, in whole or in part. Due to electronic rights, some third party content may be suppressed from the eBook and/or eChapter(s).
Editorial review has deemed that any suppressed content does not materially affect the overall learning experience. Cengage Learning reserves the right to remove additional content at any time if subsequent rights restrictions require it.

Chapter
12
COMMUNICATION AND
GOVERNANCE
C
orporate governance has become an increasingly important issue in capital
markets throughout the world during the turbulent first decade of the new
century, with the financial market meltdowns in Asia and the United States
in the early 2000s, the global financial crisis that began in 2008, and the European Debt
crisis of 2010–11. These market collapses exposed problems of accounting misstatements
and lack of corporate transparency, as well as governance problems and conflicts of
interest among the intermediaries charged with monitoring management and corporate
disclosures.
The breakdowns have increased the challenge for managers in communicating
credibly with skeptical outside investors, making it more difficult for new (and in some
cases even established) firms to raise capital. Financial reports, the traditional platform
for management to communicate with investors, have increasingly come to be viewed
with skepticism following a number of widely publicized audit failures; the demise of
Enron, Worldcom, and Arthur Andersen in the United States; and lack of transparency
of financial firms in their exposures to subprime mortgage instruments in the 2008
financial crisis.
The market crashes have also raised questions about improving the quality of
governance by information and financial intermediaries, and have resulted in the
passage of legislation attempting to address such deficits. The Sarbanes-Oxley Act in
the United States (discussed in Chapter 1) attempts to increase accountability and
financial competence for audit committees and external auditors, who are charged with
reviewing the financial reporting and disclosure process, and accountability for the CEO
and CFO, who are required to certify the validity of both financial statements and
internal controls. The Dodd-Frank Act (also discussed in Chapter 1) attempts to
protect investors by increasing the transparency and accountability of credit rating
agencies and to improve the financial security of large financial institutions.
Throughout this book we have focused primarily on showing how financial statement
data can be helpful for analysts and outside investors in making a variety of decisions.
In this chapter we change our emphasis and focus primarily on management
communication and the role of governance agents. Of course an understanding of the
management communication process and corporate governance is also important for
security analysts and investors. The approach taken here, however, is more germane to
insiders since most of the types of analyses we discuss are not available to outsiders.
12-1
Copyright 2012 Cengage Learning. All Rights Reserved. May not be copied, scanned, or duplicated, in whole or in part. Due to electronic rights, some third party content may be suppressed from the eBook and/or eChapter(s).
Editorial review has deemed that any suppressed content does not materially affect the overall learning experience. Cengage Learning reserves the right to remove additional content at any time if subsequent rights restrictions require it.
In the sections that follow we discuss how many of the financial analysis tools
developed in Chapters 2 through 8 can be used by managers to develop a coherent
disclosure strategy, and by corporate board members and external auditors to improve
the quality of their work. The following types of questions are dealt with:
• Managers ask: Is our current communication policy effective in helping investors
understand the firm’s business strategy and expected future performance, thereby
ensuring that our stock price is not seriously over- or undervalued?
• Audit committee members ask: What are the firm’s key business risks? Are they
reflected appropriately in the financial statements? How is management communi-
cating on important risks that cannot be reflected in the financial statements? Is
information on the firm’s performance as presented to the board consistent with
that provided to investors in the financial report and firm disclosures?
• External auditors ask: What are the firm’ s key business risks, and how are they
reflected in the financial statements? Where should we focus our audit tests? Is
our assessment of the firm’s performance consistent with that of external investors
and analysts? If not, are we overlooking something, or is management misrepre-
senting the firm’s true performance in disclosures?
GOVERNANCE OVERVIEW
As we discuss throughout this book, outside investors require access to reliable informa-
tion on firm performance, both to value their debt and equity claims and to monitor the
performance of management. When investors agree to provide capital to the firm,
they require that managers provide information on their company’s performance and
future plans.
However, left to their own devices, managers are likely to paint a rosy picture of the
firm’s performance in their disclosures. There are three reasons for manager optimism in
reporting. First, most managers are genuinely positive about their firms’ prospects, lead-
ing them to unwittingly emphasize the positive and downplay the negative.
Second, management optimism in reporting arises because firm disclosures play an
important role in mitigating “agency” problems between managers and investors.
1
Inves-
tors use firm disclosures to judge whether managers have either run the firm in the
investors’ best interests or abused their authority and control over firm resources.
Reporting consistently poor earnings increases the likelihood that top management will
be replaced, either by the board of directors or by an acquirer who takes over the firm to
improve its management.
2
Of course, managers are aware of this and have incentives to
show positive performance.
Third, managers are also likely to make optimistic disclosures prior to issuing new
equity. Recent evidence indicates that entrepreneurs tend to take their firms public
after disclosure of strong reported, but frequently unsustainable, earnings performance.
Also, seasoned equity offers (additional offers of equity made by an already public firm)
typically follow strong, but again unsustainable, stock and earnings performance. The
strong earnings performance prior to IPOs and seasoned offers appears to be at least
partially due to earnings management.
3
Rational outside investors recognize manage-
ment’s incentives to manage earnings and inflate expectations prior to a new issue.
They respond by discounting the stock, demanding a hefty new issue discount, and
(in extreme cases) refusing to purchase the new stock. This raises the cost of capital
and potentially leaves some of the best new ventures and projects unfunded.
4
As discussed in Chapter 1, financial and information intermediaries help reduce
agency and information problems faced by outside investors. These intermediaries
12-2
PART 3 • Business Analysis and Valuation Applications
Copyright 2012 Cengage Learning. All Rights Reserved. May not be copied, scanned, or duplicated, in whole or in part. Due to electronic rights, some third party content may be suppressed from the eBook and/or eChapter(s).
Editorial review has deemed that any suppressed content does not materially affect the overall learning experience. Cengage Learning reserves the right to remove additional content at any time if subsequent rights restrictions require it.

evaluate the quality of management representation in the firm’s disclosures, provide
their own analysis of firms’ (and managers’) performance, and make investment recommen-
dations and decisions on behalf of investors. As presented in Figure 12-1, these intermediar-
ies include internal governance agents, assurance professionals, information analyzers, and
professional investors. The importance of these intermediaries is underscored by the magni-
tude of the fees that they collectively receive from investors and entrepreneurs.
Internal governance agents, such as corporate boards, audit committees and internal
auditors, are responsible for monitoring a firm’s management. Their functions include
reviewing business strategy, evaluating and rewarding top management, and assuring
the flow of credible information to external parties. Assurance professionals, such as
external auditors, enhance the credibility of financial information prepared by managers.
Information analyzers, such as financial analysts and ratings agencies, are responsible for
gathering and analyzing information to provide performance forecasts and investment
recommendations to both professional and retail individual investors. Finally, profes-
sional investors (such as banks, investment advisors, private equity firms, hedge funds,
mutual funds, insurance companies, and venture capital firms) make investment deci-
sions on behalf of dispersed investors. They are therefore responsible for valuing and
selecting investment opportunities in the economy.
In this framework, management, internal governance agents, and assurance profes-
sionals are charged with supplying information. The demand for information comes
from individual and professional investors and information analyzers. Both the supply
FIGURE 12- 1 The Intermediation Chain Between Managers and Investors
Information
Analyzers
(nancial analysts,
rating agencies)
Assurance
Professionals
(external
auditors)
Professional
Investors
(mutual funds,
banks, VCs)
Internal
Governance
Agents
(board,
audit committee,
internal auditors)
Standard Setters and Capital Market Regulators
(e.g., SEC, PCAOB, FASB, Stock Exchanges)
Retail
Investors
Credible
nancial
statements
Business & nancial
information
Investment
advice
$$
Managers
Information Demand Side
Information Supply Side
Source: © Cengage Learning
Communication and Governan ce 12-3
Copyright 2012 Cengage Learning. All Rights Reserved. May not be copied, scanned, or duplicated, in whole or in part. Due to electronic rights, some third party content may be suppressed from the eBook and/or eChapter(s).
Editorial review has deemed that any suppressed content does not materially affect the overall learning experience. Cengage Learning reserves the right to remove additional content at any time if subsequent rights restrictions require it.
and demand sides are governed by a variety of regulatory institutions. In the United
States, these include public regulators such as the Securities and Exchange Commission
(SEC), the Public Company Accounting Oversight Board (PCAOB), and bank regulators,
as well as private sector bodies such as the Financial Accounting Standards Board
(FASB), the American Institute of Certified Public Accountants (AICPA), and stock
exchanges. Other countries have similar types of institutions.
The level and quality of information and residual information and agency problems in
capital markets are determined by the organizational design of these intermediaries and
regulatory institutions. Key organizational design questions include: What are the
optimal incentive schemes for rewarding top managers? What should be the composition
and charter of corporate boards? Should auditors assure that financial reports comply
with accounting standards or represent a firm ’s underlying economics? Should there
be detailed accounting standards or a few broad accounting principles? What should
be the organizational form and business scope of auditors and analysts? What
incentive schemes should be used for professional investors to align their interests with
individual investors?
A variety of economic and institutional factors are likely to influence the answers
to these design questions. Examples include the ability to write and enforce optimal
contracts, proprietary costs that might make disclosure costly for investors, and regula-
tory imperfections. The spectacular collapses of companies like Enron and Lehman
Brothers, and their impact on equity and credit markets, suggest that these limitations
can have a first-order effect on the functioning of capital markets.
While it is interesting to speculate on how to improve the functioning of capital
markets through changes in organizational design, that issue goes beyond the scope of
this chapter. Instead, we discuss how the financial analysis tools developed in Chapters 2
through 8 can be used to improve the performance of some of the information
intermediaries who were widely criticized following revelations of financial reporting
improprieties at companies such as Enron, WorldCom, Tyco, and Lehman Brothers.
5
We have already discussed the application of financial analysis tools to equity and
credit analysts and to professional investors in Chapters 9 through 11. In the remainder
of this chapter, we discuss how these tools can be used by managers to develop a strategy
for effective communication with investors, by members of boards of directors and audit
committees in overseeing management and the audit process, and by audit professionals.
MANAGEMENT CO MMUNICATION WITH INVESTORS
Some managers argue that communication problems are not worth worrying about.
They maintain that as long as managers make investment and operating decisions
that enhance shareholder value, investors will value their performance and the firm’s
stock accordingly. While this is true in the long run, since all information is eventually
public, it may not hold in the short or even medium term. If investors do not have
access to the same information as management, they will probably find it difficult to
value new and innovative investments, or to assess intelligently the degree of risk inher-
ent in a company’s operations or positions. In an efficient capital market, they will not
consistently over- or undervalue these new investments or risks, but their valuations can
be noisy. This can make stock prices and a company’s overall cost of capital relatively
noisy, leading management at various times to consider their firms to be either seriously
over- or undervalued.
Does it matter if a firm is over- or undervalued for a period? Most managers would
prefer to not have their stock undervalued or lenders over-estimate their firms’ risk, since
it makes it more costly to raise new financing. They may also worry that undervaluation
12-4
PART 3 • Business Analysis and Valuation Applications
Copyright 2012 Cengage Learning. All Rights Reserved. May not be copied, scanned, or duplicated, in whole or in part. Due to electronic rights, some third party content may be suppressed from the eBook and/or eChapter(s).
Editorial review has deemed that any suppressed content does not materially affect the overall learning experience. Cengage Learning reserves the right to remove additional content at any time if subsequent rights restrictions require it.

is likely to increase the chance of a takeover by a hostile acquirer, with an accompanying
reduction in their job security. Also, the financial crisis of 2008 demonstrated the impor-
tance of investor confidence for the effective operation of financial markets and the risk
of financial distress for firms that lose that confidence. Managers of firms that are over-
valued may also be concerned about the market’s assessment, since they are legally liable
for failing to disclose information relevant to investors.
6
Therefore, they may not wish to
see their stock seriously overvalued, even though overvaluation provides opportunities to
issue new equity at favorable rates.
A Word of Caution
As noted above, it is natural that many managers believe that firms are undervalued by
the capital market. This frequently occurs because it is difficult for managers to be objec-
tive about their company’s future performance. After all, it is part of their job to sell the
company to new employees, customers, suppliers, and investors. In addition, forecasting
the firm’s future performance objectively requires them to judge their own capabilities as
managers. Thus, it is not surprising that many managers argue that investors are unin-
formed and that their firm is undervalued. Only some managers can back that up with
solid evidence.
If management decides that the firm does face a genuine information problem, it can
begin to consider whether and how this could be redressed. Is the problem potentially
serious enough that it is worth doing something to alter investors’ perceptions? Or is
the problem likely to resolve itself within a short period? Does the firm have plans to
raise new equity or to use equity to acquire another company? Is management’s job
security or the company’s viability threatened? As we discuss below, management has a
wide range of options in this situation.
Key Analysis Questions
We recommend that before jumping to the conclusion that their firms are under-
valued, managers should analyze their firms’ performance and compare their own
forecasts of future performance with those of analysts, using the following
approach:
• Is there a significant difference between internal management forecasts of
future earnings and cash flows and those of outside analysts?
• Do any differences between managers’ and analysts’ forecasts arise because of
different expectations about economy-wide performance? Managers may under-
stand their own businesses better than analysts, but they may not be any bet-
ter at forecasting macroeconomic conditions.
• Can managers identify any factors that might explain a difference between ana-
lysts’ and managers’ forecasts of future performance? For example, are analysts
unaware of positive new R&D results, do they have different information
about customer responses to new products and marketing campaigns, etc.?
These types of differences could indicate that the firm faces an information
problem.
Example: Communication Issues for Jefferies Group, Inc.
In 2011, Jefferies Group, Inc. was a mid-sized global securities and investment banking
firm that had been in business for almost 50 years. The firm’s strong balance sheet had
enabled it to successfully weather the 2008 financial crisis without government support,
Communication and Governan ce 12-5
Copyright 2012 Cengage Learning. All Rights Reserved. May not be copied, scanned, or duplicated, in whole or in part. Due to electronic rights, some third party content may be suppressed from the eBook and/or eChapter(s).
Editorial review has deemed that any suppressed content does not materially affect the overall learning experience. Cengage Learning reserves the right to remove additional content at any time if subsequent rights restrictions require it.
and provided it with the financial flexibility to expand its global operations aggressively
following the crisis. At its fiscal 2010 year end on November 30, 2010, Jefferies had a
book value per share of $16.37, a price-to-book value of 1.7, a price to earnings multiple
of 20.3, and an equity beta of 1.7.
However, during 2011, the Jefferies stock price declined precipitously from $26.63
to a low of $11.60 in early October, recovering somewhat to $14.72 as of October 28.
This drop was attributed to concerns about the firm ’s exposure to the growing Euro-
pean debt crisis , a concern that was magnified by the firm’s aggressive expansion
in Eu rope since 2008. On October 31, the stock’s recovery was abruptly halted
when MF Global, a commodities broker-dealer that dealt with Jefferies, filed for
bankruptcy protection, citing l osses resulting from European sovereign debt exposure.
Over the next few days Jefferies stock fell almost 20 percent as investors tried
to assess potential indirect and direct exposure to MF Global and the sover eign
debt crisis.
The firm’s management issued a press release on October 31 explaining that it had
only minimal exposure to MF Global and to European sovereign debt. But this failed to
stem the market’s concerns. As one blogger at the Wall Street Journal explained, “Yes,
Jefferies says it has no ‘meaningful exposure’ to the government debt of the PIIGS. Trou-
ble is, since the financial crisis, investors shoot first and ask questions later.”
On November 3, ratings agency Egan-Jones downgraded Jefferies debt, citing concern
over the company’s potential exposure to European sovereign debt. Jefferies was quick to
respond, issuing two increasingly detailed press releases on the same day disclosing its
limited exposure. The stock remained stable for the next few days, but then continued
its downward trajectory, trading as low as $9.50 on November 17.
The sharp decline in its price raises questions about the valuation of Jefferies stock.
At the November 17, 2011, close, the price-to-book ratio was well below 1, and the
price-to-earnings multiple was 6.9. The market, therefore, expected that the company
would generate a return on equity somewhat lower than its cost of capital—a dramatic
turnaround from the market’s perception at the beginning of 2011. Jefferies management
expressed surprise and frustration at the sharp drop in price and argued that the market
was unjustly punishing the firm for exposure that it did not have. However, before
reaching this conclusion, a number of questions need to be answered:
• Was the firm previously overvalued? If so, what forces were behind the market’s
high valuation of the company? Had management been painting too rosy a picture
for the company’s future in its meetings with analysts?
• What were the financial implications of the events that precipitated the company’ s
drop in stock value? As noted above, the primary question for analysts was the
extent of the firm’s exposure—either directly or indirectly, to the European debt
crisis. Management needed to make sure it had a deep understanding of both the
macro- and micro-economic aspects of the issue to assess the implications for the
company’s future performance.
• If management believed that the firm was actually being undervalued, what options
were available to correct the market’s view of the company?
COMMUNICATION THROUGH FINANCIAL REPORTING
Financial reports are the most popular format for management communication. Below
we discuss the role of financial reporting as a means of investor communication, the
institutions that make accounting information credible, and the situations in which the
reporting is likely to be ineffective.
12-6
PART 3 • Business Analysis and Valuation Applications
Copyright 2012 Cengage Learning. All Rights Reserved. May not be copied, scanned, or duplicated, in whole or in part. Due to electronic rights, some third party content may be suppressed from the eBook and/or eChapter(s).
Editorial review has deemed that any suppressed content does not materially affect the overall learning experience. Cengage Learning reserves the right to remove additional content at any time if subsequent rights restrictions require it.
Accounting as a Means of Management Communication
As we discussed in Chapters 3 and 4, financial reports are an important medium for
management communication with external investors. Reports provide investors with an
explanation of how their money has been invested, a summary of the performance of
those investments, and a discussion of how current performance fits within the firm’s
overall philosophy and strategy.
Accounting reports not only provide a record of past transactions but also reflect
management estimates and forecasts of the future. For example, they include estimates
of bad debts, forecasts of the lives of tangible assets, and implicit forecasts that outlays
will generate future cash flow benefits that exceed their cost. Since management is likely
to be in a position to make forecasts of these future events that are more accurate than
those of external investors, financial reports are a potentially useful way of communicat-
ing with investors. However, as discussed, investors are also likely to be skeptical of
reports prepared by management. The Sarbanes-Oxley Act requires the CEO and CFO
to certify that the financials fairly represent the financial performance of the company
and that internal controls are adequate to support those financial statements. This
requirement increases the accountability of senior management and mitigates some of
the investors’ skepticism.
Factors That Increase the Credibility of Accounting C ommunication
A number of mechanisms mitigate conflicts of interest in financial reporting and
increase the credibility of accounting information that is communicated to investors.
These include accounting standards, auditing, monitoring of management by financial
analysts and ratings agencies, and management reputation.
Accounting Standards and Auditing
Accounting standards, such as those promulgated by the FASB and the SEC in the
United States and the IASB and country-specific standard setters and regulators globally,
provide guidelines for managers on how to make accounting decisions and furnish out-
side investors with a way of interpreting these decisions. Uniform accounting standards
attempt to reduce managers’ ability to record similar economic transactions in different
ways, either over time or across firms. Compliance with these standards is enforced by
external auditors who attempt to ensure that managers ’ estimates are reasonable. Audi-
tors, therefore, reduce the likelihood of earnings management.
Monitoring by Financial Analysts and Ratings Agencies
Information intermediaries such as financial analysts and ratings agencies also limit manage-
ment’s ability to manage earnings and understate risk. Financial analysts and ratings agen-
cies specialize in developing firm- and industry-specific knowledge, enabling them to assess
the quality of a firm’s reported numbers and to make any necessary adjustments. These
information analyzers evaluate the appropriateness of management’s forecasts implicit in
accounting method choices and reported accruals. This requires a thorough understanding
of the firm’s business and the relevant accounting rules used in the preparation of its finan-
cial reports. Superior analysts adjust reported accrual numbers, if necessary, to reflect
economic reality, perhaps by using the cash flow statement and the footnote disclosures.
Analysts’ business and technical expertise as well as their legal liability and incentives differ
from those of auditors. Consequently, analyst reports can provide information to investors on
whether the firm’s accounting decisions are appropriate or whether managers are overstating
the firm’s economic performance (or understating its risk) to protect their jobs.
7
Communication and Governan ce 12-7
Copyright 2012 Cengage Learning. All Rights Reserved. May not be copied, scanned, or duplicated, in whole or in part. Due to electronic rights, some third party content may be suppressed from the eBook and/or eChapter(s).
Editorial review has deemed that any suppressed content does not materially affect the overall learning experience. Cengage Learning reserves the right to remove additional content at any time if subsequent rights restrictions require it.
Management Reputation
A third factor that can counteract external investors’ natural skepticism about financial
reporting is management reputation. Managers that expect to have an ongoing relation
with external investors and financial intermediaries may be able to build a track record
for unbiased financial reporting. By making accounting estimates and judgments that are
supported by subsequent performance, managers can demonstrate their competence and
reliability to investors and analysts. As a result, managers’ future judgments and account-
ing estimates are more likely to be viewed as credible.
Limitations of Financial Reporting for Investor Communication
While accounting standards, auditing, monitoring of management by financial analysts,
and management concerns about its reputation increase the credibility and informative-
ness of financial reports, these mechanisms are far from perfect. Consequently, there are
times when financial reporting breaks down as a means for management to communi-
cate with external investors. These breakdowns can arise when (1) there are no account-
ing rules to guide practice or the existing rules do not distinguish between poor and
successful performers, (2) auditors and analysts do not have the expertise to judge new
products or business opportunities, or (3) management faces credibility problems.
Accounting Rule Limitations
Despite the rapid increase in new accounting standards, accounting rules frequently do
not distinguish between good and poor performers. For example, current accounting
rules do not permit managers to show on their balance sheets in a timely fashion the
benefits of investments in quality improvements, human resource development pro-
grams, research and development (with the exception of software development costs),
and customer service.
Some of the problems with accounting standards arise because it takes time for stan-
dard setters to develop appropriate standards for many new types of economic transac-
tions. Other difficulties arise because standards are the result of compromises between
different interest groups (e.g., auditors, investors, corporate managers, and regulators).
Auditor, Analyst, and ot her Intermediary Limitations
While auditors and analysts may have a good understanding of a firm’s business, they do
not have the same depth of information as managers. The discrepancy between man-
agers’ and auditors’or analysts’ business assessments is likely to be most severe for firms
with distinctive business strategies, or firms that operate in emerging industries or in
industries with constantly evolving, very complex products (such as financial services).
In addition, auditors’ decisions in these circumstances are likely to be dominated by con-
cerns about legal liability, hampering management’s ability to use financial reports to
communicate effectively with investors.
Finally, conflicts of interest faced by auditors, analysts, and other intermediaries make
their analysis imperfect. Conflicts can potentially induce auditors to side with manage-
ment to retain the firm as an audit client. They can also arise for analysts who provide
favorable ratings and research on companies to increase their firm’s investment banking
business and trading volume among less-informed investors, and for credit ratings agen-
cies who earn their revenue from the firms they are rating. Regulations that increase
oversight of audit firms by the Public Company Accounting Oversight Board and limit
the impact of investment banking on financial analysts’ incentives, were put in place as
part of Sarbanes-Oxley and the Global Settlement to reduce auditor and analyst conflicts
12-8
PART 3 • Business Analysis and Valuation Applications
Copyright 2012 Cengage Learning. All Rights Reserved. May not be copied, scanned, or duplicated, in whole or in part. Due to electronic rights, some third party content may be suppressed from the eBook and/or eChapter(s).
Editorial review has deemed that any suppressed content does not materially affect the overall learning experience. Cengage Learning reserves the right to remove additional content at any time if subsequent rights restrictions require it.

of interest, while the Dodd-Frank Act sought, among other things, to increase the trans-
parency and accountability of ratings agencies.
Mana gement Credibility Pro blems
There is limited evidence on when management is likely to face credibility problems with
investors. However, managers of new firms, firms with volatile earnings, firms in finan-
cial distress, and firms with poor track records in communicating with investors should
expect to find it difficult to be seen as credible reporters.
If management has a credibility problem, financial reports are likely to be viewed with
considerable skepticism. Investors will view financial reporting estimates that increase
income as evidence that management is padding earnings. This makes it very difficult
for management to use financial reports to communicate positive news about current
or future performance.
Example: Acc ounting Communication for Jefferies
Jefferies exposure to European sovereign debt is reported in the company’s August 31,
2011, balance sheet. The asset, “Government, Federal Agency, and Other Sovereign
Obligations,” which amounts to $5.5 billion, aggregates European sovereign debt with U.S.
and other debt. Footnote disclosure reveals that “Sovereign obligations” were $2.7 billion
and were offset by a $2.5 billion liability “Financial instruments sold, not yet purchased,”
suggesting that the firm was effectively hedged in the event of European sovereign debt
defaults. In addition, management explained that increases in sovereign debt inventory
during 2010 and 2011 arose from the firm being designated as a Primary Dealer in several
European jurisdictions. These exposures “are substantially comprised of the most liquid
securities in the asset class with a significant portion in holdings of securities of G-7 coun-
tries. Our market risk exposure to Portugal, Italy, Ireland, Greece, and Spain was modest at
August 31, 2011.” However, management may have raised questions about the firm’s expo-
sure when in another part of the same report it warned that: “Europe’s debt crisis could
have a material adverse effect on our business, financial condition, and liquidity.”
Although the third quarter financial statements were unaudited, there is reason to
expect that Jefferies management would have some credibility with analysts. The com-
pany’s CEO, Richard Handler, who had led the company since 2000, had successfully
helped navigate the firm through the 2008 financial crisis, and had a reputation among
analysts for a deep understanding of the firm’s businesses, and for eschewing the opulent
banking lifestyle common among leading investment banks.
Yet the ratings agency, Egan-Jones, raised questions about the credibility of the firm’s
hedge and financial reporting. In explaining the debt downgrade, Egan-Jones principal
Shaun Egan commented: “They claim it’s beautifully hedged. Our view is that we’re
skeptical until we see complete proof of that. In the past, the hedges haven’t been as per-
fect as originally presented. We don’t know how those shorts are set up and whether
they completely offset their $2.7 billion [exposure].”
Key Analysis Questions
For management interested in understanding how effectively the firm’s financial
reports help it communicate with outside investors, the following questions are
likely to provide a useful starting point:
• What are the primary business risks that have to be managed effectively? What
processes and controls are in place to manage the business risks? How are these
Communication and Governan ce 12-9
Copyright 2012 Cengage Learning. All Rights Reserved. May not be copied, scanned, or duplicated, in whole or in part. Due to electronic rights, some third party content may be suppressed from the eBook and/or eChapter(s).
Editorial review has deemed that any suppressed content does not materially affect the overall learning experience. Cengage Learning reserves the right to remove additional content at any time if subsequent rights restrictions require it.

risks reflected in the financial statements? For example, credit risks are
reflected in the bad debt allowance, and product quality risks are reflected in
allowances for product returns and the method of revenue recognition. For
these types of risks, what message is the firm sending on the management of
these risks through its estimates or choices of accounting methods? Has the
firm been unable to deliver on the forecasts underlying these choices? Alter-
natively, does the market seem to be ignoring the message underlying the
firm’s financial reporting choices, indicating a lack of credibility?
• How does the firm communicate about important risks that cannot be reflected
in accounting estimates or methods? For example, a company such as Jefferies
has direct and indirect exposure to major external market shocks such as
the European debt crisis which is difficult to fully reflect in its financial
statements; hence, investors and information intermediaries may still have
questions about this business issue.
COMMUNICATION THROUGH FINANCIAL POLICIES
Managers can also use financing policies to communicate effectively with external inves-
tors. One important difference between this type of communication and additional dis-
closure is that the firm does not provide potentially proprietary information to
competitors. Financial policies that are useful in this respect include dividend payouts,
stock repurchases, financing choices, and hedging strategies.
Dividend Payout Policies
A firm’s dividend payout decisions can provide information to investors on managers’
assessments of the firm’s future prospects. Dividend payout, defined as cash dividends
as a percentage of income available to common shareholders, reflects the extent to
which a company pays out profits or retains them for reinvestment. Because paying divi-
dends reduces financial slack and is thus costly, a firm’s dividend policy can help man-
agement communicate effectively with external investors. Investors recognize that
managers will only increase their firm’s dividend rate if they anticipate that the payout
will not have a serious effect on the firm’s future financing options. Thus, the decision
to increase dividends can help investors appreciate management’s optimism about the
firm’s future performance and ability to finance growth. This arises because dividend
payouts tend to be sticky, as managers are reluctant to cut dividend payouts. Managers
will only increase dividends when they are confident that they will be able to sustain the
increased payout rate in future years. Consequently, investors interpret dividend increases
as signals of managers’ confidence in the quality of current and future earnings.
8
As a result, managers in high-growth firms tend to set low dividend payout policies
and retain their internally generated funds for reinvestment to minimize any costs from
capital market constraints on financing growth options. On the other hand, firms with
high and stable operating cash flows and few investment opportunities have high divi-
dend payouts to reduce managers’ incentives to reinvest free cash flows in unprofitable
ventures.
Stock Repurchases
In some countries, such as the United States and the United Kingdom, managers can use
stock repurchases to communicate with external investors. Under a stock repurchase, the
12-10
PART 3 • Business Analysis and Valuation Appl ications
Copyright 2012 Cengage Learning. All Rights Reserved. May not be copied, scanned, or duplicated, in whole or in part. Due to electronic rights, some third party content may be suppressed from the eBook and/or eChapter(s).
Editorial review has deemed that any suppressed content does not materially affect the overall learning experience. Cengage Learning reserves the right to remove additional content at any time if subsequent rights restrictions require it.
firm buys back its own stock, either through a purchase on the open market, through a
tender offer, or through a negotiated purchase with a large stockholder. Of course a stock
repurchase, particularly a tender offer repurchase, is an expensive way for management
to communicate with outside investors that they believe the firm is undervalued. Firms
typically pay a hefty premium to acquire their shares in tender offer repurchases, poten-
tially diluting the value of the shares that are not tendered or not accepted for tender. In
addition, the fees to investment banks and lawyers, and for share solicitation, are not
trivial. Given these costs, it is not surprising that research findings indicate that stock
repurchases are effective signals to investors about the level and risk of future earnings
performance.
9
Research findings also suggest that firms that use stock repurchases to
communicate with investors have accounting assets that are less reflective of firm value
and have high general information asymmetry.
10
Financing Choices
Firms that have problems communicating with external investors may be able to use
financing choices to reduce them. For example, a firm that is unwilling to provide pro-
prietary information to help dispersed public investors value it appropri ately may be
willing to provide such infor mation to a know ledgea ble private invest or, which can
become a large stockh older/credi tor, or to a bank that ag rees to provide the compan y
with a significant new loan. A firm with credibility problems in financial repor ting
can also sell stock or issue debt to an informe d private investor such as a large cus-
tomer who has superior information about the qualit y of its product or service. For
example, Warren Buffett ’s i nvestment of $5 billion in Bank of America in August of
2011 was widely view ed as enhanci ng the bank’s credibility. Investors responded
accordingly, increasin g the stock by 20 percent in the three trading days following the
announcement.
Such changes in financing and ownership can mitigate communication problems in
two ways. First, the terms of the new financing arrangement and the credibility of the
new lender or stockholder can provide investors with information to reassess the value
of the firm. Second, the accompanying increased concentration of ownership and the
role of large block holders in corporate governance can have a positive effect on valua-
tion. If investors are concerned about management’s incentives to increase shareholder
value, the presence of a new block shareholder or significant creditor on the board can
be reassuring. This type of monitoring arises in leveraged buyouts, startups backed by
venture capital firms, and firms with equity partnership investments. In Japanese and
German corporations, it may also arise because large banks own both debt and equity
and have close working relationships with firms’ managers.
Of course, in the extreme, management can decide that the best option for a firm is to
no longer operate as a public company. This can be accomplished by a management
buyout, where a buyout group (including management) leverages its own investment
(using bank or public debt finance), buys the firm, and takes it private. The buyout
group hopes to run the firm for several years and then take the company public again,
hopefully with a track record of improved performance that enables investors to value
the firm more effectively.
Hedging
An important source of mispricing arises if investors are unable to distinguish between
unexpected changes in reported earnings due to management performance and transi-
tory shocks that are beyond managers’ control (e.g., foreign currency translation gains
Communication and Governance 12-11
Copyright 2012 Cengage Learning. All Rights Reserved. May not be copied, scanned, or duplicated, in whole or in part. Due to electronic rights, some third party content may be suppressed from the eBook and/or eChapter(s).
Editorial review has deemed that any suppressed content does not materially affect the overall learning experience. Cengage Learning reserves the right to remove additional content at any time if subsequent rights restrictions require it.

and losses). Managers can counteract these effects by hedging such “accounting” risks.
Even though hedging may be costly, it is valuable if it reduces information problems
that potentially lead to misvaluation.
Example: Financial Policies at Jefferies
Jefferies took several financial policy actions in 2011 in efforts to communicate its finan-
cial strength to the market. On September 20, 2011, the firm announced that its Board of
Directors had approved a share repurchase program authorizing the repurchase of up to
20 million shares—or a little over 10 percent—of its common stock, and followed
through with purchases of about 5 million shares of stock under the program in the fol-
lowing two months. In November the firm reported that it had also repurchased
$50 million of its 2012 bonds on the open market. On November 3 –4—coinciding with
the company’s debt downgrade by Egan-Jones—the company’s largest shareholder,
Leucadia National (which held more than 25 percent of the company stock at the time),
bought an additional 1.5 million shares of common stock. Finally, company insiders
purchased significant shares in 2011, signaling to investors their faith in the company.
Board members Ian Cumming and Joseph Steinberg, co-founders of Leucadia National,
purchased a total of 1.5 million shares on November 3 and 4. On November 15, the
Chairman and CEO Richard Handler (who owned more than 6 percent of company
shares), purchased more than 80,000 of the bank’s shares. Overall in 2011, insider buys
outweighed sales by a ratio of 57 to 3.
These combined actions, however, did not arrest the stock’s slide, as worries about the
firm’s exposure to the European debt crisis continued to build. On the day before the
share buyback announcement (which was announced in conjunction with the company
reporting a 53 percent increase in third quarter profits over the previous year), the shares
closed at $14.12. By November 1, the day after the MF Global bankruptcy was announced,
the shares had fallen to $12.01. The slide continued through the month of November,
reaching a low of $10.20 on November 21, a drop of over 60 percent year to date.
Key Analysis Questions
For management considering whether to use financing policies to communicate
more effectively with investors, the following questions are likely to provide a useful
starting point for analysis:
• Have other, potentially less costly actions, such as expanded disclosure or
accounting communication, been considered? If not, would these alternatives
provide a lower-cost means of communication? Alternatively, if management
is concerned about providing proprietary information to competitors, or has
low credibility, these options may not be effective.
• Does the firm have sufficient free cash flow to be able to implement a share
repurchase program or to increase dividends? If the firm has excess cash avail-
able today but expects to be constrained in the future, a stock repurchase may
be more effective. Alternatively, if management expects to have some excess
cash available each year, a dividend increase may be in order.
• Is the firm cash constrained and unable to increase disclosure for proprietary
reasons? If so, management may want to consider changing the mix of owners
as a way of indicating to investors that another informed outsider is bullish on
the company. Of course, another possibility is for management itself to
increase its stake in the company.
12-12
PART 3 • Business Analysis and Valuation Appl ications
Copyright 2012 Cengage Learning. All Rights Reserved. May not be copied, scanned, or duplicated, in whole or in part. Due to electronic rights, some third party content may be suppressed from the eBook and/or eChapter(s).
Editorial review has deemed that any suppressed content does not materially affect the overall learning experience. Cengage Learning reserves the right to remove additional content at any time if subsequent rights restrictions require it.
ALTERNATE FORMS OF IN VESTOR COMMUNI CATION
Given the limitations of accounting standards, auditing, and monitoring by financial
analysts, as well as the reporting credibility problems faced by management, firms that
wish to communicate effectively with external investors are often forced to use alterna-
tive methods. We discuss two additional ways that managers can communicate with
external investors and analysts below.
Analyst Meetings
One popular way for managers to help mitigate communication problems is to meet reg-
ularly with financial analysts that follow the firm. At these meetings, management will
field questions about the firm’s current financial performance and discuss its future busi-
ness plans. In addition to holding analyst meetings, many firms appoint a director of
public relations, who provides further regular contact with analysts seeking more infor-
mation on the firm.
In the last twenty years, conference calls have become a popular forum for manage-
ment to communicate with financial analysts. Research finds that firms are more likely
to host calls if they are in industries where financial statement data fail to capture key
business fundamentals on a timely basis.
11
In addition, conference calls themselves
appear to provide new information to analysts about a firm’s performance and future
prospects.
12
Smaller and less heavily traded firms in particular benefit from initiating
investor conference calls.
13
In the 1990s, firms typically had closed conference calls with key analysts and institu-
tional investors. However, under Regulation Fair Disclosure (or Reg FD), implemented
in October 2000, the SEC encouraged firms to open these meetings to the public. Reg
FD required firms that provided material nonpublic information to security analysts or
professional investors to simultaneously (or promptly thereafter) disclose the informa-
tion to the public. While Reg FD has reduced the information that managers disclose
in private meetings, research also shows that the regulation has enhanced the conference
call’s ability to improve analyst forecast accuracy and consensus by eliminating selective
disclosure.
14
Voluntary Disclos ure
Another way for managers to improve the credibility of their financial reporting is
through voluntary disclosure. Accounting rules usually prescribe minimum disclosure
requirements, but they do not restrict managers from voluntarily providing additional
information. These could include an articulation of the company’s long-term strategy,
specification of nonfinancial leading indicators that are useful in judging the effectiveness
of the strategy implementation, explanation of the relation between the leading indica-
tors and future profits, forecasts of future performance, additional financial or nonfinan-
cial information to rebut an incorrect view in the market, or information on corporate
sustainability initiatives designed to create long-term, sustainable value, but which is
not necessarily reflected in the current stock price. Voluntary disclosures can be reported
in the firm’s annual report, in brochures created to describe the firm to investors, in
management meetings with analysts, or in investor relations’ responses to information
requests.
15
One constraint on expanded disclosure is the competitive dynamics in product
markets. Disclosure of proprietary information on strategies and their expected economic
consequences may hurt the firm’s competitive position. Managers then face a trade-off
between providing information that is useful to investors in assessing the firm ’s
Communication and Governance 12-13
Copyright 2012 Cengage Learning. All Rights Reserved. May not be copied, scanned, or duplicated, in whole or in part. Due to electronic rights, some third party content may be suppressed from the eBook and/or eChapter(s).
Editorial review has deemed that any suppressed content does not materially affect the overall learning experience. Cengage Learning reserves the right to remove additional content at any time if subsequent rights restrictions require it.
economic performance and withholding information to maximize the firm’s product
market advantage.
A second constraint in providing voluntary disclosure is management’s legal liability.
Forecasts and voluntary disclosures can potentially be used by dissatisfied shareholders
to bring civil action against management for providing misleading information. This
seems ironic, since voluntary disclosures should provide investors with additional infor-
mation. Unfortunately, it can be difficult for courts to decide whether managers’ disclo-
sures were good faith estimates of uncertain future events that later did not materialize,
or whether management manipulated the market. Consequently many corporate legal
departments recommend against management providing much voluntary disclosure.
One aspect of voluntary disclosure, earnings guidance, has been particularly controver-
sial. There is growing evidence that the guidance provided by management plays an
important role in leading analysts’ expectations toward achievable earnings targets, and
that management guidance is more likely when analysts’ initial forecasts are overly
optimistic.
16
Finally, management credibility can limit a firm’s incentives to provide voluntary
disclosures. If management faces a credibility problem in financial reporting, any volun-
tary disclosure it provides is also likely to be viewed skeptically. In particular, investors
may be concerned about what management is not telling them, particularly since such
disclosures are not audited.
Example: Other Forms of Communica tion at Jeffe ries
Beginning on the day of the MF Global bankruptcy, and continuing with its debt rating
downgrade, the decline in its share price, and ongoing questions about the firm’s viabil-
ity, the board and management of Jefferies provided extensive voluntary disclosures in an
effort to regain investor confidence.
On October 31, 2011, within hours of the MF Global bankruptcy news breaking,
Jefferies sought to quell rumors that it had significant exposure to MF Global, issuing a
press release that “its exposure to MF Global Holdings Ltd. Debt securities … is less than
$9 million in marked-to-market positions.” The next day, the firm issued another press
release, this time to dispel rumors about its exposure to European debt. The release
reaffirmed statements in its SEC filings that it “currently has no meaningful exposure
to the sovereign debt of the nations of Portugal, Italy, Ireland, Greece, and Spain” and
sought to reassure investors that it had no “repo-to-maturity or related off-
balance-sheet derivative activity” that could generate losses, such as those incurred by
several leading financial institutions during the 2008 financial crisis.
In response to the November 3 ratings downgrade, which cited concerns over its
potential exposure to European sovereign debt, Jefferies management issued a series of
additional press releases providing material new information intended to disprove the
assumptions behind the downgrade. The first such report disclosed the firm’s net expo-
sure to European sovereign debt by country. It was followed by a second release later the
same day, informing investors that it held, “no credit-default swaps hedging its sovereign
debt positions.” These actions appeared to slow the stock price drop—the shares closed
down only about 2 percent for the trading day after being down as much as 20 percent
earlier in the session. One day later, in response to further inquiries, the company dis-
closed details of all short and long positions by country. In explaining the firm’s actions,
Chairman and CEO Richard Handler noted that “these are fragile times in the financial
market and we decided the only way to conclusively dispel rumors, misinformation and
misplaced concerns is with unprecedented transparency about internal information that
is rarely, if ever, publicly disclosed.”
12-14
PART 3 • Business Analysis and Valuation Appl ications
Copyright 2012 Cengage Learning. All Rights Reserved. May not be copied, scanned, or duplicated, in whole or in part. Due to electronic rights, some third party content may be suppressed from the eBook and/or eChapter(s).
Editorial review has deemed that any suppressed content does not materially affect the overall learning experience. Cengage Learning reserves the right to remove additional content at any time if subsequent rights restrictions require it.
The firm’s efforts to reassure the markets continued on November 7 with a press release
announcing that it had reduced its gross holding of European sovereign debt by 50 percent,
with “no meaningful profit or loss on today’s trading activity or our remaining positions.”
This news prompted the head of one research firm to observe that the company “has
certainly sent a message to the market that they are aggressively attending to this criticism,
whether it’s founded or not.”
These efforts were of limited help in restoring confidence in the company. The stock
continued to fall, closing at $10.20 on November 21, 2011. On that day, Handler took
the offensive, posting a six-page letter on the Jefferies website to rebut what he saw as
continued false impressions about the company. Handler argued that:
Throughout the month of November, Jefferies has been barraged by a group of people
maliciously spreading rumors, half-truths and outright lies through every means possi-
ble, including calling analysts and security holders, as well as using the mass media in
an effort to amplify and legitimize their efforts. Last week, a representative of a hedge
fund, who we understand has been spreading false rumors about Jefferies, sent us a
letter with a series of questions that for the most part show what we must presume is
an intentional misreading of our public filings to try to support these rumors. All these
folks seem to be trying to take advantage of the MF Global bankruptcy and the volatile
market environment with a view to harming Jefferies and all of us, presumably for
personal gain. With the facts and truth on our side, we have responded to all this
directly and completely. Fortunately, those who take the time to understand and truly
analyze the facts are reaching the right conclusion. While it may be necessary for us to
continue to respond to these ill-conceived attacks, we fortunately can do so on a firm
foundation and with confidence in our funding and business model.
Handler pointed out that the firm’s net exposure was an insignificant $134 million, or
3.8 percent of equity.
Handler’s strong response and the coverage it received proved to be a turning point
for the stock, which rose from $10.20 on the date of the letter to more than $13.00 in
early December. In late December, Jefferies announced strong fourth quarter earnings,
providing further support for management’s position, and the stock jumped 23 percent
to close at $14.50 on December 20.
The Role of the Auditor
In the United States the auditor is responsible for providing investors with assurance that
the financial statements are prepared in accordance with U.S. Generally Accepted
Accounting Principles, or U.S. GAAP, and that the company maintains effective internal
control over its financial reporting. This requires the auditor to evaluate whether trans-
actions are recorded in a way that is consistent with the rules produced by regulators
(including the FASB, PCAOB, and SEC), whether management estimates reflected in
the financial statements are reasonable, and whether the company maintained effective
internal financial control systems. The results of the audit are disclosed in the audit
report, which is part of the financial statements. The auditor issues an unqualified report
if (a) the firm’s financial statements conform to U.S. GAAP, (b) the accounting methods
are applied consistently throughout the prior three years, (c) the internal financial
reporting controls are adequate as of the end of the audit period, and (d) there is no
substantial doubt about the firm’s ability to survive. If the financials do not conform to
U.S. GAAP, the auditor is required to issue a qualified or an adverse report that provides
information to investors on the discrepancies. If the auditor is uncertain about whether
the firm can survive during the coming year, a going concern report that discusses the
firm’s survival risks is issued.
Communication and Governance 12-15
Copyright 2012 Cengage Learning. All Rights Reserved. May not be copied, scanned, or duplicated, in whole or in part. Due to electronic rights, some third party content may be suppressed from the eBook and/or eChapter(s).
Editorial review has deemed that any suppressed content does not materially affect the overall learning experience. Cengage Learning reserves the right to remove additional content at any time if subsequent rights restrictions require it.
In contrast, in the United Kingdom and countries that have adopted the U.K. system,
such as Australia, New Zealand, Singapore, Hong Kong, and India, auditors undertake
a broader review than their U.S. counterparts. Their audits are required to not only
assess whether the financial statements are prepared in accordance with accounting
standards, but also to judge whether they present a “true and fair view” of the client’s
underlying economic performance. This additional assurance requires more judgment
on the part of the auditor and increases the value of the audit to outside investors.
The essential procedures involved in a typical audit include (1) understanding the
client’s business and industry to identify key risks for the audit, (2) evaluating the firm’s
internal control system to assess whether it is likely to produce reliable information,
(3) performing preliminary analytic procedures to identify unusual events and possible
errors, and (4) collecting specific evidence on controls, transactions, and account balance
details to form the basis for the auditor’s opinion. In most cases client management is will-
ing to respond to issues raised by the audit to ensure that the company receives an unqual-
ified audit opinion. Once the audit is completed, the auditor presents a summary of audit
scope and findings to the Audit Committee of the firm’s board of directors.
It is worth noting that in both the U.S. and U.K. systems (and for that matter else-
where), the audit is not intended to detect fraud. Of course in some cases it may do so,
but that is not its purpose. The detection of fraud is the domain of the internal audit
department of the firm itself.
Role of Financial Analysis Tools in Audi ting
How can the financial analysis tools discussed in this book be used by audit profes-
sionals? The relevance to the audit of the four steps in financial analysis —strategy
analysis, accounting analysis, financial analysis, and prospective analysis—is discussed
briefly next.
Strategy Analysis Strategy analysis is critical to the first stage of the audit, understand-
ing the client’s business and industry. It is important that the auditor develop the exper-
tise to be able to identify the chief risks facing its client. Given the sheer volume of
activity, it is impossible to review all the transactions of the firm during the audit. Time
and attention should be focused on the areas that investors need in order to evaluate the
firm’s value proposition and how well it is managing key success factors. These are also
likely to be the areas worth further testing and analysis by the auditor, to assess their
impact on the financial statements.
Accounting Analysis For the auditor, accounting analysis involves two steps. First, the
auditor must understand how the key success factors and risks are reflected in the finan-
cial statements. The second step in accounting analysis is for the auditor to evaluate
management judgment reflected in the critical financial statements items.
Financial Analysis Financial ratios help auditors judge whether there are any unusual
performance changes for their client, either relative to past performance or relative to
their competitors. Any such changes merit further investigation to ensure that the
reasons for the change can be fully explained and to determine what additional tests
are required to satisfy the auditor that the reported changes in performance are justified.
Careful ratio analysis can also reveal whether clients are facing business problems that
might induce management to conceal losses or keep significant obligations off the
balance sheet. Such information should alert auditors that extra care and additional
detailed tests are likely to be required to reach a conclusion on the client’s financial
statements.
12-16
PART 3 • Business Analysis and Valuation Appl ications
Copyright 2012 Cengage Learning. All Rights Reserved. May not be copied, scanned, or duplicated, in whole or in part. Due to electronic rights, some third party content may be suppressed from the eBook and/or eChapter(s).
Editorial review has deemed that any suppressed content does not materially affect the overall learning experience. Cengage Learning reserves the right to remove additional content at any time if subsequent rights restrictions require it.

Prospective Analysis Auditors use prospective analysis to assess whether estimates and
forecasts made by management are consistent with the firm’s economic position. In
addition, the market’s perception of a client’s future performance provides a useful
benchmark for affirming or questioning the auditor’s assessment of the client’s prospects.
If the auditor concludes that the market is either overly optimistic or pessimistic about a
client, he or she can determine whether additional disclosure will help investors develop
a more realistic view of the company’s prospects.
Key Analysis Questions
The following questions are likely to provide a useful starting point for auditors in
their analysis of a client’s financial statements:
• What are the chief business risks facing the firm? How well are these risks
managed?
• What are the accounting policies and estimates that reflect the firm’s principal
risks? What tests and evidence are required to evaluate management judgment
that is reflected in these accounting decisions?
• Do the critical ratios indicate any unusual changes in client performance?
What tests and evidence are required to understand the causes of such
changes?
• Has firm performance deteriorated, creating pressure on management to
manage earnings or record off-balance-sheet transactions? If so, what addi-
tional tests and evidence are required to provide assurance that the financial
statements are consistent with GAAP?
• How is the market assessing the client’s prospects? If different from the auditor,
what is the reason for the difference? If the market is overly optimistic or
pessimistic, are there implications for client disclosure or accounting
estimates?
Example: Auditing Jefferies
The European crisis raises several questions for the firm’s auditors. The company’s man-
agement of its net market exposure to increasingly risky debt instruments and its contin-
ued ability to access funds are critical success factors. The stock price volatility appears to
be largely driven by changing perceptions of this risk, potentially affecting the fair values
of assets and liabilities reported on the balance sheet, and write-downs in the income
statement. These should be a principal focus of the audit.
Questions for the auditor include the following:
• Has the company properly recorded and provided sufficient explanation of posi-
tions held?
• Has the company appropriately disclosed the use of off-balance sheet instruments,
including disclosure of recourse provisions and other critical details?
• Why has the market reacted so negatively to Jefferies over the past year? Is there
something that the market recognizes that Jefferies management does not? What
information is available about the specific hedging strategies that Jefferies claims
is minimizing its market exposure?
• Is the firm’s classification of assets into Level 1, Level 2, and Level 3 appropriate?
What information is there about the models used to value Level 3 assets?
Communication and Governance 12-17
Copyright 2012 Cengage Learning. All Rights Reserved. May not be copied, scanned, or duplicated, in whole or in part. Due to electronic rights, some third party content may be suppressed from the eBook and/or eChapter(s).
Editorial review has deemed that any suppressed content does not materially affect the overall learning experience. Cengage Learning reserves the right to remove additional content at any time if subsequent rights restrictions require it.
• If the firm’s positions appear to be reasonable and well established, what additional
information can the firm provide to investors to address their concerns? Will this
information need to be audited?
THE ROLE OF THE AUDIT COMMITTEE IN THE UNITED STATES
Audit committees are responsible for overseeing the work of the auditor, for ensuring
that the financial statements are properly prepared, and for reviewing the internal
controls at the company. Audit committees, which are mandated by many stock
exchanges and by the SEC, typically comprise three to four outside directors who meet
regularly before or after the full board meetings.
In the last 15 years, requirements for audit committees have been expanded and
formalized. In December 1999, the SEC, the national stock exchange(s), and the Auditing
Standards Board issued new audit committee rules based largely on recommendations of
the Blue Ribbon Committee (BRC) on Improving the Effectiveness of Corporate Audit
Committees. The new rules defined best practices for judging audit committee members’
independence and qualifications.
Following the collapse of Enron, additional audit committee requirements were
created under the Sarbanes-Oxley Act. The Act requires that audit committees take
formal responsibility for appointing, overseeing, and negotiating fees with external
auditors. Audit committee members are required to be independent directors with no
consulting or other potentially compromising relation to management. It is recom-
mended that at least one member of the committee have financial expertise, such as
being a CFO, CEO, or retired audit partner.
The audit committee is expected to be independent of management and to take an active
role in reviewing the propriety of the firm’s financial statements. Committee members are
expected to question management and the auditors about the quality of the firm’sfinancial
reporting, the scope and findings of the external audit, and the quality of internal controls.
In reality, however, the audit committee has to rely extensively on information from man-
agement as well as internal and external auditors. Given the ground that it has to cover, its
limited available time, and the technical nature of accounting standards, audit committees
are not in a position to catch management fraud or auditors’ failures on a timely basis.
How then can the audit committee add value?
17
We believe that many of the financial
analysis tools discussed in this book can provide a useful way for audit committees to
approach their tasks. Many of the applications of the financial analysis steps discussed
for auditors also apply for audit committees.
In its scrutiny of financial statements, the committee should use the 80–20 rule,
devoting most of its time to assessing the effectiveness of those few policies and decisions
that have the most impact on investors’ perceptions of the company’s critical perfor-
mance indicators. This should not require any additional work for committee members,
since they should already have a good understanding of the firm’s key success factors
and risks from discussions of the full board.
Audit committee members should also have sufficient financial background to iden-
tify where in the financial statements the important risks are reflected. Their discussions
with management and external auditors should focus on these risks. How well are they
being managed? How are the auditors planning their work to focus on these areas? What
evidence have they gathered to judge the adequacy of the financial statement estimates?
The audit committee also receives regular reviews of company performance from man-
agement as part of their board duties. Committee members should be especially proactive
in requesting information that helps them evaluate how the firm is managing its key risks,
since this information can also help them judge the quality of the financial statements.
12-18
PART 3 • Business Analysis and Valuation Appl ications
Copyright 2012 Cengage Learning. All Rights Reserved. May not be copied, scanned, or duplicated, in whole or in part. Due to electronic rights, some third party content may be suppressed from the eBook and/or eChapter(s).
Editorial review has deemed that any suppressed content does not materially affect the overall learning experience. Cengage Learning reserves the right to remove additional content at any time if subsequent rights restrictions require it.

Audit committee members need to ask: Is information on company performance we are
receiving in our regular board meetings consistent with the picture portrayed in the finan-
cial statements? If not, what is missing? Are additional disclosures required to ensure that
investors are well informed about the firm’s operations and performance?
Finally, audit committees need to focus on capital market expectations, not just statu-
tory financial reports. In today’s capital markets, the game begins when companies set
expectations via analyst meetings, press releases, and other forms of investor communi-
cations. Indeed, the pressure to manage earnings is often a direct consequence of Wall
Street’s unrealistic expectations, either deliberately created by management or sustained
by their inaction. Thus, it is also important for audit committees to oversee the firm’s
investor relations strategy and ensure that management sets realistic expectations for
both the short and long term.
Key Analysis Questions
The following questions are likely to provide a useful starting point for audit com-
mittees in their discussions with management and auditors about the firm’s finan-
cial statements:
• How are the critical business risks facing the firm being managed?
• How are these risks reflected by accounting policies and estimates in the finan-
cial statements? What was the basis for the external auditor ’s assessment of
these items?
• Is information on the critical value drivers and firm performance presented to
the full board consistent with the picture of the firm reflected in the financial
statements and MD&A?
• What expectations is management creating in the capital market? Are these
likely to cause undue pressure to manage earnings?
SUMMARY
This chapter discussed how many of the financial analysis tools developed in Chapters 2
through 8 can be used by managers to develop a coherent disclosure strategy, and by
corporate board members and external auditors to improve the quality of their work.
By communicating effectively with investors, management can potentially reduce
information problems for outside investors, lowering the likelihood that the stock will
be mispriced or unnecessarily volatile, or that the market will lose confidence in the
company and limit its access to capital entirely. This can be important for firms that
wish to raise new capital or avoid takeovers, or whose management is concerned that
its true job performance is not reflected in the firm’s stock price. Finally, as we saw in
the 2008 financial crisis and in the Jefferies example more recently, financial markets are
fragile and can easily lose confidence in a company and its management. As a result, the
quality and effectiveness of management communication can sometimes have a signifi-
cant impact on a company’s financial viability.
The typical way for firms to communicate with investors is through financial report-
ing. Accounting standards and auditing make the reporting process a way for managers
to not only provide information about the firm’s current performance but also indicate,
through accounting estimates, where they believe the firm is headed in the future.
Communication and Governance 12-19
Copyright 2012 Cengage Learning. All Rights Reserved. May not be copied, scanned, or duplicated, in whole or in part. Due to electronic rights, some third party content may be suppressed from the eBook and/or eChapter(s).
Editorial review has deemed that any suppressed content does not materially affect the overall learning experience. Cengage Learning reserves the right to remove additional content at any time if subsequent rights restrictions require it.

However, financial reports are not always able to convey the type of forward-looking
information that investors need. Accounting standards often do not permit firms to cap-
italize outlays, such as R&D, that provide significant future benefits to the firm.
A second way that management can communicate with investors is through nonac-
counting means. We discussed several such mechanisms, including using financial poli-
cies (such as stock repurchases, dividend increases, and hedging) to help signal
management’s optimism about the firm’s future performance; meeting with financial
analysts to explain the firm’s strategy, current performance, and outlook; and disclosing
additional information, both quantitative and qualitative, to provide investors with infor-
mation similar to that of management.
In this chapter we have stressed the importance of communicating effectively with
investors. But firms also have to communicate with other stakeholders, including employ-
ees, customers, suppliers, and regulatory bodies. Many of the same principles discussed
here can also be applied to management communication with these other stakeholders.
Finally, we examined the capital market role of governance agents, such as external
auditors and audit committees. Both have faced considerable public scrutiny following a
series of financial reporting meltdowns in the United States. Much has been done to
improve the governance and independence of these intermediaries. We focus on how
the financial analysis tools developed in the book can be used to improve the quality of
audit and audit committee work. The tools of strategy analysis, accounting analysis,
financial analysis, and prospective analysis can help auditors and audit committee
members to identify the key issues in the financial statements to focus on and provide
common sense ways of assessing whether there are potential reporting problems that
merit additional testing and analysis.
DISCUSSION QUESTI ONS
1. Amazon’s inventory increased from $3.2 billion on December 31, 2010, to $5.0 bil-
lion one year later. In addition, sales for the fourth quarter of those years increased
from $12.9 billion in 2010 to $17.4 billion in 2011. What is the implied annualized
inventory turnover for Amazon for these years? What different interpretations about
future performance could a financial analyst infer from this change? What informa-
tion could Amazon’s management provide to investors to clarify the change in
inventory turnover? What are the costs and benefits to Amazon from disclosing
this information? What issues does this change raise for the auditor? What addi-
tional tests would you want to conduct as Amazon’s auditor?
2. a. What are likely to be the long-term critical success factors for the following types
of firms?
• a high technology company such as Microsoft
• a large low-cost retailer such as Wal-Mart
b. How useful is financial accounting data for evaluating how well these two com-
panies are managing their critical success factors? What other types of informa-
tion would be useful in your evaluation? What are the costs and benefits to
these companies from disclosing this type of information to investors?
3. Management frequently objects to disclosing additional information on the grounds
that it is proprietary. For instance, when the FASB proposed to expand disclosures
on (a) accounting for stock-based employee compensation (issued in December
2002) and (b) business segment performance (issued in June 1997), many corporate
managers expressed strong opposition to both proposals. What are the potential
proprietary costs from expanded disclosures in each of these areas? If you conclude
12-20
PART 3 • Business Analysis and Valuation Appl ications
Copyright 2012 Cengage Learning. All Rights Reserved. May not be copied, scanned, or duplicated, in whole or in part. Due to electronic rights, some third party content may be suppressed from the eBook and/or eChapter(s).
Editorial review has deemed that any suppressed content does not materially affect the overall learning experience. Cengage Learning reserves the right to remove additional content at any time if subsequent rights restrictions require it.

that proprietary costs are relatively low for either, what alternative explanations do
you have for management’s opposition?
4. In contrast to U.S. GAAP, IFRS permits management to reverse impairment on
fixed assets that have increased in value since the time of their impairment. Reva-
luations are typically based on estimates of realizable value made by management
or independent valuers. Do you expect that these accounting standards will make
earnings and book values more or less useful to investors? Explain why or why
not. How can management make these types of disclosures more credible?
5. Under a management buyout, the top management of a firm offers to buy the com-
pany from its stockholders, usually at a premium over its current stock price. The
management team puts up its own capital to finance the acquisition, with additional
financing typically coming from a private buyout firm and private debt. If manage-
ment is interested in making such an offer for its firm in the near future, what are
its financial reporting incentives? How do these differ from the incentives of man-
agement that are not interested in a buyout? How would you respond to a proposed
management buyout if you were the firm’s auditor? What about if you were a mem-
ber of the audit committee?
6. You are approached by the management of a small start-up company that is plan-
ning to go public. The founders are unsure about how aggressive they should be in
their accounting decisions as they come to the market. John Smith, the CEO, asserts,
“We might as well take full advantage of any discretion offered by accounting rules,
since the market will be expecting us to do so.” What are the pros and cons of this
strategy? As the partner of a major audit firm, what type of analysis would you per-
form before deciding to take on a startup that is planning to go public?
7. Two years after a successful public offering, the CEO of a biotechnology company is
concerned about stock market uncertainty surrounding the potential of new drugs in
the development pipeline. In his discussion with you, the CEO notes that even though
they have recently made significant progress in their internal R&D efforts, the stock
has performed poorly. What options does he have to help convince investors of the
value of the new products? Which of these alternatives are likely to be feasible?
8. Why might the CEO of the biotechnology firm discussed in Question 7 be con-
cerned about the firm being undervalued? Would the CEO be equally concerned if
the stock were overvalued? Do you believe that the CEO would attempt to correct
the market’s perception in this overvaluation case? How would you react to com-
pany concern about market under- or overvaluation if you were the firm’s auditor?
Or if you were a member of the audit committee?
9. When companies decide to shift from private to public financing by making an
initial public offering for their stock, they are likely to face increased costs of inves-
tor communications. Given this additional cost, why would firms opt to go public?
10. German firms are traditionally financed by banks, which have representatives on the
companies’ boards. How would communication challenges differ for these firms rel-
ative to U.S. firms, which rely more on public financing?
NOTES
1. M. Jensen and W. Meckling, “Theory of the Firm: Managerial Behavior, Agency
Costs, and Capital Structure,” Journal of Financial Economics 3 (October 1976):
305–360, analyzes agency problems between managers and outside investors. Subse-
quent work by Bengt Holmstrom and others examines how contracts between
managers and outside investors could mitigate the agency problem.
Communication and Governance 12-21
Copyright 2012 Cengage Learning. All Rights Reserved. May not be copied, scanned, or duplicated, in whole or in part. Due to electronic rights, some third party content may be suppressed from the eBook and/or eChapter(s).
Editorial review has deemed that any suppressed content does not materially affect the overall learning experience. Cengage Learning reserves the right to remove additional content at any time if subsequent rights restrictions require it.
2. K. Murphy and J. Zimmerman, “Financial Performance Surrounding CEO Turn-
over,” Journal of Accounting and Economics 16 (January/April/July 1993): 273–315,
find a strong relation between CEO turnover and earnings-based performance.
3. See S. Teoh, I. Welch, and T. Wong, “Earnings Management and the Long-Run
Market Performance of Initial Public Offerings,” The Journal of Finance 63
(December 1998): 1,935–1,974, and S. Teoh, I. Welch, and T. Wong, “ Earnings
Management and the Underperformance of Seasoned Equity Offerings,” Journal of
Financial Economics 50 (October 1998): 63–99.
4. This market imperfection, often referred to as a “lemons” or “information” problem,
is also discussed in Chapter 1. It was first studied by George Akerlof in relation to
the used car market in “The Market for ‘Lemons’: Quality Uncertainty and the
Market Mechanism,” Quarterly Journal of Economics 90 (1970): 629–650.
5. Of course, improved analysis alone is unlikely to be sufficient to improve market
intermediation if the structural reforms implemented by Regulation Fair Disclosure,
the Sarbanes-Oxley Act, the Global Settlement, and the Dodd-Frank Act fail to
correct the conflicts of interest for intermediaries that we have witnessed in the last
few years.
6. D. Skinner, “Earnings Disclosures and Stockholder Lawsuits,” Journal of Accounting
and Economics (November 1997): 249–283, finds that firms with bad earnings news
tend to predisclose this information, perhaps to reduce the cost of litigation that
inevitably follows bad news quarters.
7. For example, G. Foster, “Briloff and the Capital Market,” Journal of Accounting
Research 17, no. 1 (Spring 1979): 262–274, finds firms that are criticized for their
accounting by Abraham J. Briloff in Barron’ s on average suffer an 8 percent decline
in their stock price around the article publication date. H. Desai and P. Jain, “Long-
Run Stock Returns Following Briloff’s Analyses,” Financial Analysts Journal 60,
no. 2 (March/April 2004): 47–56, find significant declines in one- and two-year per-
formance of the firms that Briloff criticized.
8. Findings by P. Healy and K. Palepu in “Earnings Information Conveyed by
Dividend Initiations and Omissions,” Journal of Financial Economics 21 (September
1988): 149–175, indicate that investors interpret announcements of dividends initia-
tions and omissions as managers’ forecasts of future earnings performance.
9. See L. Dann, R. Masulis, and D. Mayers, “Repurchase Tender Offers and Earnings
Information,” Journal of Accounting and Economics (September 1991): 217–252,
and M. Hertzel and P. Jain, “Earnings and Risk Changes Around Stock
Repurchases,” Journal of Accounting and Economics (September 1991): 253–276.
10. See M. Barth and R. Kasznik, “Share Repurchases and Intangible Assets,” Journal of
Accounting and Economics 28 (December 1999): 211–241.
11. See S. Tasker, “Bridging the Information Gap: Quarterly Conference Calls as a
Medium for Voluntary Disclosure.” Review of Accounting Studies 3, nos. 1–2 (1998):
137–167.
12. See R. Frankel, M. Johnson, and D. Skinner, “An Empirical Examination of Confer-
ence Calls as a Voluntary Disclosure Medium,” Journal of Accounting Research 37,
no. 1 (Spring 1999): 133–150.
13. See M. Kimbrough, “The Effect of Conference Calls on Analyst and Market Under-
reaction to Earnings Announcements,” The Accounting Review 80, no. 1 (January
2005): 189–219.
14. See A. Irani, “The Effect of Regulation Fair Disclosure on the Relevance of Confer-
ence Calls to Financial Analysts,” Review of Quantitative Finance and Accounting 22,
no. 1 (January 2004): 15–28.
12-22
PART 3 • Business Analysis and Valuation Appl ications
Copyright 2012 Cengage Learning. All Rights Reserved. May not be copied, scanned, or duplicated, in whole or in part. Due to electronic rights, some third party content may be suppressed from the eBook and/or eChapter(s).
Editorial review has deemed that any suppressed content does not materially affect the overall learning experience. Cengage Learning reserves the right to remove additional content at any time if subsequent rights restrictions require it.
15. Research on voluntary disclosure includes M. Lang and R. Lundholm, “Cross-
Sectional Determinants of Analysts’ Ratings of Corporate Disclosures,” Journal of
Accounting Research 31 (Autumn 1993): 246–271; M. Lang and R. Lundholm,
“Corporate Disclosure Policy and Analysts,” The Accounting Review 71 (October
1996): 467–492; M. Welker, “Disclosure Policy, Information Asymmetry and Liquid-
ity in Equity Markets,” Contemporary Accounting Research (Spring 1995): 801–827;
C. Botosan, “The Impact of Annual Report Disclosure Level on Investor Base and
the Cost of Capital,” The Accounting Review (July 1997): 323–350; and P. Healy,
A. Hutton, and K. Palepu, “Stock Performance and Intermediation Changes Sur-
rounding Sustained Increases in Disclosure,” Contemporary Accounting Research
16, no. 3 (Fall 1999): 485–521. This research finds that firms are more likely to pro-
vide high levels of disclosure if they have strong earnings performance, issue securi-
ties, have more analyst following, and have less dispersion in analyst forecasts. In
addition, firms with high levels of disclosure policies tend to have a lower cost of
capital and bid–ask spread. Finally, firms that increase disclosure have accompa-
nying increases in stock returns, institutional ownership, analyst following, and
stock liquidity. In addition, in “The Role of Supplementary Statements with Man-
agement Earnings Forecasts,” Journal of Accounting Research 41 (December 2003):
867–890, A. Hutton, G. Miller, and D. Skinner examine the market response to
management earnings forecasts and find that bad news forecasts are always informa-
tive but that good news forecasts are informative only when they are supported by
verifiable forward-looking statements.
16. See J. Cotter, I. Tuna, and P. Wysocki, “Expectations Management and Beatable
Targets: How do Analysts React to Explicit Earnings Guidance?” Contemporary
Accounting Research 23, no. 3 (Autumn 2006): 593–628.
17. See P. Healy and K. Palepu, “Audit the Audit Committees: After Enron Boards Must
Change the Focus and Provide Greater Financial Transparency, ” Financial Times,
June 10, 2002, p. 14.
Communication and Governance 12-23
Copyright 2012 Cengage Learning. All Rights Reserved. May not be copied, scanned, or duplicated, in whole or in part. Due to electronic rights, some third party content may be suppressed from the eBook and/or eChapter(s).
Editorial review has deemed that any suppressed content does not materially affect the overall learning experience. Cengage Learning reserves the right to remove additional content at any time if subsequent rights restrictions require it.

SUBJECT INDEX
Note: In each entry, the first number is the chapter number; the number(s) following the hyphen (-) is(are) the page or
range of pages on which the entry appears. Italic type indicates the page numbers of charts and tables. An “n” after a page
number indicates that the entry is an author’s note.
A
A. M. Best, 10-10
abandonment option, 8-14
accounting. See also accrual
accounting
clean surplus, 7-18n, 8-17n
as communication, 12-7–9
inventory, 3-8, 3-9, 3-12, 3-17n,
3-19n, 5-30n, 10-7
market-value, 7-18n, 8-12
accounting analysis, 3-1–20, 4-1–46.
See also financial statements
of assets
distortions of, 4-7–9
overstatements of, 4-10–14
understatements of, 4-14–20
auditing and, 12-16
business analysis and, 1-10
discounted abnormal earning,
7-5–7
equity distortions in, 4-23
financial statements influenced by,
1-4–8
institutional framework for,
3-1–6
liability distortions in, 4-20–21
liability understatements in,
4-21–22
pitfalls in, 3-14–15
quality of, 3-6–8
recasting financial statements for,
4-2–7, 4-37–45
balance sheet example of,
4-38–39, 4-43
cash flow statement example of,
4-40–43, 4-44–45
income statement example of,
4-39–40, 4-44
steps in, 3-9–14
valuation, 8-13–14
value of, 3-15–16
accounting rate-of-return, 6-18n
accounts receivable
as loan security, 10-6–7
off balance sheet, 4-21
sale of, with recourse, 3-13
unusual increases in, 3-12
accrual accounting, 1-1–5, 3-1–2,
3-17n, 7-14–
15
acts, legislative
Clayton Act of 1914, 11-3
Hart Scott Rodino Act of 1976,
11-3
Sarbanes-Oxley Act, 1-7–8, 3-3– 5,
12-1, 12-7, 12-18, 12-22n
Sherman Antitrust Act of 1890,
11-3
Tax Reform Act of 1986, 11-2
Air France-KLM Airlines, 4-16
Altman Z-score model, 10-15
American Airlines (AMR), 10-11
American Institute of Certified Public
Accountants (AICPA), 12-4
amortization, 4-11, 4-15
annual reports, 3-11, 3-19n
antitrust laws, 3-8, 11-3
Apple Computer, Inc., 4-11
arbitrageurs, risk, 11-1, 11-13
asset turnover, 5-12–15, 5-22, 5-30n
assets. See also capital asset
pricing; capital asset pricing
model (CAPM)
definition of, 3-2
distortions in, 4-7–9
fair values of, 4-9
goodwill as, 4-2
intangible, 3-14, 4-16, 4-18–20
lease, 4-15–16
management ratios for, 5-15
“negative pledge” on, 10-7. See also
credit analysis
overstatement of, 4-10–14
sales against long term, 6-12
sales of, 3-12
understatement of, 4-14–20
valuation of, 7-22–23, 8-17–19,
8-18, 8-19
write-offs of, 3-13, 3-20n
Association for Investment
Management and Research,
3-19n
audit committees, 3-3, 12-18–19,
12-23n
auditing
description of, 1-7–8
external, 3-5–6
for governance and
communication, 12-16–17
limitations of, 12-8
qualified audit opinions in, 3-13
Auditing Standards Board, 12-18
autoregressive model, 7-10–11
B
β (beta)
description of, 7-10–11
economic sensitivity measured by,
8-8–11
estimating, 8-17n
bad debts, provision for, 3-20n
balance sheet, 3-1
accounts receivable off, 4-21
intangible assets off, 4-16, 4-18–20
lease assets off, 4-15–16
recasted for accounting analysis,
4-38–39, 4-43
standardized, 4-4–5
bankruptcy, 10-15, 10-20n
banks, commercial, 10-3–4
bargaining power, 2-1–2, 2-6
behavioral finance, 9-5, 9-15n
benchmarking, competitive, 1-10
Best Buy Co., 10-11
I-1
Copyright 2012 Cengage Learning. All Rights Reserved. May not be copied, scanned, or duplicated, in whole or in part. Due to electronic rights, some third party content may be suppressed from the eBook and/or eChapter(s).
Editorial review has deemed that any suppressed content does not materially affect the overall learning experience. Cengage Learning reserves the right to remove additional content at any time if subsequent rights restrictions require it.
Blockbuster, 10-11
Blue Ribbon Committee (BRC), on
Improving the Effectiveness
of Corporate Audit
Committees, 12-18
bond funds, 9-2
bonus hypothesis, 3-18n
book rate-of-return, 6-18n
book value of assets, 4-9
Boston Scientific, Inc., 11-15
Brand Equity and Business
Promotion (BEBP), 2-18
buy-side analysts, 9-7, 9-16n
C
capacity, excess, 2-3
Capital Asset Pricing Model (CAPM),
8-8–11, 8-9, 9-12
capital markets, 1-1–4, 3-8
capital structure of firms, 11-11–12
cash accounting, 1-4, 3-17n
cash flow analysis, 1-10
in financial analysis, 5-22–27,
5-25
forecasting and, 6-15–16
in mergers and acquisitions,
11-12
in valuation, 8-14–15
cash flow model, discounted,
7-12–13, 7-18n, 7-21
cash flow statements, 3-1
recasted for accounting analysis,
4-40–43, 4-44–45
reported income gap in, 3-12
standardized, 4-6–7
cash ratio, 5-16
Caterpillar, Inc., 4-27
central planning, 1-1
CEO turnover, 12-22n
checks and balances, intermediaries
as, 1-3–4
Chevron, Inc., 11-16
Clayton Act of 1914, 11-3
clean surplus accounting, 7-17n,
7-18n, 8-17n
Clearwire, 10-11
Clorox Co., 11-3
CNOOC Oil Company (China), 11-16
Coca-Cola Enterprises, 2-6, 10-11
commercial banks, 10-3–4
communication and governance.
See governance and
communication
Community Health Systems (CHS),
4-12–13
Compaq, Inc., 2-6
compensation of management,
3-7–8, 3-18n
competition. See also mergers
accounting choices based on, 3-8
actual and potential, 2-2–5
benchmarking against, 1-10
equilibrium assumption, 8-4–6
of mature companies, 6-4
competitive advantage
achieving, 2-11
creating, strategies for, 2-9
sources of, 2-10–11
sustaining, 2-11
competitive strategy analysis, 2-9–14
computing equity value, 8-11–13
conflicts of interest, 1-3 –4, 1-8,
9-17n, 10-2, 12-7, 12-8,
12-22n
contrarian investment, 9-15n, 9-17n
core competencies, 2-11
corporate bond funds, 9-2
corporate control contests, 3-8
corporate interest tax shields, 10-2
corporate strategy analysis, 2-14–19
cost leadership, 2-9, 2-10
costs
of capital, 6-18n, 8-10–11. See also
weighted average cost of
capital (WACC)
of debt financing, 10-2–3
fixed vs. variable, 2-3
in mergers and acquisitions,
11-13
switching, 2-3
transaction, 2-15
coverage ratios, 5-18, 10-7–9, 10-12
Creative Technology, Inc., 4-11
credibility problems, 12-9
credit analysis, 1-10, 10-1–21
credit market and, 10-3– 5
credit ratings, 10-16–18
for debt financing, 10-2– 3
distress prediction and turnaround
in, 10-14–16
financial statement analysis in,
10-10–14
process of, 10-5–10
subprime crisis, 10-16–18
credit risk, 3-9, 10-4
Credit Suisse/Hedge Fund Index,
10-21n
creditors and stockholders, costs of
conflicts, 10-2
cross-border acquisitions, 11-3
D
Daimler, 10-11
debt. See also credit analysis
bad, provision for, 3-20n
covenants for, 3-7, 3-18n, 10-8–10
financial management ratios on,
5-17–19
“negative,” 5-6
provision for bad, 3-20n
weighting cost of, 8-18
debt financing, 10-2–3
debt ratings, 10-10–12, 10-11–12,
10-13, 10-14
debt-for-equity swaps, 3-12
demand curves, 9-15n
demand saturation, 6-4
depreciation
accounting for, 3-9
overstated, 4-15, 4-16–17
understated, 4-11
derivatives, 3-17n
differentiation, 2-3, 2-9, 2-10–11
disclosure
discounted abnormal earnings
method of valuation, 9-9
Generally Accepted Accounting
Principles (GAAP) of, 3-4
minimum, 1-6
quality of, 3-10–11
SEC Regulation Fair Disclosure
and, 9-12, 12-13, 12-22n
stock prices affected by, 3-18n,
3-19n
voluntary, 1-6, 12-13–14, 12-22n,
12-23n
discount rate, computation of, 8-8–11
debt and equity costs in, 8-10–11
leverage change effects in, 8-11–12
mergers and acquisitions, 11-9–10
I-2 Subject Index
Copyright 2012 Cengage Learning. All Rights Reserved. May not be copied, scanned, or duplicated, in whole or in part. Due to electronic rights, some third party content may be suppressed from the eBook and/or eChapter(s).
Editorial review has deemed that any suppressed content does not materially affect the overall learning experience. Cengage Learning reserves the right to remove additional content at any time if subsequent rights restrictions require it.
discounted abnormal earnings
method of valuation, 7-5–7,
7-17n, 7-21–22, 8-17n,
11-8–10, 11-9
discounted cash flow model,
7-12–13, 7-18n, 7-21
discounted dividends method of
valuation, 7-3–4, 7-21–22
discounted receivables
off balance sheet, 4-27–28
with recourse, 4-27–28
discriminant analysis, 10-20n
distress prediction. See credit
analysis
distribution, channels of, 2-4
diversification strategy, 2-16, 11-3–5,
11-19n
divestitures, 11-4
dividends
discounted dividends method
of valuation and, 7-3–4,
7-21–22
payout policies for, 5-1, 5-20, 5-24,
12-10
preferred, 10-20n
retained earnings versus, 7-18n
valuation and, 8-15
Dodd-Frank Wall Street Reform
and Consumer Protection
Act, 1-8, 10-17, 12-1, 12-9
dot-com crash, 9-15n
Dubai Ports World, 11-16
Dun & Bradstreet, 10-10
E
earnings
abnormal, in asset valuation,
7-22
behavior of, 6-4. See also
forecasting
discounted abnormal, 7-4–7,
7-21–22, 8-17n, 9-9,
11-8–10
multiples of value-to, 7-8–9,
11-7–8
valuation based on, 7-10–12
valuation formulas, 7-21
“earnings momentum,”, 9-7
Eastman Kodak, 10-11
EBITDA (earnings before interest,
taxes, depreciation, and
amortization), 5-10–11
economic rents, 7-18n
economics, 2-15, 4-8–9
economies of scale, 2-4, 11-2
efficiency
market, 9-3–5
procurement, 5-9–10
production, 5-9–10
semi-strong, 9-16n
emerging markets, 2-15
energy, 2-17
Enron Corporation, 3-19n
audit failure at, 3-6, 12-4,
12-18
balance-sheet “window-dressing”
at, 3-20n
“herding” behavior and, 9-12,
9-15n
intermediary conflicts of interest
and, 1-3–4
Sarbanes-Oxley Act and, 1-7–8
sell-side analysts and, 9-11–12,
9-16n
entrepreneurs, 1-2
equity. See also ratios; return on
equity (ROE)
debt-for-equity swaps of, 3-12
definition of, 3-2
distortions of, 4-23
valuation of, 8-11–13
weighting cost of, 8-11
equity funds, 9-2
equity partnerships, 12-11
equity security analysis, 9-1–18
fund management and, 9-5–6
investment vehicles in, 9-2–3
market efficiency and, 9-3–5
performance of analysts and fund
managers in, 9-11–13
process of, 9-6–11
E-Trade, 10-11
European Competition Commission,
11-16
excess capacity, 2-3
exit barriers, 2-3
expenses, defined, 3-2
external auditing, 3-5–6
Exxon Mobil, 10-11
F
FactSet Mergerstat, LLC, 11-19n,
11-20n
fair value, 4-9
Federal Trade Commission (FTC),
11-3, 11-16, 11-19n
Fiat, 10-11
FIFO inventory accounting, 3-18n,
5-30n
Financial Accounting Standards
Board (FASB), 1-6, 4-24
accounting credibility and, 12-7
auditors and, 1-7
governance role of, 12-3
on hybrid securities, 4-23
Securities and Exchange
Commission (SEC) and,
3-4
Statement of Financial Accounting
Standards (SFAS) No. 2 of,
3-7
Statement of Financial Accounting
Standards (SFAS) No. 6 of,
3-17n
Statement of Financial Accounting
Standards (SFAS) No. 95 of,
5-23
Statement of Financial Accounting
Standards (SFAS) No. 144 of,
4-9
financial analysis, 5-1–43
auditing and, 12-16–12-17
cash flow analysis in, 5-22–27
ratio analysis in, 5-1–22
for financial management,
5-15–19
historical patterns of, 5-21 –22
for investment management,
5-12–15
for operating management,
5-8–12
for profitability, 5-3–8
for sustainable growth, 5-20–21
financial distress, legal costs of,
10-2
financial intermediaries, 1-3, 12-8
financial statements, 1-1–12
accounting system influence on,
1-4–8
Subject Index I-3
Copyright 2012 Cengage Learning. All Rights Reserved. May not be copied, scanned, or duplicated, in whole or in part. Due to electronic rights, some third party content may be suppressed from the eBook and/or eChapter(s).
Editorial review has deemed that any suppressed content does not materially affect the overall learning experience. Cengage Learning reserves the right to remove additional content at any time if subsequent rights restrictions require it.
financial statements (continued)
β (beta) estimates from, 8-16n
business activity relationship to,
1-4, 1-5
business analysis relationship to,
1-8–11, 1-9
capital market role of, 1-1–4
in credit analysis, 10-10–14
forecasting and, 6-2
for governance and
communication, 12-6–9
market efficiency and, 9-4
recasted for accounting analysis,
4-2–7
stock return estimates from,
9-15n
first mover advantage, 2-4
Fitch Ratings, 10-10
fixed costs, 2-3
flexibility, accounting, 3-9–10
Ford Motor Company, 10-11
forecasting, 6-1–21. See also
valuation
capital structure, 6-12–13
of cash flow, 6-15– 16
in credit analysis, 10-8
errors in, 3-7
leading multiples based on,
7-3, 7-7
macroeconomic factors in, 6-8
in mergers and acquisitions,
11-7–9
NOPAT margin in, 6-11–12
performance behavior in,
6-3–7
sales growth, 6-9–11
of security analysts, 9-11
sensitivity analysis in, 6-13–16
stock prices, 9-9
structure for, 6-1–3
in valuation implementation,
8-1–2, 8-2, 8-18
working capital to sales, 6-12
Fortune magazine, 2-17
Foster model, 6-15–16, 6-19n
free cash flows, 5-26, 11-8–9
fundamental security analysis,
9-5–6
funds flow coverage ratios,
10-7–8
G
General Electric (GE), 9-8, 9-9, 9-16n
corporate strategic analysis of,
2-16–19
debt ratings of, 10-11
diversification of, 2-15
General Motors (GM)
Altman Z-score model of, 10-15
debt ratings of, 10-11
Generally Accepted Accounting
Principles (GAAP), 1-6,
3-3–5, 3-20n, 8-17n, 12-15
companies using, 4-24–28
International Financial Reporting
Standards (IFRS) and,
4-24–28
Generally Accepted Auditing
Standards (GAAS), 3-5
global sourcing network, 2-12
“golden parachutes,”, 11-15–16,
11-20n
goodwill, 4-2
governance and communication,
12-1–23
analyst meetings as, 12-13
audit committees and, 1-7,
12-18–19
auditor’s role in, 12-15–16
example of, 12-14–15
financial policies as, 12-10–12
financial reporting as, 12-6–10
intermediaries and, 1-2–3
investors and, 12-4–6
overview of, 12-2–4, 12-3
voluntary disclosure as, 12-13–14
gross profit margins, 5-9–10
growth funds, 9-2
growth simplification model,
7-11–12
Guidant Corporation, 11-15
H
Hart Scott Rodino Act of 1976, 11-3
hedging, 9-2–3, 12-11–12
“herding” behavior, 9-12, 9-15n
high yield funds, 9-2
Hoover’s database, 7-2
hostile takeovers, 3-8
hybrid securities, 4-23
I
income funds, 9-2
“income smoothing”, 3-14
income statement, 3-1
intangible assets, 4-18–20
standardized, 4-2–3
index funds, 9-2
industry analysis, 2-1–6, 2–2
of bargaining power, 2-6
of competition, 2-2–5
limitations of, 2-9
principal accounting policies in,
3-9
inflation, 8-9n, 8-16n
information intermediaries, 1-2–3
information technology and
communications, 2-17
initial public offerings (IPOs), 3-20n,
12-22n
insider information, 1-2
insurance companies, 10-4
intangible assets, 3-14, 4-16
interest coverage ratio, 5-18
interest expense, 5-24, 10-7, 10-14
interest rate risk, 3-9
intermediaries, 1-2–3, 12-8–9
intermediation chain, 12-3
International Accounting Standards
Committee (IASC), 3-4
International Financial Reporting
Standards (IFRS), 1-6, 3-4,
4-24–28
inventory accounting, 3-8, 3-9, 3-12,
3-18n, 3-19n, 5-30n, 10-7
inventory valuation, 4-27
investment management, 5-12–15,
9-2–3, 9-14n. See also equity
security analysis
J
Jefferies Group, Inc.
accounting communications of,
12-9
analyst meetings, 12-13
auditing, 12-17–18
communication issues for, 12-5–6
financial policies at, 12-12
voluntary disclosure, 12-14
Johnson & Johnson, 10-11, 11-15
I-4 Subject Index
Copyright 2012 Cengage Learning. All Rights Reserved. May not be copied, scanned, or duplicated, in whole or in part. Due to electronic rights, some third party content may be suppressed from the eBook and/or eChapter(s).
Editorial review has deemed that any suppressed content does not materially affect the overall learning experience. Cengage Learning reserves the right to remove additional content at any time if subsequent rights restrictions require it.
K
Kaplan-Urwitz model, of debt
ratings, 10-13, 10-14
L
labor unions, 3-8
leading multiples, 7-3, 7-7
learning economies, 2-3
lease assets
financing for, 10-6
off balance sheet, 4-15–16, 4-21
legal barriers, 2-4
legislation. See acts, legislative
Lehman Brothers Corporation, 12-4
“lemons” problem, 1-2, 12-22n
leverage
debt financing and, 10-2 –3
in debt ratings, 10-13, 10-14
equity cost adjustments from,
8-10–11
financial, 5-4–6, 5-15–19, 5-22
in mergers and acquisitions, 11-11
multiples adjusted for, 7-3
leverage buyouts, 12-11
liabilities
definition of, 3-2
distortions in, 4-20–21
to equity ratio, 5-17
understated, 4-21–22
LIBOR (London Interbank Offer
Rate), 10-10–11
LIFO inventory accounting, 3-8,
3-18n, 5-30n
lines of credit, 10-16
liquidity, 5-16–17, 9-5, 10-6
loans. See credit analysis
long-term asset, 4-26–27
long-term asset management,
5-13–15
Lufthansa Airlines, 4-16–18
M
machinery and equipment, 10-7
Management Discussion & Analysis
(MD&A)
in annual reports, 3-11, 3-19n
market efficiency, 9-3–5, 9-15n
market neutral funds, 9-3
marketable securities, 3-17n. See also
equity security analysis;
Securities and Exchange
Commission (SEC)
market-to-book anomaly, 6-18n
market-value accounting, 7-18n,
8-12
McDonald’s Corp, 10-11
“mean-reverting” ratios, 6-3
mergers and acquisitions, 11-1–21
analysis of, 1-10
financing of, 11-11–14
outcomes of, 11-14–17
pricing of, 11-5–11
reasons for, 11-2–4
Microsoft, 4-11, 4-18–20, 10-11
MicroStrategy, Inc, 4-22
Mobil Corporation, 11-16
Modigliani-Miller theorem, 8-15
momentum funds, 9-12
Moody’s, 10-10
mortgage funds, 9-2
mortgage loans, 10-6
municipal funds, 9-2
N
national security, 11-16
negative book value, 8-14
“negative debt,” 5-6, 5-30n
negative free cash flow, 5-26
“negative pledge, ” on assets, 10-7
net profit margins, 5-8 –12
net-debt-to-equity ratio, 5-17
net-debt-to-net capital ratio, 5-17
Netflix, 10-11
New York Stock Exchange (NYSE),
9-12, 10-3
non-bank financial institutions,
10-4
NOPAT (net operating profit after
taxes) margin
in asset valuation methods,
7-22–23
forecasting, 6-11–12
historical pattern of, 5-21 –22
in operating management ratios,
5-10–11
in profitability ratios, 5-9–11
Nordstrom, Inc., 2-13–14
accounting analysis, 4-28–30
cash flow analysis, 5-27
O
OneSource database, 7-2
open lines of credit, 10-6
open store concept, 2-12
operating management, 5-8–12
P
parent-subsidiary relationships,
10-5
pension benefits, 3-9
fund manager performance with,
9-18n
Pfizer Inc., 3-14, 11-1
Acquisition of Wyeth, 11-4–5
Financing of Wyeth, 11-14
post-employment benefits, 3-10
preferred stock, 10-20n
price multiples
in asset valuation, 7-22–23
in firm valuation, 7-2–3, 7-7–10
in mergers and acquisitions,
11-7–8
terminal value based on, 8-6
valuation formulas, 7-21
price premium, 5-10, 11-6–7
price sensitivity, 2-5, 8-8. See also
β (beta)
price-earnings valuation, 11-8
prime rate, 10-10
procurement efficiency, 5-9–10
production efficiency, 5-9–10
product-market rents, 11-3
profitability
competitive strategy for, 2-7
in debt ratings, 10-13, 10-14
definition of, 3-2
drivers of, 5-2
industry structure and, 2-2
ratios of, 5-3–8
prospective analysis, 1-10–11, 12-17.
See also forecasting; valuation;
valuation implementation
provision for bad debts, 3-20n
proxy fights, 3-8
Public Company Accounting
Oversight Board (PCAOB),
1-8, 3-5, 12-4
public debt securities, 10-1. See also
credit analysis
Subject Index I-5
Copyright 2012 Cengage Learning. All Rights Reserved. May not be copied, scanned, or duplicated, in whole or in part. Due to electronic rights, some third party content may be suppressed from the eBook and/or eChapter(s).
Editorial review has deemed that any suppressed content does not materially affect the overall learning experience. Cengage Learning reserves the right to remove additional content at any time if subsequent rights restrictions require it.
Q
qualified audit opinions, 3-13
quantitative models, debt ratings,10-13
R
“random walk” earnings behavior,
6-4, 7-10
rate-of-return, 6-18n
ratios, 1-10. See also forecasting
in bankruptcy prediction, 10-19n
coverage, 5-18, 10-7–8, 10-14
in credit analysis, 10-7–8
debt ratings and, 10-11–12
financial management, 5-15–19
of fixed to variable costs, 2-3
historical pattern of, 5-21–22
investment management, 5-12–15
leverage, 10-3
operating management, 5-8–12
price-earnings ratio, 7-2, 7-3,
7-9, 7-15
profitability, 5-3–8
sustainable growth, 5-20–21
terms used in, 5-6
real estate, 10-7
Realogy, 10-11
regional funds, 9-2
regulations. See also acts, legislative
accounting choices and, 3-8, 3-18n
antitrust, 11-3, 11-16
as exit barriers, 2-3
Sarbanes-Oxley Act, 12-1, 12-7,
12-18, 12-22n
SEC Regulation Fair Disclosure,
9-12, 12-13
Tax Reform Act of 1986, 11-2
related-party transactions, 3-13, 3-20n
rents
economic, 7-18n
product-market, 11-3
research and development,
investment in
accounting analysis quality and,
3-13, 3-19n
capitalization of, 7-18n
as intangible asset, 4-16
reserves, 4-10, 4-12–13, 4-15
residual values, 3-9
restructuring, 10-2, 11-2
return on assets (ROA)
historical pattern of, 5-21–22
as profitability ratio, 5-4–8
return on equity (ROE)
in accounting analysis, 3-15, 3-20n
computing, 5-30n
economic rents and, 7-18n
forecasting and, 6-5, 6-5–7
growth simplification and,
7-11–12
historical pattern of, 5-21–22
market expectations of, 9-9
price-to-book multiples and, 7-12
as profitability ratio, 5-3–5, 5-5
in prospective analysis, 1-10–
11
value-earnings multiples and,
7-8–10
revenues
aggressive recognition of, 4-8,
4-10–11, 4-13–14
definition of, 3-2
unearned, 4-21–22
revolving lines of credit, 10-6
risk
arbitrage for, 11-1, 11-13
β (beta) as measure of, 8-8, 8-11,
8-17n
credit, 3-9, 10-4
interest rate, 3-9
systematic, 10-14
unavoidable, 9-3
unsystematic, 10-14
S
SAB 104, 3-17n
sales growth, 6-3–4, 6-4, 6-9–11.
See also forecasting
Samsung, Inc., 4-11
Sarbanes-Oxley Act
on audit committees, 3-3, 12-18
auditing affected by, 1-7–8, 12-1,
12-7
on conflicts of interest, 12-22n
Generally Accepted Auditing
Standards (GAAS) and, 3-6
savings, investments for, 1-1–2
Sbarro’s, 10-11
seasonality, 6-15–16
sector funds, 9-2
Securities and Exchange
Commission (SEC)
accounting credibility and, 12-4
audit committee rules of, 12-18
Financial Accounting Standards
Board (FASB) and, 3-4
governance role of, 12-4
on Management Discussion &
Analysis (MD&A) section,
3-11, 3-19n
Regulation Fair Disclosure of,
9-12, 12-13, 12-22n
SAB 104 of, 3-17n
stakeholders, accounting choices
and, 3-19n
security, national, 11-16
selling, general, and administrative
expenses, 5-10–11
sell-side analysts, 9-11–12, 9-14n,
9-16n
semi-strong efficiency, 9-16n
sensitivity analysis, 6-13–16, 8-13,
11-9–10
Sherman Antitrust Act of 1890,
11-3
short funds, 9-2
short-selling funds, 9-3
significant buying power, 2-12
“size effect,”, 8-9, 8-9–10, 10-13,
10-14
size-based funds, 9-2
Sony, Inc., 4-11
special situation funds, 9-3
spin-offs, 2-16, 2-42n, 9-15n
spread, 5-6, 5-21
stakeholders, accounting choices
and, 3-8
Standard & Poor’s (S&P)
β (beta) estimates of, 8-8, 8-16n
Compustat database of, 6-3
debt ratings of, 10-10
Index of, 8-8, 9-2, 9-15n, 10-21n
standardization, 2-3. See also
accounting analysis
Statement of Financial Accounting
Standards (SFAS)
No. 2, 3-7
No. 6, 3-17n
No. 95, 5-23
No. 144, 4-9
I-6 Subject Index
Copyright 2012 Cengage Learning. All Rights Reserved. May not be copied, scanned, or duplicated, in whole or in part. Due to electronic rights, some third party content may be suppressed from the eBook and/or eChapter(s).
Editorial review has deemed that any suppressed content does not materially affect the overall learning experience. Cengage Learning reserves the right to remove additional content at any time if subsequent rights restrictions require it.
stock options, 3-8
stock prices, 3-18n, 3-19n, 8-8, 9-9,
10-20n. See also Capital Asset
Pricing Model (CAPM)
stock repurchasing, 12-11–12,
12–22n
stockholders, 11-6–7, 11-11, 11-13,
12-11
strategy analysis, 2-1–24
auditing and, 12-16
competitive, 2-9–14
corporate, 2-14–19
industry analysis in, 2-1–6, 2-2
substitute products, 2-4–5
suppliers, bargaining power of, 2-6
sustainable growth, 5-20, 5-20–21,
5-21
switching costs, 2-3
systematic risk, 8-8–9, 8-16n, 10-14.
See also β (beta)
T
takeovers, 3-8, 11-15
tariffs, 3-8
Tata Administrative Services (TAS),
2-18
Tata Group, 2-16–19
Tata Management Training
Centre (TMTC), 2-18
Tata Quality Management
Services (TQMS), 2-18
Tax Reform Act of 1986, 11-2
taxes
accounting choices and, 3-8, 3-18n
corporate interest tax shields
and, 10-2
lease, 5-12–13
mergers and acquisitions and,
11-11, 11-13, 11-19n
in operating management, 5-11
technical security analysis, 9-5
term loans, 10-6
terminal value
abnormal performance with, 8-5–6
competitive equilibrium
assumption with, 8-4–5
estimating, 8-7–8
price multiple as basis for, 8-6
valuation methods and, 7-14–15
third-party auditing, 1-7, 3-6
Thomson One Analytics, 9-16n
time value of money, 7-19–20
TJX Companies, Inc., 2-12–13,
10-11
accounting analysis, 4-28–30
asset value, 8-17–19, 8-18, 8-19
condensed income statement of,
5-33–34
consolidated balance sheet of,
4-38–39
consolidated cash flow statement
of, 4-40–43
consolidated income statement of,
4-39–40
equity, cost of, 8-10, 8-12
forecasted financial statements,
8-3
forecasting assumptions, 8-2
forecasting performance of
example of, 6-7–8, 6-11, 6-12
performance forecasts, 8-2, 8-4
standardized balance sheet of,
5-32
standardized cash flow statement
of, 5-32–33
standardized consolidated balance
sheet of, 4-43–44
standardized consolidated cash
flow statement of, 4-44–45
standardized consolidated income
statement of, 4-44
standardized income statement of,
5-34
terminal value, 8-7–8
trade credit, 10-6
trade payables. See credit analysis
trademarked brands, 4-16
trailing multiples, 7-3
transaction cost economics, 2-15
turnover ratios, 5-12–15, 5-21,
5-30n
Tyco Corporation, 12-4
U
U.S. Congress, 1-7
U.S. Treasury, 8-9
Unocal, 11-16
unsystematic risk, 10-14
U.S. Retail Department Store
Industry, 2-6–8
competition in, 2-6–8
V
valuation, 7-1–23
of assets, 7-22–23
comparing methods of, 7-13–15
discounted abnormal earnings
method of, 7-4–7, 7-22–23
discounted cash flow model in,
7-12–13
discounted dividends method of,
7-3–4
in equity security analysis, 9-6
formulas, 7-21
in mergers and acquisitions, 11-8,
11-8–9, 11-9
price multiples in, 7-2–3
shortcut forms of earnings-based,
7-10–12
valuation implementation, 8-1–19
asset value, 8-17–19
discount rate computation in,
8-8–11
equity values in, 8-11–13
performance forecasts in, 8-1–2
practical issues in, 8-13–15
terminal values in, 8-2–8
value creation, 2-15–16, 10-2, 11-2–3
value funds, 9-2
Value Line, 7-18n, 8-8, 8-10, 8-16
“value stocks,” 9-15n
value-earnings multiples, 7-8–10
value-to-book multiples, 7-7–8
variable costs, 2-3
venture capital firms, 12-11
W
Wal-Mart Stores, Inc. See also
financial analysis
Altman Z-score model of, 10-15,
10-15
debt ratings of, 10-11
estimating cost of capital of, 8-4–6
estimating terminal value of, 8-7,
8-7–8
forecasting performance of
assumptions for, 8-2
Subject Index I-7
Copyright 2012 Cengage Learning. All Rights Reserved. May not be copied, scanned, or duplicated, in whole or in part. Due to electronic rights, some third party content may be suppressed from the eBook and/or eChapter(s).
Editorial review has deemed that any suppressed content does not materially affect the overall learning experience. Cengage Learning reserves the right to remove additional content at any time if subsequent rights restrictions require it.
Wal-Mart Stores (continued)
price multiple valuation of, 7-7–10
valuation summary for, 8-12
weighted average cost of
capital (WACC)
in asset valuation methods,
7-22–23
as discount rate, 8-17–19
operating ROA and, 5-8
whistleblowers, 1-8
“white knights,”, 11-15
working capital, 5-12–14,
6-12, 10-6
WorldCom Corporation, 1-3, 1-7,
3-6, 9-11
Wyeth Inc., 11-4–5, 11-14
Z
ZETA model, of debt ratings, 10-16
I-8 Subject Index
Copyright 2012 Cengage Learning. All Rights Reserved. May not be copied, scanned, or duplicated, in whole or in part. Due to electronic rights, some third party content may be suppressed from the eBook and/or eChapter(s).
Editorial review has deemed that any suppressed content does not materially affect the overall learning experience. Cengage Learning reserves the right to remove additional content at any time if subsequent rights restrictions require it.

NAME INDEX
A
Abarbanell, J., 9-15
Aboody, D., 3-18, 4-37
Akerlof, George, 1-12, 12-22
Altman, E., 10-16, 10-20
Ante, S. E., 11-21
B
Banks, Joe, 3-17
Barth, M., 4-37, 12-22
Beatty, A., 3-18, 3-19
Beaver, W., 10-20
Beneish, M. D., 3-20
Berger, P., 3-19
Bernard, V., 3-19, 9-15
Besanko, David, 2-21
Boswell, B., 2-22
Botosan, C., 12-23
Bowen, R., 3-19
Briloff, Abraham, J., 3-18, 12-22
Broker, James, 5-29
Brown, Jane, 2-20
Brown, L., 6-19, 9-16, 9-17
Bruns, W. Jr., 3-19
Bublitz, B., 4-37
Buffett, Warren, 12-11
Bushee, B., 9-17
C
Calabrese, J., 9-16
Carhart, M., 9-17
Catan, T., 11-21
Chakravort, J., 2-24
Chamberlain, S., 3-18
Chan, S., 4-37
Chang, J., 3-20
Chapman, C., 9-16
Choe, H., 11-20
Clark, M. L., 2-23
Claus, J., 8-16
Clement, M., 9-16
Coase, R., 2-23
Coggin, T., 9-18
Collins, J., 3-19
Collins, W. E., 3-20
Collis, David J., 2-21
Colvin, G., 9-16
Copeland, T., 8-16
Cotter, J., 12-23
Coval, J. D., 10-21
Cowen, A., 9-17
Cuomo, C., 2-23
D
Dann, L., 12-22
Datar, S., 11-20
DeAngelo, L., 3-18
Dechow, P. M., 3-18, 3-20, 7-17, 9-17
Desai, H., 12-22
Dranove, David, 2-21
DuCharme, L., 3-19
Dukes, R., 4-37
Dyckman, T., 4-37
E
El-Gazzar, S., 4-36
Elliott, J., 3-20, 4-36, 4-37, 12-22
Ettredge, M., 4-37
Exstein, M., 2-23
F
Fabozzi, F., 9-18
Fama, E., 9-15
Fatcat, Joe, 6-18
Fernholz, Tim, 6-19
Ferson, W., 9-18
Foster, G., 3-20, 6-18, 9-16
Francis, J., 3-20, 4-36, 7-18, 9-16
Frankel, R., 9-15, 11-20, 12-22
Freeman, R., 6-18, 9-16
G
Gebhardt, W., 8-16
Ghemawat, Pankaj, 2-21
Gilson, S., 9-16
Givoly, D., 9-16
Grant, Robert M., 2-21
Griffin, P., 9-16
Grinblatt, M., 9-17
Groysberg, B., 6-19, 9-16, 9-17
Gui, Y., 9-16
Guidry, F., 3-18
H
Hagerman, R., 9-16
Hamel, G., 2-22
Hand, John, 3-19, 10-20
Handler, Richard, 12-14
Hanna, D., 4-36
Harding, D., 2-23
Harianto, F., 11-20
Healy, Paul, 1-12, 2-23, 3-19, 3-20,
4-36, 4-37, 6-18, 6-19, 9-15,
9-16, 9-17, 11-20, 12-22, 12-23
Hendricks, D., 9-17
Hertzel, M., 12-22
Heymann, N., 9-16
Hirschey, M., 4-37
Holmstrom, Bengt, 12-21
Holthausen, R., 3-18, 9-15, 10-20
Howe, C., 4-36, 4-37
Hutton, A. P., 7-17, 9-17, 12-23
I
Icahn, Carl, 11-3
Imhoff, E., 4-37
Irani, A., 12-22
J
Jacob, J., 9-16
Jain, P., 12-22
Jegadeesh, N., 9-16
Jensen, Michael, 9-17, 11-19, 12-21
Johnson, A., 11-21
Johnson, M., 12-22
Jones, J., 3-18
Jurek, J., 10-21
K
Kaplan, R., 3-19, 10-13, 10-20
Kaplan, S., 11-19
Kasznik, R., 3-18, 12-22
Kensinger, J., 4-37
Khang, K., 9-18
Khanna, T., 1-12, 2-23, 2-24
Kimbrough, M., 12-22
Koller, T., 8-16
L
Lakonishok, J., 9-15, 9-16, 9-17, 9-18
Lang, L., 2-23
Lang, M., 3-19, 12-23
Larcker, D., 3-18, 9-15
Lee, C., 7-18, 8-16, 9-15
Leftwich, R., 10-20
Leone, A., 3-18
I-9
Copyright 2012 Cengage Learning. All Rights Reserved. May not be copied, scanned, or duplicated, in whole or in part. Due to electronic rights, some third party content may be suppressed from the eBook and/or eChapter(s).
Editorial review has deemed that any suppressed content does not materially affect the overall learning experience. Cengage Learning reserves the right to remove additional content at any time if subsequent rights restrictions require it.
Lev, B., 4-37
Lilien, S., 4-36
Lin, H., 9-17
Linsmeier, T., 4-37
Lintner, J., 7-18
Lipe, R., 4-37
Lundholm, R., 3-19, 12-23
Lys, T., 9-16
M
Machlin, J., 11-20
Magliolo, J., 3-18, 3-19
Majluf, N., 11-20
Malkiel, B., 9-17
Mankins, M. C., 2-23
Martin, J., 4-37
Masulis, R., 12-22
Matsumoto, D., 9-17
Maxx, T. K., 2-12
Maydew, E., 3-20
Mayers, D., 12-22
McGahan, A. M., 2-21
McNichols, M., 3-20, 4-37, 9-17
Meckling, W., 12-21
Mehra, P., 2-24
Mendenhall, R., 3-20
Michaely, R., 9-17
Miles, J., 11-20
Miller, G., 12-23
Miller, M. H., 7-18
Modigliani, F., 7-18
Mohanram, P., 9-15, 9-17
Montgomery, C., 2-21, 2-23
Moyer, S., 3-18
Murphy, K., 12-22
Murrin, J., 8-16
Myers, J., 7-18
Myers, S., 4-36, 4-37, 11-20
N
Neale, M., 9-16
Nichols, W., 3-20
Nissim, D., 5-30
Noe, C., 9-16
Noel, J., 3-19
Nohria, N., 6-19
Noreen, E., 9-16
O
O’Brien, P., 6-18, 9-15, 9-16
Ohlson, J., 6-18, 7-17, 7-18, 10-20
Olsson, P., 7-18
Oswald, D., 7-18
P
Palepu, Krishna, 1-12, 2-23, 2-24, 3-19,
3-20, 4-36, 9-15, 9-16, 9-17, 11-
19, 11-20, 12-22, 12-23
Palmer, A. T., 2-22
Pastena, V., 4-36
Patalon, William, III, 11-20
Patel, J., 9-17
Penman, S., 5-30, 6-18, 7-18, 9-15
Petroni, Kathy, 3-19
Porter, Michael E., 2-21, 2-22
Prahalad, C. K., 2-22
R
Raedy, J., 9-15
Rahman, S., 9-18
Richardson, G., 4-37
Right, John, 6-17
Rock, S., 3-18
Rozeff, M., 6-19, 9-16
Ruback, Richard, 4-36, 11-19, 11-20
S
Scharfstein, D., 9-17
Scherer, F. M., 2-21
Schipper, K., 2-23, 3-20
Scholes, M., 3-18, 5-30
Schorgi, T., 2-23
Serafeim, G., 6-18, 6-19
Shackelford, D., 3-19
Shanley, Mark, 2-21
Sharma, C., 2-23
Sharma, S., 2-24
Shaw, W., 3-20
Shiller, Robert, 9-16
Shleifer, A., 9-15, 9-17, 9-18
Shores, D., 3-19
Simon, Bill, 3-16
Singh, H., 11-20
Skinner, D., 12-22, 12-23
Sloan, R. G., 3-18, 3-20, 7-17,
9-15, 9-17
Smith, A., 2-23
Smith, Joe, 1-11, 2-20
Soffer, L., 9-16
Sohn, S., 9-16
Sougiannis, T., 4-37, 7-18
Srinivasan, G., 6-18
Stafford, E., 10-21
Stein, J., 9-17
Steinberg, Joseph, 12-12
Stulz, R., 2-23
Su, C., 2-23
Summers, Larry, 1-11
Sunder, S., 9-15, 9-17
Swaminathan, B., 7-18, 8-16, 9-16
Sweeney, A., 3-18, 3-20
T
Tasker, S., 12-22
Tata, Ratan, 2-17
Teoh, S. H., 3-20, 12-22
Thaler, R., 9-15
Thomas, J., 8-16, 9-15
Titman, S., 9-17
Travlos, N., 11-20
Tuna, I., 12-23
U
Urwitz, G., 10-20
V
Vincent, L., 4-36
Vishny, R., 9-15, 9-17, 9-18
W
Wahlen, J., 3-19
Wasley, C., 4-37
Watts, R., 3-18
Weber, J., 2-22
Weddigen, R. M., 2-23
Weiss, I., 3-20
Welch, I., 3-20, 12-22
Welch, Jack, 9-8
Welker, M., 12-23
Wermers, R., 9-17
Weygandt, J., 4-37
Wilson, G. P., 3-18
Wilson, P., 3-20
Wolfson, M., 3-18, 5-30, 11-20
Womack, K., 9-17
Wong, T. J., 3-20, 12-22
Wright, D., 4-37
Wysocki, P., 12-23
Y
Yruma, E., 2-23
Yu, G., 6-18
Z
Zeckhauser, R., 9-17
Zimmerman, J., 3-18, 12-22
Zmijewski, M., 9-16, 10-20
I-10 Name Index
Copyright 2012 Cengage Learning. All Rights Reserved. May not be copied, scanned, or duplicated, in whole or in part. Due to electronic rights, some third party content may be suppressed from the eBook and/or eChapter(s).
Editorial review has deemed that any suppressed content does not materially affect the overall learning experience. Cengage Learning reserves the right to remove additional content at any time if subsequent rights restrictions require it.
